Detecition changes in irrigated area using
multi-temporal MODIS and land surface model
surface temperature within Amu Darya Delta
著者
Jacqueline Muthoni MBUGUA, Yoshiya TOUGE, So
KAZAMA, Temur KHUJANAZAROV, Kenji TANAKA
journal or
publication title
水工学論文集 = Annual journal of hydraulic
engineering, JSCE
volume
75
number
2
page range
I_277-I_282
year
2019-11
URL
http://hdl.handle.net/10097/00130919
DETECTING CHANGES IN IRRIGATED AREA
USING MULTI-TEMPORAL MODIS AND LAND
SURFACE MODEL SURFACE TEMPERATURE
WITHIN AMU DARYA DELTA
Jacqueline Muthoni MBUGUA
1, Yoshiya TOUGE
2, So KAZAMA
3, Temur
KHUJANAZAROV
4, and Kenji TANAKA
51Member of JSCE, Dept. of Civil Eng., Tohoku University
(6-6-06 Aza-Aoba, Aramaki, Aoba-ku, Sendai 980-8579, Japan) E-mail:[email protected]
2Member of JSCE, Assistant Professor, Dept. of Civil Eng., Tohoku University
(6-6-06 Aza-Aoba, Aramaki, Aoba-ku, Sendai 980-8579, Japan) E-mail:[email protected]
3Member of JSCE, Professor, Dept. of Civil Eng., Tohoku University
(6-6-06 Aza-Aoba, Aramaki, Aoba-ku, Sendai 980-8579, Japan) E-mail:[email protected]
4Member of JSCE, Researcher, Disaster Prevention Research Institute, Kyoto University
(Gokasho, Uji, Kyoto 611-0011, Japan) E-mail: [email protected]
5Member of JSCE, Associate Professor, Disaster Prevention Research Institute, Kyoto University
(Gokasho, Uji, Kyoto 611-0011, Japan) E-mail: [email protected]
The Amu Darya delta is an irrigation intensive region located in an arid drought-prone part of the Aral Sea basin. Due to irrigation which is characterized by high water application rates, the groundwater level is high and has resulted in secondary salinization. This coupled with the frequent droughts causes the irri-gation area to constantly change for farmers to adapt to cropping environmental problems and the changing annual climate. However, obtaining an accurate report of the actual distribution of the irrigated area has proven to be difficult even to the local government and local agricultural institutes. This study aims to assess the potential of using Land Surface Temperature (LST) from MODIS and a Land Surface Model (LSM) to detectannual changes in irrigated area. 3 indices were developed using LST by MODIS and LSM based on the concept of heat capacity difference between water and soil. The LSM provides LST for ideal conditions while MODIS provides the actual LST. A combination of the two enables the elimination of external influence on LST such as rainfall and geological variations which may impact on the LST. A distributed map of all the 3 indices shows the potential of LST in detecting drought. The irrigation fraction during a drought year was observed to be lower as compared to that of a normal year. This was true espe-cially further away from the water source due to water scarcity. In addition, a comparison of the sum of all the meshes in the study area for each of the 3 indices with the volume of water released from the Tuyamuyun reservoir shows a similar trend. Tuyamuyun is indicative of water availability in this drought-prone region, therefore, the indices developed can be used to indicate irrigation activity here.
Key Words: Irrigation, MODIS, LSM, Drought, Amu Darya delta
1. INTRODUCTION
In the past 50 years alone, the global area equipped for irrigation is estimated to have increased by more than 100 percent1).Irrigated agriculture currently ac-counts for more than 70 percent of water withdrawal from rivers, lakes and groundwater aquifers making it the principal consumer of freshwater resources.
Many of the low rainfall regions such as the Middle East, Northern Africa, and Central Asia, have most of their exploitable water already withdrawn. It is esti-mated that approximately 80 to 90percent of this wa-ter is going to agriculture, making rivers and aquifers depleted beyond any sustainable level2).
In Central Asia, the Union of Soviet Socialist Re-publics (USSR) installed a massive scale irrigation
Journal of Japan Society of Civil Engineers, Ser. B1 (Hydraulic Engineering), Vol. 75, No. 2, I_277-I_282, 2019.
project within the Aral Sea basin. This led to a rapid expansion of irrigation from the late 19th century un-til the collapse of the USSR in 1991. As a result, the two main influent rivers to the Aral Sea; Amu Darya and Syr Darya suffered diminished inflow to their delta as more water became diverted for irrigation purposes (Furrow irrigation which is the main mode of irrigation in this basin is very water intensive). The amount of water reaching the sea significantly re-duced, leading to its shrinking. The area of the sea is currently approximately 10 percent of its original area3) consequentially plunging the region into a deep environmental crisis. This signifies one of the great-est environmental tragedies of the 20th century 4,5). Ir-rigation has resulted in the salinization of soils ren-dering some lands unusable. FAO, (2016) reported that the assessment of salinization at the national level in Uzbekistan was found to be difficult and that very little information on the subject could be found6). The actual irrigated area and crop type change annually not only due to the annual climatic variability but also as a strategy for farmers to adapt to irrigation-induced problems such as increasing sal-inization of soil.
Irrigation water is an important part of the hydrol-ogy cycle and has thus been included in recently de-veloped hydrological models both at the basin and global scale7,8).These hydrological models are how-ever based on the concept of fixed land use.The var-iability of irrigated area is an important component to be considered as it impacts the heat and water balance in the basin. Central Asia is a region where the land use changes dynamically. It is difficult to obtain an accurate estimation of the irrigated area because col-lecting data in a wide region is difficult especially in developing countries.
On a global scale, several attempts have been made to determine the spatial extent of irrigated land. The United States Geological Survey (USGS) Global Land Cover Characterization (GLCC) map is one such example. The Global Ecosystems legend identi-fies 4 irrigated classes. However, in addition to this dataset being static, irrigated areas are not isolated and are only part of a broader classification. Since the reviewed global land cover products are static, the land cover classification provided does not reflect land cover variability which may be caused by a re-duction of the irrigated area especially during drought or dry years. In this case, the non-irrigated area may incorrectly be classified as irrigated.
In the regional scale, several studies have success-fully used NDVI derived phenology and other cli-mate and vegetation based indices to assess the spa-tial extent of irrigated areas. A study on crop mapping using NDVI showed that irrigated crops maintain higher NDVI than non-irrigated crops throughout
most of the growing season making it possible to dis-criminate the two9). Additionally, Gumma et al., (2014) accurately captured the seasonal variability in rice crop spatial extent and area in Bangladesh with an R-squared value of more than 90 percent10). How-ever, some of the native plants in the Aral Sea basin, have long roots of between 10 to 30m and because the groundwater level in the delta is high, native plants flourish here making it difficult to separate ir-rigated area using NDVI.
Information on the spatial extent of irrigated areas found in statistical databases such as the Food and Agriculture Organization (FAO) AQUASTAT data-base is mentioned as ‘area equipped for irrigation’. This is the definition of irrigable land and not the ac-tual irrigated area. Obtaining an accurate report of the actual distribution of irrigated area has proven to be a problem even to the local government and local ag-ricultural institutes.
In this research, a combination of satellite analysis and Land Surface Modelling approach was per-formed to detect the irrigated area. A global dataset developed by Doll (2002) showing the percentage of area equipped for irrigation was used to identify the irrigable area in the basin11). The LST obtained from both MODIS and a LSM considering conditions with and without irrigation was used to detect the irriga-tion effect on heat balance in the basin. The objective of this study is to assess the annual changes in the irrigated area so as to facilitate an understanding of changing water demand through climatic variables.
2. TARGET BASIN
The Amu Darya delta shown in Fig. 1 below located in the Karakalpakstan republic Uzbekistan and partly in Turkmenistan is the target area for this study. Tuyamuyun dam located in the lower part of the delta has the primary purpose of providing water for irri-gation. This delta is located in the driest part of Uz-bekistan and is historically prone to droughts.
In 2000, 2001 and 2008, drought caused numerous artificial reservoirs in Karakalpakstan to dry up, caus-ing major water shortages not just for irrigation but also for drinking water12). In 2000 and 2001 about 90% of the rice crop and 75% of the cotton crop were lost due to drought13). This delta is also located in one of the most sensitive areas to climate change in terms of irrigation water demand in the Aral Sea Basin14). Due to high water application rates, this region greatly suffers from secondary salinization as a result of rising water levels. Ibrakhimov et al., (2007) re-ported that in the Khorezm region located in the Amu Darya delta Uzbekistan, secondary soil salinization is annually adding 3.5 to 14 tons per hectare of salts on average15).
3. METHODOLOGY
Since water has a higher heat capacity than soil, soil with high soil moisture does not immediately re-spond to temperature changes. Moreover, increased evapotranspiration as a result of the presence of irri-gation water further reduces the LST in the day time. LST by the satellite represents the actual conditions on the ground while the LSM was used to provide the estimated ideal LST for both conditions with and without the influence of irrigation. The mesh was as-sumed to be fully irrigated when simulating irrigation conditions and fully non irrigated while simulating conditions without irrigation. Since MODIS provides the surface temperature for the actual conditions on the ground, when attempting to detect irrigation, it is sometimes impacted upon by precipitation. Addition-ally, effects on LST due to geological variability can-not be isolated. The purpose of the simulation of LST using the LSM is to remove the influence of this cli-matology and geological variability which results in temperature difference. LST is a difficult parameter to estimate and to validate in both satellite analysis and LSM because it is controlled by the atmospheric state and surface emissivity and requires the knowledge of many influencing parameters16). De-spite this, the simulation of LST by the model suf-fices in the isolation of the reduced temperature caused by irrigation and removing climatic and geo-logical influence on temperature by considering cli-matological differences and difference in elevation. In this study, the actual LST by MODIS and the ideal LST by the LSM are used to isolate anthropogenic effects on LST.
(1) Utilized satellite data
MOD11A1 product which is a level 3 gridded product with a temporal resolution of 12 hours and a spatial resolution of 1km was used for LST data. LST
values at all grids are from single clear sky MODIS observations. MODIS collects daily observations from the study area at approximately 4 pm and 3 am local time. This study used MODIS data from 2001 when it was first available.
(2) SiBUC Land Surface Model
Simple Biosphere including Urban Canopy (SiBUC)17) considers artificial water operation in irri-gated land and water and heat balance on an urban area. The irrigation scheme in the green area sub-model caters for artificial water control. The basic concept of the irrigation scheme is to maintain soil moisture of the green area above minimum soil mois-ture defined for each growing stage of the crop. Irri-gation scheme in this model was improved based on field investigation to consider local furrow irrigation rules in the basin18).
For meteorological input, Japanese 55-year Rea-nalysis (JRA-55) was used to provide forcing data to the model. JRA-55 is a 55-year comprehensive global atmospheric reanalysis using a data assimilation sys-tem to provide a homogeneous climate dataset19). Since all the data is provided at a temporal resolution of between 3 and 6 hours, hourly data was linearly interpolated and spatial interpolation was done using Inverse distance weighting (IDW). Global Satellite Mapping of Precipitation (GSMaP) version 6 data was used for precipitation data. This is a real-time ra-dar derived dataset and it was used in order to isolate irrigation effect on soil moisture from that caused by rainfall.
Other datasets used in the simulation include GLCC and ECOCLIMAP (http://www.cnrm.meteo. fr/gmme/PROJETS/ECOCLIMAP/page_ecoclimap. htm) for land surface conditions such as land use, ge-ological conditions, and leaf area index.
LST by the LSM was simulated using SiBUC LSM with a spatial resolution of 5km.
(3) Irrigation index
Based on this property, the following Eq.(1-(3) be-low were used to develop LST based indices in an attempt to detect the irrigated area.
𝑅1 = ∆𝑆𝑇𝑆𝐴𝑇− ∆𝑆𝑇𝐿𝑆𝑀_𝑁𝐼 (1) 𝑅2= 𝑆𝑇𝑆𝐴𝑇 𝑑𝑎𝑦− 𝑆𝑇 𝐿𝑆𝑀_𝑁𝐼𝑑𝑎𝑦 𝑆𝑇𝐿𝑆𝑀_𝐼𝑅𝑑𝑎𝑦 − 𝑆𝑇𝐿𝑆𝑀_𝑁𝐼𝑑𝑎𝑦 (2) 𝑅3= 𝑆𝑇𝑆𝐴𝑇 𝑑𝑎𝑦− 𝑆𝑇 𝐿𝑆𝑀_𝑁𝐼𝑑𝑎𝑦 𝐴𝑣𝑒𝑆𝑇𝑆𝐴𝑇𝑑𝑎𝑦− 𝐴𝑣𝑒𝑆𝑇𝐿𝑆𝑀_𝑁𝐼𝑑𝑎𝑦 (3) where, 𝑅 is irrigation index, 𝑆𝑇 is surface temper-ature, ∆𝑆𝑇 is surface temperature difference between day and night, 𝐴𝑣𝑒𝑆𝑇 is long term average of surface
temperature. And suffix of 𝑆𝐴𝑇 means observed by satellite, 𝐿𝑆𝑀_𝐼𝑅 and 𝐿𝑆𝑀_𝑁𝐼 means simulated with full irrigation and without irrigation, respec-tively, and 𝑑𝑎𝑦 means daytime.
Eq.(1) above was used to remove the climatic in-fluences and the geological difference that may affect ΔLST in order to identify the irrigation effect in a mesh. Simulated LST by the LSM without consider-ing irrigation is subtracted from MODIS LST repre-senting the actual conditions observed in the study area to isolate the irrigation effect. Eq. (2) compares the irrigation effect observed by MODIS with the ideal simulated irrigation effect. Since this is the rate of the actual irrigation effect from the ideal irrigation effect, it would reflect the irrigation fraction in the mesh. Eq.(3) compares the irrigation effect observed by MODIS with the average simulated irrigation ef-fect. This is used to detect a drought event by com-paring the irrigation effect in a given year to an aver-age year.The annual irrigation variability between a given year and an average year can therefore be com-pared.
(4) Statistical data used
The distribution of irrigated area in the study was retrieved from Doll (2002)11), and the amount of wa-ter discharged to the study area was retrieved from the Tuyamuyun dam. Since this delta region is prone to drought, Tuyamuyun reservoir outflow should be representative of water availability in this region for irrigation.
4. RESULTS AND DISCUSSIONS
(1) Irrigation effect on surface temperature by LSM
Fig. 2 below shows monthly changes of LST in 2001 at 4 pm local time at a farm in Nukus in Kara-kalpakstan. This is based on the simulation by the LSM considering both irrigation effect in the entire mesh and without any irrigation in the same. The LST
Fig. 2 Monthly changes of LST by LSM at 4 pm local time in Nukus
for both cases shows a similar trend at the start of the year with the LST considering irrigation dropping significantly during the irrigation period in the months of March to September before resuming a similar trend again. In this simulation, LST was phys-ically calculated using the local climatology and ge-ology, the results will then be compared with actual LST to detect irrigation.
(2) Detecting drought using LST
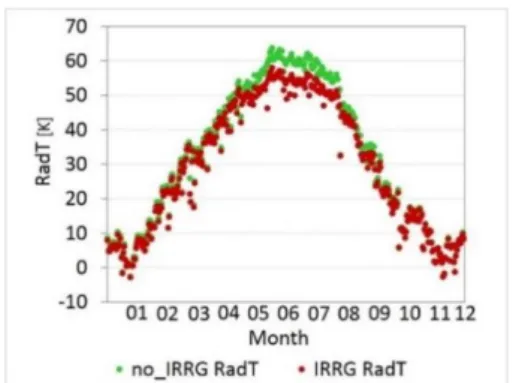
During the irrigation season, LST can be used to detect a drought year or a dry year. Such a year is characterized by scarcity of water leading to the abandonment of some irrigation land. A time series analysis of the day and night time LST difference us-ing MODIS, in an irrigated mesh in Nukus, shows an approximate 4-degree difference in LST between an average year and a drought year as shown in Fig. 3 below. Due to some missing data as a result of cloud cover, a 30 point moving average was computed to show the LST trend during a drought year and an av-erage year as seen by the green and red lines in Fig. 3 below.
A drop in temperature can be observed from June to October when irrigation for cotton is typically car-ried out and remains relatively unchanged until the end of summer where it drops sharply again. During the irrigation season, this day and night time differ-ence of LST is approximately 20K in 2001 which is a drought year as opposed to 16K in 2017. Since MODIS has a much coarse spatial resolution than the farm-scale size in this region, the fraction of irrigated area is higher near the water source and reduces with an increase in distance. The irrigated area closer to the water source will have a lower LST than those further away.
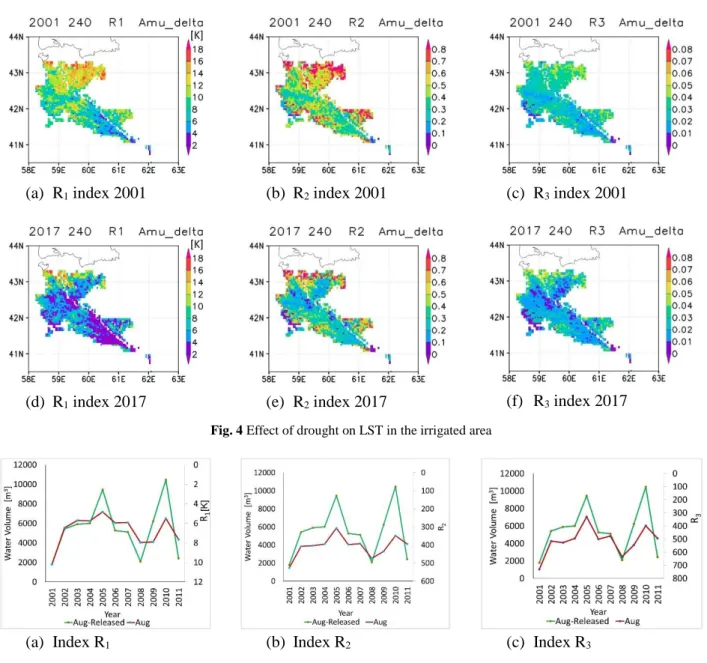
Fig. 4 below shows the potential of the 3 indices to detect drought effect on irrigated area during the irri-gation season. During a dry year, the irriirri-gation frac-tion away from the water source is reduced due to water scarcity resulting in a higher LST. The indices were computed from a 10-day average of LST data.
Fig. 3 Monthly changes of the difference of day and night time LST by MODIS at Nukus
Fig. 4 (a-c) shows a higher value for all the indices in the month of August 2001 especially in the north-ern part of the delta. In 2001, some areas in the north were severely affected by drought and could not be irrigated. This can be clearly viewed by the proposed LST indices. R1 shows changes to the irrigated area due to anthropogenic effect which in this case, relates to the reduction of the irrigated area due to drought. R2 seems to be directly related to the irrigation frac-tion and therefore has a much clear result on the im-pact of drought than R1 and R3. It compares an ideal natural simulated effect of irrigation and the actual irrigation condition. R3 seems least suitable of the 3 since it compares the actual condition to average changes which may include drought conditions in the past. Fig. 4 (d-f) shows an average year where the ir-rigation fraction is much larger as compared to 2001.
A comparison of the monthly sum of water volume released from the Tuyamuyun dam in August from 2001 to 2011 and the 3 indices also shows the ability
of the indices to detect irrigation in the meshes. The sum of each of the LST indices for all the meshes in the delta was compared to the total volume released from the Tuyamuyun dam. Fig. 5 below shows the results from this comparison. (a) shows the average sum of R1 compared with the dam water volume re-leased while (b and c) show the summation of R2 and R3 respectively compared with the water volume re-leased from the dam. A similar trend can be seen be-tween the water released and the indices. The higher the volume of water released for irrigation, the lower the value of the indices. Drought occurrence in 2001 and 2008 is also clearly indicated by these indices. However, since this analysis involved only the sum-mation of indices, the result may be affected by meshes with extreme value. For further research, the irrigation fraction of all meshes needs to be analyzed more precisely and verified by local data to elucidate this. The month of August had the best results of 5 irrigated months observed (May to September).
(a) R1 index 2001 (b) R2 index 2001 (c) R3 index 2001
(d) R1 index 2017 (e) R2 index 2017 (f) R3 index 2017
Fig. 4 Effect of drought on LST in the irrigated area
(a) Index R1 (b) Index R2 (c) Index R3
5. CONCLUSIONS
In this delta region, the area under irrigation in changing annual climatic conditions is unknown. This study uses LSM and MODIS LST to detect the irrigated area. Computation of LST by the LSM pro-vided the ideal natural LST while actual LST was provided by MODIS. This was necessary to remove climatic and geological influence on LST to identify anthropogenic influence which might affect the tem-perature. Tuyamuyun dam water volume data pro-vided a representation of water availability in this delta region which is prone to drought.
Due to the difference in heat capacity between wa-ter and soil, it was expected that soil with high mois-ture content will not respond immediately to temper-ature changes. Therefore, 3 indices were developed to detect the irrigated area.
The results show the potential of the indices to de-tect irrigated area and the effect of drought on this area. Irrigation fraction during a drought year was ob-served to be lower as compared to that of a normal year especially further away from the water source due to water scarcity. This was further confirmed by the summation of values for each index for all the meshes which were compared to the released volume from the Tuyamuyun dam.
ACKNOWLEDGMENT: This research was
par-tially supported by the Ministry of Education, Sci-ence, Sports and Culture, Grant-in-Aid for Scientific Research (B), 2017-2022 (17H04585, Yoshiya Touge) and the collaborative research program (29G-11) of the Disaster Prevention Research Institute of Kyoto University.
REFERENCES
1) FAO. : Food and Agriculture Organization, FAOSTAT, 2017. Available at: http://www.fao.org/faostat/en/#data/ RL. (Accessed: 8th May 2019)
2) FAO. : The State of the World’s land and water resources for Food and Agriculture. Managing systems at risk. Food and Agriculture Organization, doi:978-1-84971-326-9, 2011.
3) Micklin, P. and Aladin, N. V. : Reclaiming the Aral Sea, Sci. Am. 298, 64–71, 2008.
4) Micklin, P. : Managing Water in Central Asia, Royal Institute of International Affairs, 2000.
5) Glantz, M. H. : Creeping environmental problems and sustainable development in the Aral Sea basin, Cambridge University Press, 1999.
6) FAO. : AQUASTAT website, Food and Agriculture Organization, Central Asia, 2016. Available at: http://www.fao.org/nr/water/aquastat/countries_regions/pr
ofile_segments/asiaC-EnvHea_eng.stm. (Accessed: 27th May 2019)
7) Boucher, O., Myhre, G. and Myhre, A. : Direct human influence of irrigation on atmospheric water vapour and climate. Clim. Dyn. 22, 597–603, 2004.
8) Gordon, L. J., Steffen, W., Jönsson, B. F., Folke, C., Falkenmark, M., and Johannessen, Å. : Human modification of global water vapor flows from the land surface. Proc. Natl. Acad. Sci. U. S. A. 102, 7612–7617, 2005.
9) Wardlow, B. D., Egbert, S. L. and Kastens, J. H. : Analysis of time-series MODIS 250 m vegetation index data for crop classification in the U.S. Central Great Plains. Remote Sens. Environ. 108, 290–310, 2007.
10) Gumma, M. K., Thenkabail, P. S., Maunahan, A., Islam, S. & Nelson, A. : Mapping seasonal rice cropland extent and area in the high cropping intensity environment of Bangladesh using MODIS 500m data for the year 2010. ISPRS J. Photogramm. Remote Sens. 91, 98–113, 2014. 11) Döll, P. and Siebert, S. : Global modeling of irrigation
water requirements. Water Resour. Res. 38, 8-1-8–10, 2002. 12) Eurasianet. : Uzbekistan’s Losing Battle Against Drought,
2016. Available at: https://eurasianet.org/uzbekistans-losing-battle-against-drought. (Accessed: 29th May 2019) 13) Frenken, K. : (FAO), Irrigation in Central Asia in figures.
AQUASTAT Survey-2012. Irrigation in Central Asia in figures. AQUASTAT Survey-2012 39, 2012.
14) Touge, Y., Tanaka, K. and Nakakita, E. : Estimation of Climate Change Impacts on Water Balance in the Aral Sea Basin using Terrestrial Water Circulation Model. J. Japan Soc. Civ. Eng. Ser. G (Environmental Res. 71, I_183-I_188, 2015.
15) Ibrakhimov, M., Khamzina, A., Forkutsa, I., Paluasheva, G., Lamers, J. P. A., Tischbein, B., and Martius, C. : Groundwater table and salinity: Spatial and temporal distribution and influence on soil salinization in Khorezm region (Uzbekistan, Aral Sea Basin). Irrig. Drain. Syst. 21, 219–236, 2007.
16) Copertino, V. A., Di Pierro, M., Scavone, G. and Telesca, V. : Comparison of algorithms to retrieve land surface temperature from LANDSAT-7 ETM+ IR data in the basilicata ionian band. Tethys 2012, 25–34, 2012. 17) Tanaka, K. : Development of the new land surface scheme
SiBUC commonly applicable to basin water management and numerical weather prediction model. Ph.D. thesis, Kyoto University, 2005.
18) Touge, Y., Tanaka, K., Khujanazarov, T., Toderich, K., Kozan, O., and Nakakita, E. : Developing a Water Circulation Model in the Aral Sea Basin Based on in situ Measurements on Irrigated Farms. J. Arid L. Stud. 25, 133– 136, 2015.
19) Kobayashi, S., Ota, Y., Harada, Y., Ebita, A., Moriya, M., Onoda, H., Onogi, K., Kamahori, H., Kobayashi, C., Endo, H. and Miyaoka, K. : The JRA-55 Reanalysis: General Specifications and Basic Characteristics. J. Meteorol. Soc. Japan. Ser. II 93, 5–48 (2015).
(Received May 31, 2019) (Accepted August 7, 2019)