International and Interprefectural Migration
in Japan: Implications for the Spatial
Assimilation Theory
著者
Murayama Koji, Nagayasu Jun
journal or
publication title
DSSR Discussion Papers
number
116
page range
1-23
year
2020-07
URL
http://hdl.handle.net/10097/00128353
Data Science and Service Research
Discussion Paper
Discussion Paper No. 116
International and Interprefectural Migration in Japan:
Implications for the Spatial Assimilation Theory Koji Murayama and Jun Nagayasu
July, 2020
Center for Data Science and Service Research Graduate School of Economic and Management Tohoku University 27-1 Kawauchi, Aobaku
International and Interprefectural Migration in Japan:
Implications for the Spatial Assimilation Theory
Koji Murayama
†,
Jun Nagayasu
‡Abstract
We study the spatial assimilation of foreign residents in Japan by analyzing the con-centration tendency among foreigners who arrive from overseas and relocate within Japan. Using spatial models, we find that immigrants from overseas tend to move to ethnically concentrated prefectures in Japan; this finding aligns with the spa-tial assimilation theory. In contrast, this trend weakens substanspa-tially with their subsequent domestic relocation in Japan, and it differs by national group. Slow assimilation is found among nationals from countries characterized as being low-income or culturally dissimilar from Japan.
Keywords: spatial assimilation; social integration; spatial interaction model; mi-gration; Japan
JEL classification:
†Tohoku University, Graduate School of Economics and Management. Address: 27-1 Kawauchi,
Aoba-ku, Sendai, Miyagi 980-8576 JAPAN. Email: [email protected], Tel.: +81 22 795 6265, Fax: +81 22 795 6270.
‡Tohoku University, Graduate School of Economics and Management. Address: 27-1 Kawauchi,
Aoba-ku, Sendai, Miyagi 980-8576 JAPAN. Email: [email protected], Tel.: +81 22 795 6265, Fax: +81 22 795 6270.
1
Introduction
In 2018 the Japanese government announced the Basic Policy on Economic and Fiscal Management and Reform, which sets out a new immigration policy.1 This policy rec-ognizes that Japan’s labor shortage is becoming very serious, and that foreign workers are needed to fill job vacancies. Unlike immigration policies in other advanced countries, Japan’s new policy is not limited to foreign personnel in traditional specialized and tech-nical fields: it also includes those who have more basic expertise and skill levels. As a result, the number of foreigners immigrating to Japan has rapidly increased in recent years, and the majority of them are from China or Korea.
According to the Ministry of Health, Labor and Welfare (MHLW), foreign workers in Japan can be categorized as per the following employment status typology: those who (1) are eligible to work, (2) stay based on their status, (3) participate in technical intern-training programs, (4) conduct designated activities, and (5) conduct nonqualified activities.2 In October 2017, the distribution of foreign workers among the five categories
was approximately 19%, 36%, 20%, 2%, and 23%, respectively. Many foreigners from the United States, the United Kingdom, and South Korea—most of whom are relatively wealthy—are employed in professional and technical fields. Filipino, Brazilian, and Peru-vian individuals tend to be permanent or long-term residents. Many Japanese descendants in Brazil and Peru come to work in Japan and hold permanent resident status, and many Filipinos have obtained permanent residency through intermarriage with Japanese.
It is generally believed that foreigners do not assimilate well into Japanese society, and that friction between Japanese and foreigners will be conspicuous in the near fu-ture (Iguchi, 2011). The excessive concentration of foreigners in certain areas has been considered a failure of integration policy and has prevented foreigners’ integration and participation in the destination countries (Andersson, 1998; Bolt and van Kempen, 2003; Wright and Ellis, 2000). For immigrants’ children, growing up in an ethnically concen-trated environment can have adverse economic effects; those effects can persist across generations, resulting in slow integration and difficulty in obtaining employment (Asselin
1While the government claims that this is not an immigration policy, the Basic Policy does relax entry
requirements for foreigners who wish to work in Japan, and so here it is considered an immigration policy.
2Under the status of “designated” activities, foreign nationals are permitted to work only in activities
et al., 2006). Therefore, the spatial distribution of immigrants (i.e., spatial assimilation) is considered a key integration indicator (Alba and Foner, 2015). Japan’s current situation is similar to Europe’s past immigration experiences, in that it lacks a social integration policy that would eliminate discord between foreigners and local individuals and prevent foreigners from feeling isolated from society.
Against this background, we study the adaptability of foreigners in Japan by analyz-ing the relationship between foreign residents’ backgrounds and their residential location. In particular, based on the spatial assimilation theory (SAT)—which we describe in the next section—we compare the concentration tendency of international migrants (i.e., im-migrants from other countries to Japan) with that of foreign im-migrants relocating within Japan (i.e., migrants moving from one Japanese prefecture to another). To the best of our knowledge, the current study is the first comprehensive attempt to apply the SAT in this way to the Japanese context.
2
Spatial assimilation theory
The geographic concentration of immigrants has been used to evaluate the SAT, which was first put forward in the early 20th century to study the integration of European immigrants with Americans in the United States (Park and Burgess, 1921). According to the SAT, immigrants will concentrate in the same ethnic city, not only to overcome disadvantages associated with language barriers, information uncertainty, and low socioeconomic status, but also to make the best use of employment and welfare conditions attributable to being in a community of immigrants. However, they can improve their local language skills, cultural fitness, and socioeconomic status over time, and eventually move about the country freely—even to suburban areas where few immigrants reside (Massey and Denton, 1985). In this way, immigrants eventually make more contact with local people and become assimilated into society.
Such assimilation is said to continue and progress across generations (Alba and Nee, 2003); however, the time required for spatial assimilation will be comparatively shorter if there are similarities (rather than dissimilarities) between immigrants and the local people of the target destination. Similarities among people can be measured in terms of their
level of human capital, language proficiency, and religion. Immigrants who have cultural and linguistic characteristics similar to those of the local people are, from the very start, less likely to settle in ethnically concentrated areas (Zorlu and Mulder, 2010). It follows that assimilation patterns may differ according to the immigrants’ backgrounds.
While the SAT has a strong sociological aspect, economists recognize that multi-ple changes in the residential location of immigrants stem from information uncertainty (Bodvarsson et al., 2015). A moderate concentration of immigrants creates a positive externality through cooperation among themselves, but excessive concentration is known to create for immigrants an uncontrollable externality. There is a considerable body of research on the impact of the geographical concentration of immigrants on society and on immigrants themselves. Ethnic segregation—whereby foreigners are geographically iso-lated from the local people—leads to a failure to educate immigrants, and can increase immigrants’ reliance on social welfare as well as higher unemployment rates and higher poverty and crime levels (Andersson, 1998; Bolt and van Kempen, 2003). In fact, violence among foreigners has emerged in several European cities, including London, Paris, and Amsterdam (Zorlu and Mulder, 2008). Moreover, higher geographical concentrations of foreigners are also known to increase tension and concerns among the local residents of those immigrants’ target destinations (Wright and Ellis, 2000).
Many US studies that analyze immigration concentration support the SAT. For ex-ample, ethnic groups who have had a long history of living in the United States tend to be more spatially distributed (Jones, 2003). Moreover, residential location and socioeco-nomic status are found to strongly correlate. Higher-income African–Americans are more likely to move from the center of a large city to the suburbs (Clark, 2007). Similarly, Hispanic immigrants with a higher socioeconomic status and higher English proficiency are more likely to move from ethnically concentrated areas (South et al., 2006).3
Similarly, the experience of Europe frequently supports the SAT. Zorlu and Mulder (2008) show that asylum-seekers and non-Western immigrants are most likely to move to ethnically concentrated areas in the Netherlands. In contrast, many immigrants from Western countries—which is to say, countries associated with high levels of human capital and socioeconomic status, and proximate the Dutch in terms of language and religion—
3Many other studies have shown the sluggish rate at which African–Americans in the United States
enter the country mainly as workers and with their families, and do not reside in ethnically concentrated places. Similarly, Chinese immigrants reportedly relocate, on a repeated basis, to ethnically concentrated areas of the United Kingdom (Simpson and Finney, 2009). Tammaru and Kontuly (2011) show that in Estonia, Estonian-language proficiency among immigrants and the possession of Estonian citizenship promote the movement from ethnically concentrated areas to nonconcentrated regions. However, other studies show that immigrants remain undispersed, on account of discrimination and their preference for their own ethnic community (Bolt and van Kempen, 2010).
Traditionally, SAT-related studies have focused on demographic movements to the suburbs from a city, in the latter of which immigrants tend to concentrate. However, in recent years, geologists and sociologists have argued that the topic of spatial integra-tion among immigrants should be expanded so as to focus on interregional movements (Goodwin-White, 2007). In Japan, prefecture-level relocation data are available, mak-ing it possible to focus on the movement of foreigners among prefectures (i.e., regional migration) in addition to that of immigration from overseas.4
3
Econometrics for relocation analysis
We use gravity models to study the residential relocation of international and interpre-fectural migrants; these models have been previously used to analyze international trade. However, unlike the gravity models of trade, the random utility maximization model serves as a theoretical basis for migration analysis (McFadden, 1974), where migrants will pay the cost for the move as an investment in their own human capital in order to maximize future utility. This premise is called the human capital investment theory of migration (Bodvarsson et al., 2015). Until the mid-1980s, there was the misconception that international and domestic migration are fundamentally distinct phenomena. Today, however, the idea that migration is a form of human capital investment is a fundamental unifying theme of migration theory in economics (Bodvarsson et al., 2015). Eq. (1) shows the standard gravity model.
Yod= K Xβ1 o X β2 d distβ3 od (1)
The subscript o denotes origin, and d destination. Yod is the amount of migration from o
to d. K is a constant, and Xo and Xd represent the unique characteristics of the origin
and destination, respectively. distodis the geographical distance between o and d, and β1,
β2, and β3 are parameters. In empirical analysis, Eq. (1) is examined in the natural log
form.
ln Yod = ln K + β1ln Xo+ β2ln Xd− β3ln distod (2)
Both international and regional migration models use Xo and Xd, which include
un-employment rates, per-capita gross domestic product (GDP), and population. Xd also
includes the concentration rate of foreigners, as per the SAT. Unemployment rates and income are economic factors that are thought to strongly relate to migration (Sjaastad, 1962). The population of a destination is used to proxy the size of the labor market, with a large destination population encouraging emigration from elsewhere (Bodvarsson et al., 2015). The distance is a proxy for the transaction costs of migration.
We extend the standard spatial model to capture spatial autocorrelation between migration flows; we do so by using a spatial weight matrix devised by LeSage and Pace (2008).5
Yod = ρoWoYod+ ρdWdYod+ ια + Xoβo+ Xdβd+ distodγ + ε (3)
This is known as the spatial interaction model, and it has been used for example in interstate migration analysis (Beenstock and Felsenstein, 2016) and interregional traveler analysis (Marrocu and Paci, 2013). In (3), ι is a unitary term, ε is a residual, and ρo,
ρd, α, βo, βd, and γ are parameters. Wo and Wd are origin and destination-based spatial
weight matrices, respectively.
Figure 1 depicts the theoretical implications of spatial weights on migration flows (Yod). The origin-based matrix (Wo) assigns greater weight to “flows to d from areas close
5LeSage and Pace (2008) introduced another spatial weight matrix called W
w. However, when origins
and destinations are configured in different regions, Ww cannot be created with the Kronecker product.
Therefore, Wwis omitted from analyses of international transfers (Beenstock and Felsenstein, 2016). For
to o” than to “flows to d from areas remote from o.” Therefore, WoYod is a variable that
captures the stronger spatial correlation between flows that originate from nearby areas. Similarly, the destination-based matrix (Wd) assigns greater weight to “flows to areas near
d” than to “flows to areas distant from d.” Thus, WdYod is a variable that captures the
stronger spatial correlation between flows to nearby destinations. [Figure 1]
More precisely, in our international migration analysis featuring k origin countries (k = 10) and 47 destination prefectures, Wo can be constructed using the following
specification of fWo. f Wo = 0 W12 W13 · · · W1k W21 0 W23 · · · W2k W31 W32 0 · · · W3k .. . ... ... . .. ... Wk1 Wk2 Wk3 · · · 0,
where 0 is a 47 × 47 nil matrix. The diagonal elements of W12 are an inverse of the
squared distance between capitals of origin countries 1 and 2, and other elements are 0. Wo is a 470 × 470 matrix that can be obtained by dividing all elements of fWo by the row
sum of fWo.
Similarly, Wd is a 470 × 470 matrix comprising W .
Wd= W 0 0 · · · 0 0 W 0 · · · 0 0 0 W · · · 0 .. . ... ... . .. ... 0 0 0 · · · W
The elements of W are
wij = dist−2ij P47 j=1dist −2 ij , if i 6= j 0, otherwise. (4)
wij is a 47 × 47 that is constructed using the distance between prefectures i and j (distij).
Because it is normalized to the row, the row sum of Wd is 1. Since we have 10 origin
countries and 47 destination prefectures for Yod in (3), Wd is also a 470 × 470 matrix.
In our analysis of interprefectural migration, the origins and destinations involve 47 Japanese prefectures. Therefore, Wo = WN I and Wd = IN W , where W is a 47 × 47
matrix with diagonal elements equal to wij in (4) and other elements 0, I is a 47 × 47
unitary matrix, and N is the Kronecker product. There are 2209 combinations of o and d for Yod in (3), and so Wo and Wd are both 2209 × 2209 matrices.
Finally, as the spatial lag variables (WoYod, WdYod) may be endogenous, to estimate
Eq. (3), we use spatial two-stage least squares (S2SLS) to eliminate any endogeneity bias. We follow Badinger and Egger (2011), who set all exogenous explanatory variables to Z, and the instrumental variables for the endogenous variables WoYod and WdYod to
H = (Z, WoZ, WdZ, Wo2Z, Wd2Z, WoWdZ). Here, all explanatory variables, other than
spatial lag variables, are used as Z.
4
Data
We obtained migration data from the Statistics Center of the Ministry of Internal Affairs and Communications. The National Census 2010 (Kokuseichosa) captured the number of foreign migrants (aged 15–64) who have settled in 47 Japanese prefectures, and that of foreign nationals in Japan who moved to other prefectures; all data are the October 2005–October 2010 period. The top 10 countries of origin (in descending order of number of immigrants) are China, (North and South) Korea, Vietnam, the Philippines, Brazil, Indonesia, the United States, Thailand, Peru, and the United Kingdom;6 their proportions by employment type are shown in Figure 2. As mentioned in the Introduction, there are significant differences in employment status by nationality.
[Figure 2]
In terms of international migration analysis, Xo consists of unemployment rates, the
natural log of population, and per-capita GDP in US dollars. (All data were drawn from the International Monetary Fund’s (IMF’s) World Economic Outlook.)7 Similarly,
per-6Information with respect to other popular origin countries of origin, such as India and Nepal, was
not available on a national basis.
capita GDP in Xdwas converted to US dollars using the average yen-to-US dollar exchange
rate published by the IMF. The distance is proxied by the natural log of geographical distance between the capital of each country and the government of each prefecture. The concentration rate equals the number of foreign nationals as a percentage of the total population in each prefecture. Data pertaining to these explanatory variables are from 2005.
In our interprefectural migration study, no single nationality on its own had enough people migrating to Japan’s many prefectures to provide a sufficiently large sample. Therefore, we classify foreign nationals as being in the East Asian Group (Korea and China), the Southeast Asian Group (Vietnam, the Philippines, Indonesia, and Thailand), the South American Group (Brazil and Peru), and the Western Group (the United King-dom and the United States). This immigrant typology is based on intragroup similarities in terms of culture, location, and economic conditions.8 Y
od is the flow of interprefectural
migrants, and it equals 0 if o = d. Xo contains unemployment rates, the natural log of
per-capita GDP (in Japanese yen), and the number of foreigners belonging to each of the aforementioned groups if o 6= d; it equals 0 if o = d. Xd contains the natural log of
per-capita GDP of d, unemployment rates, the natural log of the total population, and the concentration rate of foreigners if o 6= d, and it equals 0 if o = d. The distance variable is the natural log of the interprefectural distance when o 6= d, and it equals 0 when o = d. Data pertaining to these explanatory variables are also from 2005 (Table 1). As one can see, in that year, foreign nationals accounted for a small percentage (0.85%) of Japan’s population.
[Table 1]
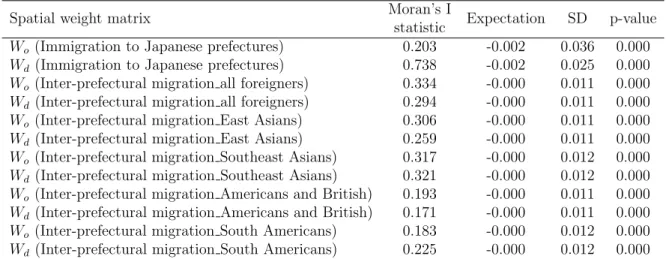
Table 2 shows the results of Moran’s I test from the spatial weight matrices. In all cases, the p-value of the test was less than 0.0001, and the null hypothesis of no spatial correlation was rejected. Therefore, there is evidence of spatial correlation in migration.
relations between Japan and North Korea.
8For example, in the East Asian Group, China and Korea are adjacent nations and their cultural
spheres have historically used the same alphabet (Kanji ); they also share the traditional practice of Mahayana Buddhism. Vietnamese, Filipinos, Indonesians, and Thais (who comprise the Southeast Asian Group) have different religions and languages, but their home countries are in close proximity and their income levels are relatively similar. Brazilians and Peruvians (the South American Group), despite speaking different languages, have similarities in terms of distance to home countries, and most of their citizens are Catholic. Americans and British nationals (the Western Group) have commonalities (e.g., speak English and are Christian) and their countries’ per-capita GDP is higher than that of Japan.
Moreover, with respect to international immigration, Wd has a larger Moran I statistic
and a smaller standard deviation than Wo. Therefore, a country has a strong spatial
autocorrelation based on destination (Figure 1): immigrants tend to move from overseas to prefectures near certain destinations. Morin’s I statistic for interprefectural migration is at most 0.33, and less than the statistic associated with Wd for international immigrants.
Moreover, there are variations in the spatial weights for interprefectural migration by group; the Moran I statistic of East Asians and of Southeast Asians is larger than that of Western countries and of Southeast Americans.
[Table 2]
5
Empirical results
5.1
International immigration
Table 3 shows the results of analyzing migration from overseas to 47 Japanese prefec-tures. Column (A) shows the ordinary least squares (OLS) results, which imply that economic motivations are driving forces of international migration. Low income and large population in o (origin countries) increase immigration to Japan, particularly to highly populated prefectures. Moreover, the concentration rate of foreigners is significantly pos-itive; foreigners find particular prefectures containing many foreign nationals attractive. These results align with those of many previous studies (Backhaus et al., 2015; Belot and Ederveen, 2012; Clark et al., 2007; Pedersen et al., 2008). The unemployment rates in o are significantly negative; as such, unemployment does not serve as an adequate explanation for economic motivation pertaining to immigration. Nonetheless, this result is consistent with that of DeWaard et al. (2012) and suggests that many people cannot afford to migrate internationally from countries with a high unemployment rate: after all, in the context of the current study, the majority of foreigners are originally from China and South Korea, each of which has low-unemployment conditions.
[Table 3]
The results from the spatial model—which fits the data better than the OLS model according to the Akaike information criterion (AIC)—are similar to those from the OLS model (Column B). Interestingly, the spatial lag variable WdYod is significantly positive,
but WoYod is not found to be significant. The latter suggests that migration flows are not
strongly affected by migration flows from various other countries: the decision to leave one’s home country must in itself be a momentous decision for immigrants to Japan. On the other hand, the significantly positive parameter for WdYod implies that immigrants
from the same home country tend to go to prefectures that are geographically close to each other.
Given heterogeneity among the 10 types of foreign nationals studied, Column (C) speaks to their preferences in terms of the concentration of certain groups of immigrants who share many similarities. For this analysis, we create concentration rates for the four groups (i.e., East Asian, Southeast Asian, South American, and Western). Then, we confirm different preferences among the groups in terms of residential location in Japan. The concentration rates of the East Asian and Southeast Asian Groups are found to be significantly positive; the other groups do not show such strong preferences that manifest as concentrations in particular Japanese prefectures. These findings are in line with those of Simpson and Finney (2009), who report that Chinese immigrants prefer to stay in particular regions in the United Kingdom. Interestingly, the groups with positive and significant concentration rate estimates share some common features. For example, the per-capita GDP of their home country is lower than that of Japan, and this phenomenon is consistent with the results of Zorlu and Mulder (2008) and predictions derived from the SAT. The SAT also explains the Southeast Asia Group’s high concentration rate: it differs from Japanese society in terms of culture, language, and religion. Koreans and Chinese (i.e., the East Asian Group), on the other hand, have a stronger affinity with Japanese society in these respects, but the per-capita GDP of their home country is lower than that of Japan, and many Chinese technical interns live in Japan. It seems that these interns attempt to compensate for their relatively low human capital and weak socioeconomic positions by cooperating with their ethnic community.
Immigrants within the South American and Western Groups appear to be spatially dispersed. The concentration rate of the South American Group is insignificant at the 5% level (p = 0.072). Although they do not possess strong socioeconomic status, many Brazil-ians and PeruvBrazil-ians living in Japan are descendants of Japanese immigrants. Therefore, their affinity with Japanese society at the time of entry is higher than that of foreigners
belonging to either the East Asian or Southeast Asian Group, and their need to con-centrate upon entry is relatively small. Both Americans and British (i.e., the Western Group) come from countries with higher per-capita GDP values, and in many cases work in specialized fields. It is thought that the concentration rate of the Western Group is insignificant because its members feel no need to concentrate upon entering the country, given their high socioeconomic status.
Finally, the impact of distance (dist) between origin country and Japanese prefecture on immigration is, on many occasions, uncertain. This finding runs counter to the results of previous studies on international immigration, where the expected sign significantly negative. According to Ramos and Surinach (2017), adjoining borders have the effect of significantly increasing immigrant inflows, and because Japan is an island country with tight immigration control, it is presumed that short distance does not act among immigrants as a pull factor.
5.2
Interprefectural movements
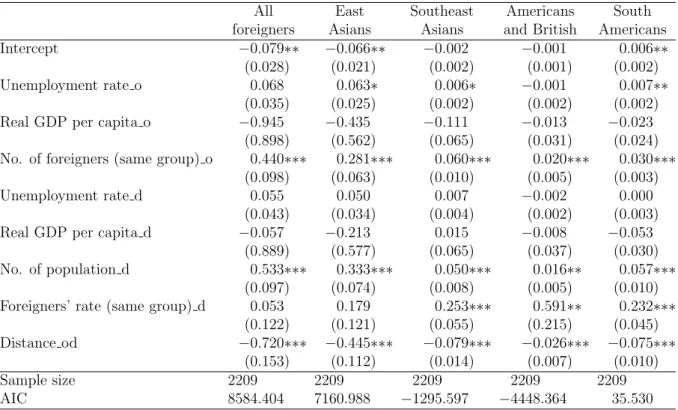
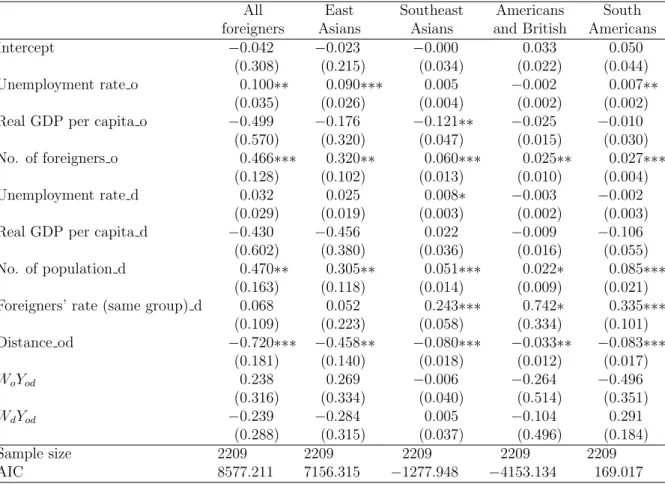
Tables 4 and 5 show the results of analyzing foreigners’ interprefectural migration. Table 4 presents the OLS results, while Table 5 summarizes the S2SLS results with the addition of the spatial lag variable. These tables provide evidence that spatial assimilation has occurred in Japan, but that the speed of assimilation differs significantly by nationality.
In both tables, the concentration rate of foreigners is insignificant in analyzing all foreign nationals (i.e., overall) and the East Asian Group, but it remains significant and positive for the other foreigner groups. The insignificant concentration rate for members of the East Asian Group derives from their proximity to Japanese culture, and the overall result is affected by the results of East Asian Group, since the majority of immigrants in Japan are Chinese or Korean. Like Japanese, Chinese and Koreans (the East Asian Group) have a long history of Mahayana Buddhism and have linguistic, cultural, and religious characteristics relatively similar to Japan’s. Moreover, they belong to a cul-tural area that has since ancient times used Chinese letters (kanji) and had a history of immigrating to Japan before World War II. The insignificant concentration rate of foreigners for interprefectural migration is consistent with the findings of previous stud-ies (Jones, 2003; White and Glick, 1999; Zorlu and Mulder, 2008) and the predictions
deriving from the SAT. Given our finding of a high concentration tendency in their in-ternational movements, a low concentration tendency in interprefectural analysis for the East Asian Group suggests that Chinese and Koreans have improved their socioeconomic status in Japan, and that their social integration is progressing successfully. Their assimi-lation into Japanese culture sharply contrasts with their behavior in the United Kingdom, where Chinese tend to congregate over a protracted period (Simpson and Finney, 2009). We hereby confirm the conventional implication of the SAT, that immigrants find it easier to assimilate themselves into societies that resemble their own.
[Tables 4 and 5]
While the spatial assimilation of foreign nationals in Japan is generally in progress, the concentration rates of the Southeast Asian, South American, and Western Groups are significantly positive. Immigrants in the first two groups earn relatively low incomes in their home countries, are distant linguistically and religiously from Japanese, and have a weak socioeconomic position in Japan. This result is consistent with the behavior of non-Western immigrants in the Netherlands (Zorlu and Muder, 2008). These immigrants— who are both linguistically and religiously distant from the Dutch—choose ethnically concentrated areas, regardless of whether their migration is international or domestic. Moreover, our results indicate that foreigners from the Southeast Asian Group, whose concentration rate was also significant during international migration (Table 3), fail to improve their socioeconomic status and carry out cultural transformation within Japan; consequently, they have experienced significant difficulties in integrating themselves into Japanese society. The South American Group seems to start residing close to each other upon arriving in Japan, since their concentration rate was insignificant for international migration (Table 3) but significant for interprefectural migration. Finally, it appears that members of the Western Group change their preference of residential location upon arriving in Japan: at the time of entry, the spatial location is not an important factor for immigration, but they prefer to stay together when making relocation decisions in Japan. Besides a tendency for immigrants to concentrate, there are some differences between the empirical results of international and interprefectural migration analyses.9 For
ex-ample, while there was a strong tendency for workers to relocate to highly populated
9Based on the AIC, the spatial model is more appropriate for all foreigners and the East Asian Group
prefectures during domestic migration, such a tendency was very weak in the spatial analysis of international migration. Moreover, while economic motivations remain impor-tant with respect to domestic migration, job opportunities (rather than higher income) tend to be the motivation behind relocation. In the case of international immigration, increases in unemployment rates in origin countries reduce workers’ economic gains and emigration, but in the case of interprefectural migration, unemployment rates (o) are of-ten significantly positive. Foreigners living in Japan already have the economic power to move between nations, and domestic travel costs are significantly lower than international travel costs; these facts facilitate foreign nationals’ movement to other prefectures that offer better employment opportunities.
Additionally, the distance functions more consistently with theoretical predictions of interprefectural movement than with those of international immigration. Unlike the case of migrating from outside the country, in the interprefectural analysis, the distance vari-able is correctly signed and both significant and negative. Compared to cases of interna-tional movement where there is no adjacent foreign country, prefectural borders (which are more likely to be adjacent to each other in domestic movement) are associated with a cost of movement (i.e., between neighboring prefectures) that is significantly lower and more affordable. Therefore, we obtain the predicted result that the distance between prefectures negatively correlates with the number of migrants.
6
Conclusion
Based on the spatial assimilation theory (SAT), we analyzed the concentration tendency of immigrants to Japan and that of foreigners relocating within Japan. According to the SAT, when first entering a country, immigrants tend to flow into areas where their own ethnic group concentrates, but subsequently relocate to areas with low ethnic intensity. Therefore, spatial assimilation—the theme of this study—acts as an indicator of social integration, and we show that spatial assimilation among foreigners in Japan is in progress. Analysis of international migration data showed that the effect of the prefecture-level concentration of foreigners on immigration was significantly positive for the East Asian and Southeast Asian Groups, both of which come from regions whose per-capita GDP
is lower than that of Japan. In contrast, interprefectural migration analysis showed that the East Asian Group (Chinese and Korean)—which is characterized by similarities with Japan in terms of language, culture, and religion—had a weaker tendency to concen-trate during domestic migration; this finding aligns with SAT predictions. However, for each of the Southeast Asian, Western, and South American Groups—which are relatively different from Japan in terms of culture, language, and religion—the concentration rate significantly and positively correlated with migration. This finding suggests that the inte-gration of Chinese and Korean immigrants into Japanese society is progressing at a faster rate than that of other immigrant groups.
In Japan—a country that aims to increase its volume of foreign labor—it is urgently necessary to prepare a social integration policy for foreigners. European countries— which have had a comparatively longer history of hosting foreign workers and refugees— have invested considerably in social integration policies so as to prevent isolation among foreigners and stabilize society. Given that many immigrants’ children do not attend school in Japan, investment in education on Japanese culture and history is needed to establish an immigration policy that will have positive impacts on Japanese society.
Bibliography
[1] Alba, R. D., and N. Foner. (2015) Strangers No More: Immigration and the Chal-lenges of Integration in North America and Western Europe. Princeton; Oxford: Princeton University Press.
[2] Alba, R. D., and J. R. Logan. (1991) Variations on Two Themes: Racial and Ethnic Patterns in the Attainment of Suburban Residence, Demography, 28, 431-453. [3] Alba, R. D., and V. Nee. (2003) Remaking the American Mainstream. Cambridge,
MA: Harvard University Press.
[4] Andersson, R. (1998) Socio-Spatial Dynamics: Ethnic Divisions of Mobility and Housing in Post-Palme Sweden, Urban Studies, 35(3), 397-428.
[5] Asselin, O., F. Dureau, L. Fonseca, M. Giroud, A. Hamadi, J. Kohlbacher, F. Lindo, J. Malheiros, Y. Marcadet, and U. Reeger. (2006) Social Integration of Immigrants with Special Reference to the Local and Spatial Dimension, in The Dynamics of International Migration and Settlement in Europe: A State of the Art, (Ed.) R. Penninx, M. Berger, and K. Kraal. Amsterdam: Amsterdam University Press, 134-170.
[6] Backhaus, A., I. Martinez-Zarzoso, and C. Muris. (2015) Do Climate Variations Explain Bilateral Migration? A Gravity Model Analysis, IZA Journal of Migration, 4(3).
[7] Badinger, H., and P. Egger. (2011) Estimation of Higher-Order Spatial Autoregressive Cross-Section Models with Heteroscedastic Disturbances, Papers Regional Science, 90(1), 213-235.
[8] Beenstock, M., and D. Felsenstein. (2016) Double Spatial Dependence in Gravity Models: Migration from the European Neighborhood to the European Union, in Spatial Econometric Interaction Modeling, (Ed.) R. Patuelli, and G. Arbia. Berlin: Springer, 225-251.
[9] Belot, M., and S. Ederveen, (2012) Cultural Barriers in Migration Between OECD Countries, Journal of Population Economics, 25, pp.1077-1105.
[10] Bodvarsson, ¨O., N. B. Simpson, and C. Sparber. (2015) Migration Theory, Handbook of the Economics of International Migration, 1, 3-51.
[11] Bolt, G., and van Kempen, R. (2003) Escaping Poverty Neighbourhoods in the Netherlands, Housing, Theory and Society, 20, 209-222.
[12] Bolt, G., and van Kempen, R. (2010) Ethnic Segregation and Residential Mobility: Relocations of Minority Ethnic Groups in the Netherlands, Journal of Ethnic and Migration Studies, 36(2), 333-354.
[13] Clark, W.A.V. (2007) Race, Class, and Place, Urban Affairs Review, 42, 295314. [14] Clark, X., T. J. Hatton, and J. G. Williamson. (2007) Explaining U.S. Immigration,
1971-1998, The Review of Economics and Statistics, 89(2), 359-373.
[15] Crowder, K. (1999) Residential Segregation of West Indians in the New York/New Jersey Metropolitan Area: The Roles of Race and Ethnicity, International Migration Review, 33, 79-113.
[16] Denton, N., and D. S. Massey. (1989) Racial Identity among Caribbean Hispanics: The Effect of Double Minority Status on Residential Segregation, American Socio-logical Review, 54, 790-808.
[17] DeWaard, J., K. Kim, and J. Raymer. (2012) Migration Systems in Europe: Evidence from Harmonized Flow Data, Demography, 49(4), 1307-1333.
[18] Goodwin-White, J. (2007) Dispersion or Concentration for the 1.5 Generation? Des-tination Choices of the Children of Immigrants in the US, Population, Space and Place, 13(5), 313-331.
[19] Iguchi, Y. (2011) Economics of Intergenerational Interests , Yachio Publisher. In Japanese.
[20] Jones, R.C. (2003) The Segregation of Ancestry Groups in San Antonio, The Social Science Journal, 40, 213-232.
[21] LeSage, J. P., and R. K. Pace. (2008) Spatial Econometric Modeling of Origin-Destination Flows, Journal of Regional Science, 48(5), 941-967.
[22] Marrocu, E., R. Paci. (2013) Different Tourists to Different Destinations. Evidence from Spatial Interaction Models, Tourism Management, 39, 71-83.
[23] Massey, D. S., and N. A. Denton. (1985) Spatial Assimilation as a Socioeconomic Outcome, American Sociological Review, 50(1), 94-106.
[24] McFadden, D. (1974) Conditional Logit Analysis of Qualitative Choice Behavior, in Frontiers in Econometrics, (Ed.) P. Zarembka. Cambridge, Massachusetts: Academic Press, 105-142. Journal of Urban Affairs, 27(3), 331-348.
[25] Park, R. E., and E. W. Burgess. (1921) Introduction to the Science of Sociology. Chicago, IL: University of Chicago Press.
[26] Pedersen, P. J., M. Pytlikovab, and N. Smithc. (2008) Selection and Network Ef-fectsMigration Flows into OECD Countries 1990-2000, European Economic Review, pp.1160-1186.
[27] Ramos, R., and J. Suri˜nach, (2017) A Gravity Model of Migration Between the ENC and the EU, Tijdschrift Voor Economische en Sociale Geografie, 108(1), 21-35. [28] Simpson, L., and N. Finney. (2009) Spatial Patterns of Internal Migration: Evidence
[29] Sjaastad, L. A. (1962) The Costs and Returns of Human Migration, Journal of Political Economy, 70, 80-93.
[30] South, S.J., K. Crowder, and E. Chavez. (2006) Geographic Mobility and Spatial Assimilation among U.S. Latino Immigrants, International Migration Review, 39, 577-607.
[31] Tammaru, T., and T. Kontuly. (2011) Selectivity and Destinations of Ethnic Minori-ties Leaving the Main Gateway CiMinori-ties of Estonia, Population, Space and Place, 17, 674-688.
[32] Wright, R., and M. Ellis. (2000) Race, Region and the Territorial Politics of Immi-gration in the US, International Journal of Population Geography, 6, 197-211. [33] Zorlu, A., and C. H. Mulder. (2008) Initial and Subsequent Location Choices of
Immigrants to the Netherlands, Regional Studies, 42, 245-264.
[34] Zorlu, A., and C. H. Mulder. (2010) Location Choices of Migrant Nest-Leavers: Spa-tial Assimilation or Continued Segregation?, Advances in Life Course Research, 15(2-3), 109-120.
Table 1: Descriptive statistics
Mean SD Min Max
Immigration of foreigners to prefectures (100people) 6.34 16.7 0 180 Unemployment rates of foreign countries 6.86 3.45 1.86 11.4 Real GDP per capita of foreign countries 9.22 0.85 8.04 10.7 No. of population of foreign countries 4.78 1.06 3.33 7.18 Inter-prefectural migration of foreigners (100 people) 0.37 1.88 0 42.2 Unemployment rates of prefectures 5.94 1.34 4.24 11.9 Real GDP per capita of prefectures 10.1 0.16 9.83 10.8 No. of population of prefectures 14.5 0.74 13.32 16.3 Foreigners’ rates of prefectures 0.85 0.50 0.26 1.83 Distance between foreign countries and prefectures 8.52 0.933 6.29 9.84
Distance between prefectures 5.98 0.80 2.35 7.72
Note: Standard deviation (SD). All variables are in natural log except number of migrants that includes 0, and unemployment rates and foreigners’ rates that are ex-pressed in terms of percentage.
Table 2: Moran’s I tests for migration flows
Spatial weight matrix Moran’s I Expectation SD p-value
statistic
Wo (Immigration to Japanese prefectures) 0.203 -0.002 0.036 0.000
Wd (Immigration to Japanese prefectures) 0.738 -0.002 0.025 0.000
Wo (Inter-prefectural migration all foreigners) 0.334 -0.000 0.011 0.000
Wd (Inter-prefectural migration all foreigners) 0.294 -0.000 0.011 0.000
Wo (Inter-prefectural migration East Asians) 0.306 -0.000 0.011 0.000
Wd (Inter-prefectural migration East Asians) 0.259 -0.000 0.011 0.000
Wo (Inter-prefectural migration Southeast Asians) 0.317 -0.000 0.012 0.000
Wd (Inter-prefectural migration Southeast Asians) 0.321 -0.000 0.012 0.000
Wo (Inter-prefectural migration Americans and British) 0.193 -0.000 0.011 0.000
Wd (Inter-prefectural migration Americans and British) 0.171 -0.000 0.011 0.000
Wo (Inter-prefectural migration South Americans) 0.183 -0.000 0.012 0.000
Wd (Inter-prefectural migration South Americans) 0.225 -0.000 0.012 0.000
Note: Expectation and SD express the expectation value and standard deviation of the null distri-bution in Moran’s I test. Woand Wdare origin- and destination-based spatial matrices, respectively.
Table 3: Results of immigration models
Dependent variable: Immigration to prefectures from abroad
(A) (B) (C)
Intercept −169.789 −118.835∗ −113.013∗ (93.595) (51.818) (54.819) Unemployment rate o −0.936∗∗∗ −0.474∗∗ −0.585∗∗∗
(0.187) (0.159) (0.172) Real GDP per capita o −4.370∗∗∗ −2.888∗∗ −2.933∗∗
(0.732) (0.921) (0.886) No. of population o 6.397∗∗∗ 2.781∗∗∗ 3.066∗∗∗
(0.874) (0.723) (0.833) Unemployment rate d −0.004 0.446 0.502
(0.635) (0.535) (0.548) Real GDP per capita d 11.568 8.468 7.454
(9.565) (5.666) (5.805) No. of population d 5.048∗∗∗ 1.925 1.580 (1.040) (1.485) (1.415) Foreigners’ rate d 36.197∗∗∗ 15.999∗∗ (9.441) (5.399) East Asians d 19.261∗ (9.628) Southeast Asians d 42.820∗∗ (16.223)
Americans and British d −12.875
(31.529) South Americans d 10.886 (6.039) Distance od −0.106 2.127 3.110∗ (0.581) (1.294) (1.465) WoYod 0.233 0.275 (0.173) (0.172) WdYod 0.570∗∗∗ 0.563∗∗∗ (0.076) (0.079) Sample size 470 470 470 AIC 3654.615 3448.405 3455.068
Note: ***p<0.001, **p<0.01, *p<0.05. Subscripts ’o’ and ’d’ represent origin and destination regions, respectively.
Table 4: OLS results for inter-prefectural migration models
All East Southeast Americans South
foreigners Asians Asians and British Americans
Intercept −0.079∗∗ −0.066∗∗ −0.002 −0.001 0.006∗∗
(0.028) (0.021) (0.002) (0.001) (0.002)
Unemployment rate o 0.068 0.063∗ 0.006∗ −0.001 0.007∗∗
(0.035) (0.025) (0.002) (0.002) (0.002)
Real GDP per capita o −0.945 −0.435 −0.111 −0.013 −0.023
(0.898) (0.562) (0.065) (0.031) (0.024) No. of foreigners (same group) o 0.440∗∗∗ 0.281∗∗∗ 0.060∗∗∗ 0.020∗∗∗ 0.030∗∗∗
(0.098) (0.063) (0.010) (0.005) (0.003)
Unemployment rate d 0.055 0.050 0.007 −0.002 0.000
(0.043) (0.034) (0.004) (0.002) (0.003)
Real GDP per capita d −0.057 −0.213 0.015 −0.008 −0.053
(0.889) (0.577) (0.065) (0.037) (0.030) No. of population d 0.533∗∗∗ 0.333∗∗∗ 0.050∗∗∗ 0.016∗∗ 0.057∗∗∗
(0.097) (0.074) (0.008) (0.005) (0.010) Foreigners’ rate (same group) d 0.053 0.179 0.253∗∗∗ 0.591∗∗ 0.232∗∗∗
(0.122) (0.121) (0.055) (0.215) (0.045) Distance od −0.720∗∗∗ −0.445∗∗∗ −0.079∗∗∗ −0.026∗∗∗ −0.075∗∗∗
(0.153) (0.112) (0.014) (0.007) (0.010)
Sample size 2209 2209 2209 2209 2209
AIC 8584.404 7160.988 −1295.597 −4448.364 35.530
Table 5: S2SLS results for inter-prefectural migration models
All East Southeast Americans South
foreigners Asians Asians and British Americans
Intercept −0.042 −0.023 −0.000 0.033 0.050
(0.308) (0.215) (0.034) (0.022) (0.044)
Unemployment rate o 0.100∗∗ 0.090∗∗∗ 0.005 −0.002 0.007∗∗
(0.035) (0.026) (0.004) (0.002) (0.002) Real GDP per capita o −0.499 −0.176 −0.121∗∗ −0.025 −0.010
(0.570) (0.320) (0.047) (0.015) (0.030) No. of foreigners o 0.466∗∗∗ 0.320∗∗ 0.060∗∗∗ 0.025∗∗ 0.027∗∗∗
(0.128) (0.102) (0.013) (0.010) (0.004)
Unemployment rate d 0.032 0.025 0.008∗ −0.003 −0.002
(0.029) (0.019) (0.003) (0.002) (0.003)
Real GDP per capita d −0.430 −0.456 0.022 −0.009 −0.106
(0.602) (0.380) (0.036) (0.016) (0.055) No. of population d 0.470∗∗ 0.305∗∗ 0.051∗∗∗ 0.022∗ 0.085∗∗∗
(0.163) (0.118) (0.014) (0.009) (0.021) Foreigners’ rate (same group) d 0.068 0.052 0.243∗∗∗ 0.742∗ 0.335∗∗∗
(0.109) (0.223) (0.058) (0.334) (0.101) Distance od −0.720∗∗∗ −0.458∗∗ −0.080∗∗∗ −0.033∗∗ −0.083∗∗∗ (0.181) (0.140) (0.018) (0.012) (0.017) WoYod 0.238 0.269 −0.006 −0.264 −0.496 (0.316) (0.334) (0.040) (0.514) (0.351) WdYod −0.239 −0.284 0.005 −0.104 0.291 (0.288) (0.315) (0.037) (0.496) (0.184) Sample size 2209 2209 2209 2209 2209 AIC 8577.211 7156.315 −1277.948 −4153.134 169.017
Figure 1
Origin-based dependence (left) and Destination-based dependence (right) of migration
Figure 2
The percentage of foreign residents in Japan by residential type (October, 2018)
Note: The data source is the report on employment status of foreigners produced by Ministry of Health, Labor and Welfare