A Study on Classification of English Sentences by the Degree of Difficulty Using Data Mining
著者 島内 俊彦
著者別表示 Shimauchi Toshihiko journal or
publication title
博士論文本文Full 学位授与番号 13301甲第5021号
学位名 博士(学術)
学位授与年月日 2019‑09‑26
URL http://hdl.handle.net/2297/00056496
Dissertation
A Study on Classification of English Sentences by the Degree of Difficulty Using Data Mining
Graduate School of
Natural Science and Technology Kanazawa University
Division of Electrical Engineering and Computer Science
Student ID : 1724042009
Name: Toshihiko Shimauchi
Chief Advisor: Hidetaka Nambo
Table of Contents
CHAPTER 1 INTRODUCTION ... 1
CHAPTER 2 REVIEW OF EXISTING STUDIES 2.1 INTRODUCTION ... 3
2.2 READABILITY APPROACHES... 3
2.3 MACHINE LEARNING APPROACHES ... 4
2.4 CONCLUSIONS ... 4
CHAPTER 3 PROPOSED METHOD TO BUILD DATASETS AND FEATURE EXTRACTION 3.1 INTRODUCTION ... 6
3.2 PROPOSED SYSTEM ... 7
3.2.1 Outline ... 7
3.2.2 Data Used ... 8
3.2.3 Features ... 8
3.2.4 Process of Building Datasets ... 9
3.3 PROPOSED METHOD:REFINING PROCESS OF DATASET BUILDING ...10
3.4 EXPERIMENTS AND VALIDATION ...10
3.5 EXPERIMENT ...11
3.5.1 Outline ...11
3.5.2 Results ...11
3.6 CONCLUSIONS ...12
CHAPTER 4 DEVELOPMENT OF TWO-TIER CLASSIFICATION MODEL 4.1 INTRODUCTION ...15
4.2 DATA ...15
4.3 EXPERIMENT ...15
4.3.1 Outline ...15
4.3.2 Results ...16
4.4 CONCLUSIONS ...17
CHAPTER 5 APPLYING TWO-TIER CLASSIFIER MODEL TO WIDER GRADE TEXTBOOKS
5.2 DATA ...19
5.3 EXPERIMENT ...19
5.3.1 Outline ...19
5.3.2 Results ...20
5.4 CONCLUSIONS ...21
CHAPTER 6 EXPANDING PROPOSED METHOS TO TEXTBOOKS USED IN JAPAN AND SOUTH KOREA 6.1 INTRODUCTION ...23
6.2 DATA ...23
6.3 EXPERIMENTS USING TEXTBOOKS OF JAPAN ...23
6.3.1 Outline ...23
6.3.2 Results ...24
6.3.3 Discussion ...25
6.4 EXPERIMENTS USING TEXTBOOKS OF SOUTH KOREA ...26
6.4.1 Outline ...26
6.4.2 Results ...26
6.4.3 Discussion ...28
6.5 CONCLUSIONS ...28
CHAPTER 7 DISCRIMINANT ANALYSIS ON UNIVERSITY STUDENTSʼ READING SKILLS 7.1 INTRODUCTION ...30
7.2 EXISTING STUDIES ...31
7.2.1 TOEIC Program ...31
7.2.2 Estimation of TOEIC score ...31
7.3 EXPERIMENT ...32
7.3.1 Participants ...32
7.3.2 Textbook...33
7.3.3 Learning outcomes ...33
7.3.4 Methods and Software ...37
7.4 RESULTS ...37
7.4.1 Correlation ...37
7.4.2 Overview of discriminant analysis ...38
7.4.3 Detailed results for several models ...39
7.5 DISCUSSION ...40
7.5.1 Overview ...40
7.5.2 Model 2 ...41
7.5.3 Models 4 and 6 ...41
7.5.4 Model 7 ...41
7.6 CONCLUSIONS ...41
CHAPTER 8 CONCLUSIONS... 45 ACKNOWLEDGEMENTS
Chapter 1 Introduction
Since 1990s, English instructions in junior high school and high school has started to emphasize enhancing students’ communicative skills. However, there are many reports in news media that Japanese people are not able to communicate in English in practical manner. At the same time, there are worrying sings that students’
reading skills are deteriorating. My personal teaching experiences in technical school and junior college also attest this concerning trend.
Although the number of foreign visitors to Japan has increased since 2013, most of people living in Japan do not have many opportunities to communicate with foreigners. The businesses have started to expand their manufacturing centers abroad, starting from South East Asia in 1960s.However, not many business people are required to travel abroad or transfer to foreign offices.
Exponential growth of internet since 1990s allows many people in Japan to acquire the latest information and knowledge. These information and knowledge are mostly written in English. Hence, even those who do not have opportunities to communicate with inbound visitors from abroad or to work in foreign offices, reading English material is essential skills for them to stay productive and competitive in globalized economy.
English instructions in secondary education system with strong emphasis on communicative skills do not fit with this overall situation. In order to nature reading skills, each student is advised to read many English material, in addition to English textbooks. However, it is difficult for the students to find appropriate reading materials which suit their reading skills. In order to find suitable materials, a system which estimates difficulty level automatically and recommend the material to a user is effective in encouraging out of classroom reading activities.
This study attempts to estimate difficulty level of English sentences by using school textbooks used in three countries. The school textbooks are designed so that the difficulty level increases according to grades.
The system developed in this study could be applied to reading materials such as magazines and journals.
The study is composed in eight chapters, including this introductory chapter. In Chapter 2, existing studies regarding English sentence classification based on difficulty level are reviewed. In Chapter 3, a new
method for building datasets and feature extraction is proposed. In Chapter 4, a two-tier classification method is proposed to improve accuracy in classification. In Chapter 5, the methods proposed in Chapter 3 and Chapter 4 are applied to wider grades. In Chapter 6, school textbooks used in Japan and South Korea are analyzed by using the proposed method. In Chapter 7, discriminant analysis is applied to university students’
reading skills. In Chapter 8, conclusions are summarized with description about future application of the proposed system.
Chapter 2
Review of existing studies
2.1 Introduction
There are several existing studies to estimate difficulty level of given English sentences using school textbook data. These various studies can be classified into two according to their approaches to the estimation. One group of studies uses readability formulas. The other group of studies uses machine learning method for estimating the difficulty level. In this chapter, these two groups are reviewed for their strength and weakness.
2.2 Readability approaches
Readability formulas, which estimate how understandable written texts are, started to attract researchers’
attentions since late 1920s in the United States. Since then, numerous studies have been done for various purposes. Finding a textbook appropriate for certain age group so that these students were able to enjoy reading was one of the most practical reason for the analysis [1].
For English education in Japan, there are several studies have been conducted using school textbooks.
Chujo et al. used four indices to measure the difficulty level of English and Japanese text sample [2]. The samples were composed of 36 articles and books of which 6 were school textbooks. Two indices were related to English texts: 1) the readability of English texts and 2) the percentage of words not covered in school textbooks. Their approach for classifying the texts according to difficulty level was mainly on readability scores. They applied correlational analysis on the four indices. However, their overall approach was not systematic: they listed 36 samples according to the readability score.
Chujo et al. calculate the difficulty of English texts by using readability scores and vocabulary acquisition grades [2]. The samples were composed of 34 school books from four countries: Japan, China, South Korea and Taiwan. Their approach was again not systematic and no accuracy score nor F-value was calculated.
2.3 Machine learning approaches
There are not many studies to estimate difficulty level of school textbooks by using machine learning methods.
Ban and Oyabu analyzed English textbooks being used in Finland and Japan to compare their difficulty level based on words occurrence. From the analysis, several features such as average word length and number of words per sentence were extracted. [4]. Ban et al. used these features extracted from previous study to estimate a difficulty level of English sentences by using machine learning method. The F-value was 0.639 [5]
2.4 Conclusions
The existing studies using readability formulas were simple to understand. However, they were not systematic enough to predict the difficulty level accurately. The studies using machine learning were more organized and produced an accuracy score upon which this study is going to develop.
We will expand the result of their studies in chapter 3 to 6.
References
[1] J.S. Chall, The Beginning Years. In B.L. Zakaluk and S.J. Samuels (eds), Readability: Its past, present, and future. Newark, DE: International Reading Association.
[2] K. Chujo, A. Shirai, M. Utiyama, C. Nishigaki, and S. Hasegawa, “A study on classifying texts in English-Japanese parallel corpora according to linguistic difficulty,” Journal of the College of Industrial Technology of Nihon University, Vol.37(B), 2004, 57-68.
[3] K. Chujo, C. Nishigaki, M. Yamaho, and K. Amano, “Identifying the suitability of textbook English for beginner-level corpus data,” Journal of the College of Industrial Technology of Nihon University, Vol.44(B), 2011, 13-23.
[4] H. Ban and T. Oyabu, “Text mining of English textbooks in Finland,” Proceedings of the Asia Pacific Industrial Engineering & Management Systems Conference, 2012, 1674-1679.
[5] H. Ban, R. Oguri, and H. Kimura, “Difficulty-level classification for English writings,”
Transactions on Machine Learning and Artificial Intelligence, Vol. 3, No 3, 2015, 24-32
Chapter 3
Proposed Method to build datasets and feature extraction
3.1 Introduction
In recent years, English has increasingly gained the importance. Out of world population of approximately 73 billion, 21 billion people live in countries where English is an official or semi-official language [1], making English the most widely spoken language in the world.
In Japan, where English is not used as a semi-official language, there are several developments to promote learning or utilizing the language. In educational realm, since 2014, top-tier universities and high schools are designated respectively as super global universities and super high schools to educate students who will play leading roles in global society [2, 3]. In business realm, since 2010, many listed companies such as Rakuten, Fast Retailing, and Honda Motor have started to introduce English as an official in-house language [4].
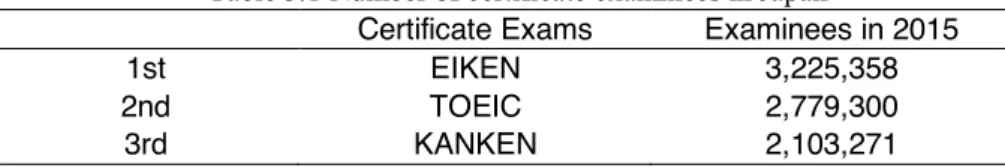
Additionally, many people in Japan take various types of certificate exams for various purposes, one of which is for self-cultivation. Table 3.1 shows the three top ranking exams arranged according to the number of examinees. EIKEN and TOEIC, both certificate exams for English, are most popular. This suggests there are huge demand for English learning.
All these developments suggest that, in Japan, English has been given significant priority over other languages. However, English is not a semi-official language. Those who want to be good at English have to study harder compared to people living in countries where English is widely used. In order to study English better, it is important to look at not only amounts of study hours but also methods of learning and teaching.
There already exist wide range of studies on English learning which suggest the importance of using study materials appropriate to the proficiency of each learner [5 - 7]. However, it is not easy to know beforehand the exact difficulty level of a given material, making it difficult for each learner to select the material appropriate for his or her proficiency.
Table 3.1 Number of certificate examinees in Japan
Certificate Exams Examinees in 2015
1st EIKEN 3,225,358
2nd TOEIC 2,779,300
English textbooks used in school take into account the proficiency of English learners. These school textbooks “are written and edited with proper consideration for the order of learning by meticulously controlling vocabularies and sentence structures for the sake of learners’ aptitude” [5]. Chujo et al. calculate the difficulty of English texts by using readability scores and percentages of words not covered in school textbooks in Japan and UK [6]. Chujo et al. classify difficulty of English textbooks by using corpus data [5].
Ban and Oyabu analyze English textbooks by applying quantitative linguistics method and find features which changes according to grades [8]. Ban et al. use features extracted from this analysis to estimate a difficulty level of English sentences by using machine learning method. The F-value is 0.639 [9]
In this study, by using features extracted from text data of school textbooks as learning data, we propose to develop a system which can classify difficulty levels of English textbooks with improved accuracy compared to the existing studies done by Ban et al. Because of this approach, we do not adopt natural language processing into the model.
3.2 Proposed System 3.2.1 Outline
In this study, classifiers are built by using features extracted from English text and then develop a system to classify difficulty level of given English textbooks. Figure 3.1 shows the process of building classifiers. First, features of English textbooks are extracted to develop training datasets. After building classifiers, the training datasets are used to validate the accuracy of the classifiers. Leave-one-out cross validation method is applied.
Figure3.1 The process of building a classifier
3.2.2 Data Used
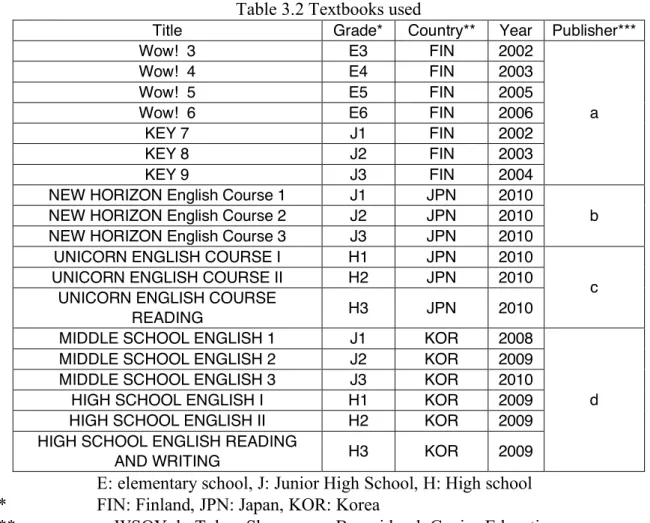
Text data from English school textbooks of Finland, Japan and South Korea are used in this study. Table 3.2 lists all the textbooks analyzed in this study. For the textbook used in 3rd grade of South Korea high schools which include both reading and writing sections, only the reading section is used. Hereafter, data will be described by using country and grade, such as “from E3 to E6 in Finland”
Table 3.2 Textbooks used
Title Grade* Country** Year Publisher***
Wow! 3 E3 FIN 2002
a
Wow! 4 E4 FIN 2003
Wow! 5 E5 FIN 2005
Wow! 6 E6 FIN 2006
KEY 7 J1 FIN 2002
KEY 8 J2 FIN 2003
KEY 9 J3 FIN 2004
NEW HORIZON English Course 1 J1 JPN 2010
b NEW HORIZON English Course 2 J2 JPN 2010
NEW HORIZON English Course 3 J3 JPN 2010 UNICORN ENGLISH COURSE I H1 JPN 2010 UNICORN ENGLISH COURSE II H2 JPN 2010 c
UNICORN ENGLISH COURSE
READING H3 JPN 2010
MIDDLE SCHOOL ENGLISH 1 J1 KOR 2008
d MIDDLE SCHOOL ENGLISH 2 J2 KOR 2009
MIDDLE SCHOOL ENGLISH 3 J3 KOR 2010 HIGH SCHOOL ENGLISH I H1 KOR 2009 HIGH SCHOOL ENGLISH II H2 KOR 2009 HIGH SCHOOL ENGLISH READING
AND WRITING H3 KOR 2009
* E: elementary school, J: Junior High School, H: High school
** FIN: Finland, JPN: Japan, KOR: Korea
*** a: WSOY, b: Tokyo Shuppan, c: Bun-eido, d: Genius Education
3.2.3 Features
Table 3.3 shows features used to generate a dataset. Of 12 features in the table, 10 are used in the study by Ban et al. 2012 [8], and other two are average syllables used to calculate readability score and “average syllables x 84.6” used in Flesch Reading Ease Score, one of the most widely used readability scores.
Table 3.3 Features used in the experiments
Total letters Average word length Total letter types Words / sentence Total words Sentences / paragraph Total word types Words / word types Total sentences Comma / sentence Average syllables Average syllables x 84.6
3.2.4 Process of Building Datasets
Figure 3.2 shows a process of building a dataset when 25 paragraphs are used for one instance. First, text data are preprocessed to fit one paragraph data into one line. 25 lines are used as a unit to extract features.
Extracted features are aggregated to make dataset. Figure 3.3 shows a sample of text data and extracted features. The dataset produced from the process are partially listed in Figure 3.4. Labels of dataset are manually adjusted for each grade.
Figure3.2 Process of build dataset
Figure3.3 Feature extraction
Figure3.4 Dataset (partial)
3.3 Proposed Method: Refining Process of Dataset building
In an existing study, datasets used in the experiments are generated by extracting features from sentences contained in one page [9]. However, using a page as a unit hinders accurate classification due to the difference in the number of sentences between textbooks for training and those for test. This leads to a less versatile model. To solve this issue, we propose a new method: using a paragraph as a unit and extract data from sentences included in the appropriate number of paragraphs. By using paragraphs as a unit, this method can be applied to wide range of documents beyond textbooks used in the study, possibly leading to a development of system which can classify difficulty of wide range of books.
3.4 Experiments and Validation
Training datasets are loaded to Weka to find feature subsets with the highest feature importance by using a feature selection method. As a feature selection method, brute force search is applied. Random Forest is used to build a model [10], [11]. The feature subsets located by the search are used as training data. To validate the accuracy of classifiers, leave-one-out cross validation is used, since the datasets do not contain sufficient number of instances. Accuracy and F-measure are used as validation indices.
3.5 Experiment 3.5.1 Outline
This experiment aims to find optimum amount of text data required to extract features for one instance used in training dataset. Text data used are from four English textbooks from E3 to E6 grade in Finland. Five datasets are generated according to the number of paragraphs: from 5, 10, 15, 20 and 25.
3.5.2 Results
Table 3.4 shows the results of the experiment. Both accuracy and F-measure are improved with the increase of the number of paragraphs used in one instance. However, there is only a slight improvement between 20 paragraphs and 25 paragraphs. Hence, 20 paragraphs are used as a unit for the analysis. Table 3.5 shows the number of incidents for each grade under 20-paragraph analysis.
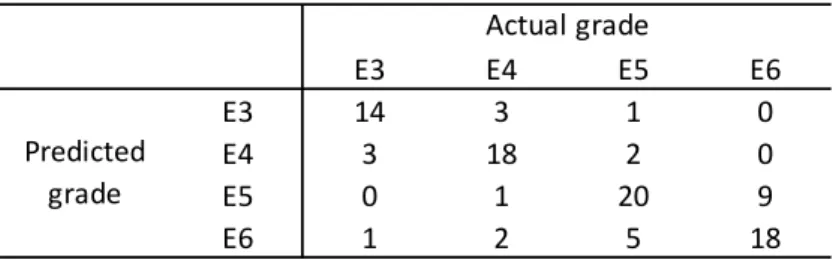
Table 3.6 details the classification result of the experiment. There are few instances to misclassify lower grades (E3 and E4) as higher grades (E5 and E6) and vice versa. However, there are more misclassifications between E3 and E4, and between E5 and E6. Table 3.6 shows the selected features in the model which is built by training dataset based on 20 paragraphs as a unit.
Table 3.4 Result of experiment The number of
paragraphs in one instance
accuracy (%) F-measure
5 52.658 0.525
10 56.853 0.568
15 57.692 0.578
20 64.949 0.650
25 64.935 0.645
Table 3.5 Instances for each grade (Finland elementary school)
Table 3.6 Result of classification
Table 3.6 Selected features Total letter types
Total words Total sentences Sentences / paragraph
Words / word types
3.6 Conclusions
A certain amount of training data is required to build a classifier. Based on the number of available data, accuracy and F-measure, 20-paragraph is adopted as a proper unit for one instance to run further experiments.
Also, compared to the existing study using page as a unit of analysis, this study shows higher F-measure.
This result shows that, by using paragraph as a unit of analysis, the system can be developed which not only has wider applicability to many study materials but also can classify with higher accuracy.
Average syllables per word, a feature used in existing readability scores, is not selected by the feature selection. Instead, the number of words per sentence is selected. This result indicates that in primary school,
Grade Instances
E3 18
E4 24
E5 28
E6 27
E3 E4 E5 E6
E3 14 5 1 0
E4 3 14 2 0
E5 1 4 17 9
E6 0 1 8 18
Actual grade Predicted
grade
there are little changes in the number of syllables per word and that after junior high school, the number would increase which leads to the rise in difficulty levels. Also, the misclassifications between E3 and E4 and between E5 and E6 indicate that, although the selected features are appropriate to classify data with higher accuracy in general, they are different from features that can classify E3 and E4 and E5 and E6 more accurately.
References
[6] Ministry of Education, Culture, Sports, Science and Technology (hereafter MEXT), “Countries using English as official or semi-official language,” 2006,
http://www.mext.go.jp/b_menu/shingi/chukyo/chukyo3/004/siryo/attach/1379959.htm.
(accessed on 2018/5/21)
[7] MEXT, “Support for Super Global Universities,” 2014a http://www.mext.go.jp/a menu/koutou/kaikaku/sekaitenkai/1360288.html. (accessed on 2018/5/21) [8] MEXT, “Super Global High Schools,” 2014b,
http://www.mext.go.jp/a_menu/kokusai/sgh/(accessed on 2018/5/22)
[9] M. Sasaki, “English as in-house language: five years after introduction: Do staff of Fast Retailing speak English fluently?” Diamond Online, http://president.jp/articles/-/21640.
(accessed on 2018/5/22)
[10] K. Chujo, C. Nishigaki, M. Yamaho, and K. Amano, “Identifying the suitability of textbook English for beginner-level corpus data,” Journal of the College of Industrial Technology of Nihon University, Vol.44(B), 2011, 13-23.
[11] K. Chujo, A. Shirai, M. Utiyama, C. Nishigaki, and S. Hasegawa, “A study on classifying texts in English-Japanese parallel corpora according to linguistic difficulty,” Journal of the College of Industrial Technology of Nihon University, Vol.37(B), 2004, 57-68.
[12] L. Wang, “The prospect and challenge of textbook research in English language education,”
Bulletin of the Graduate School of Education, University of Tokyo, Vol.53, 2013, 247-254 [13] H. Ban and T. Oyabu, “Text mining of English textbooks in Finland,” Proceedings of the Asia
Pacific Industrial Engineering & Management Systems Conference, 2012, 1674-1679.
[14] H. Ban, R. Oguri, and H. Kimura, “Difficulty-level classification for English writings,”
Transactions on Machine Learning and Artificial Intelligence, Vol. 3, No 3, 2015, 24-32 [15] L. Breiman, “Bagging predictors,” Machine Learning, Vol. 24, No.2, 1996, 123-140.
[16] L. Breiman, “Random Forests,” Machine Learning, Vol. 45, No. 1, 2001, 5-32.
[17] Y. Takanashi, and Y. Ushiro, Handbook of English Reading, Kenkyu-sha, 2000.
Chapter 4
Development of two-tier classification model
4.1 Introduction
The results of the experiments 1 in Chapter 3 have showed several pairs of grades which are mutually misclassified and those which are not misclassified at all. These results indicate that multi-tier classifications by using several models can perform better classification than one-tier, single model classification into four grades. Based on this finding, a second method is proposed in this chapter. Two-tier classification system is constructed with a first stage classifier to perform general classification and second stage classifiers to perform finer classification.
One-tier classification used in the existing study and two-tier classification proposed in this chapter are applied to the following experiments to compare the accuracy of each method.
4.2. Data
Dataset used in Chapter 3 are used in this Chapter.
4.3. Experiment 4.3.1 Outline
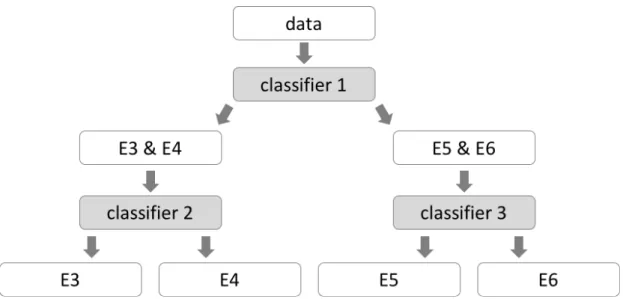
The results of experiment in Chapter 3 lead to the hypothesis that feature subsets which can classify accurately between E3 and E4 and between E5 and E6 are different from those that can better classify entire grades. In order to verify the hypothesis, second experiment is conducted. At the first stage, classifier 1 is placed to make binary classification between lower-grade group (E3 or E4) and higher-grade group (E5 or E6). At the second stage, two classifiers, classifier 2 and 3, respectively classify lower-grade group into E3 and E4 and higher-grade group into E5 and E6 to obtain 4 classes. Figure 4.1 shows the process of the two- tier classification.
Figure 4.1 Process of two-tier classification for Finland
4.3.2 Results
Table 4.1 shows the results of one-tier classification. Table 4.2 shows the results of first stage classification of two-tier experiment. Table 4.3 shows the final results of the two-tier classification. Table 4.4 shows the comparison of the accuracy and the F-measures of one-tier and two-tier classifications. Two-tier classification shows better result: 7.216 points higher accuracy and 0.072 higher F-measure. This result proves the effectiveness of two-tier classification. Feature subsets selected by the algorithm are listed in bold in Figure 4.2.
Table 4.1 Result of one-tier classification
Table 4.2 Result of first stage classification
E3 E4 E5 E6
E3 14 5 1 0
E4 3 14 2 0
E5 1 4 17 9
E6 0 1 8 18
Predicted grade
Actual grade
E3 & E4 E5 & E6
E3 & E4 38 3
E5 & E6 4 52
Actual grades Predicted
grades
Table 4.2 Result of second stage classification
Table 4.3 Result comparison: one-tier vs two-tier
Figure 4.2 Comparison of feature subsets
4.4 Conclusions
Using three classifiers to run two-tire classification to obtain 4 classes results in higher accuracy compared to using one-classifier-single-stage classification, suggesting the effectiveness of the two-tier classification method.
E3 E4 E5 E6
E3 14 3 1 0
E4 3 18 2 0
E5 0 1 20 9
E6 1 2 5 18
Predicted grade
Actual grade
classifier accuracy (%) F-measure
One-tier 64.949 0.650
1st / Two-tier 92.784 0.928 2nd / Two-tier 72.165 0.722
classifier 1 classifier 2 classifier 3
Total letters Total letters Total letters Total letters Total letter types Total letter types Total letter types Total letter types
Total words Total words Total words Total words
Total word types Total word types Total word types Total word types Total sentences Total sentences Total sentences Total sentences Average word length Average word length Average word length Average word length
words/ sentence words/ sentence words/ sentence words/ sentence sentences / paragraph sentences / paragraph sentences / paragraph sentences / paragraph words / word types words / word types words / word types words / word types cooma / sentence cooma / sentence cooma / sentence cooma / sentence
average syllables average syllables average syllables average syllables average syllables * 84.6 average syllables * 84.6 average syllables * 84.6 average syllables * 84.6
One-tier Two-Tier
Figure 4.2 shows two types of features: those which function at each classification, such as the total number of sentences in 20 paragraphs, and those which function at specific classification, such as average syllables per one word.
Classifiers 2 and 3 use distinct feature subset, while the subsets of the classifier of one-tier classification and the classifier 1 of two-tier classification are composed of similar features. This result supports the finding in the experiment in Chapter 3 which suggests that feature subsets to classify lower-grade group into E3 and E4 and higher-grade group into E5 and E6 are different from the subsets for classifying data into lower and higher grades.
Chapter 5
Applying two-tier classifier model to wider grade textbooks
5.1 Introduction
The results of Chapter 4 have showed the effectiveness of two-tier classification system proposed in this study. In this Chapter, the proposed system is applied to wider grade textbooks used in Finland. Specifically, in preceding chapters, textbooks used in elementary years were used. In this Chapter, textbooks used in junior high schools are added to the experiment to investigate the robustness of the proposed system.
5.2. Data
Dataset used in Chapter 3 are used in this Chapter.
5.3. Experiment 5.3.1 Outline
This experiment uses dataset for 7 years: from elementary E3 to Junior-High J3 in Finland to run one-tier and two-tier classifications. Dataset are generated by using text based on 20 paragraphs. Table 5.1 shows the number of the instances for each grade. Figure 5.1 shows the process of two-tier classification. At the first stage, the data are classified into three classes: E3 and E4, E5 and E6 and J1 to J3. At the second stage, these three classes are further classified into each grade. Compared to the experiment in Chapter 4, an additional classifier is placed on second stage in order to cope with expansion of textbooks used.
Table 5.1 Instances for each grade (Finland expanded) Grade Instances
E3 18
E4 24
E5 28
E6 27
J1 21
J2 27
J3 32
Figure 5.1 Two-tier classification for Finland (expanded)
5.3.2 Results
The results of one-tier and two-tier classifications are respectably shown in Tables 5.2 and 5.3. Table 5.4 shows the final result of the two-tier classification. Table 5.5 shows the comparison of the accuracy and the F-measures of one-tier and two-tier classifications. Feature subsets selected by the algorithm are listed in bold in Figure 5.2.
Table 5.2 Result of the one-tier classification
Table 5.3 Result of the 1st stage classification
E3 E4 E5 E6 J1 J2 J3
E3 11 9 2 0 0 0 0
E4 4 12 3 0 0 0 0
E5 2 2 16 8 2 0 2
E6 1 1 5 12 3 4 1
J1 0 0 1 2 9 3 2
J2 0 0 0 4 4 14 7
J3 0 0 1 1 3 6 20
Predicted grade
Actual grade
E3 & E4 E5 & E6 J1 - J3
E3 & E4 38 5 0
E5 & E6 4 44 6
J1 - J3 0 6 74
Actual grades Predicted
grades
Table 5.4 Result of the 2nd stage classification
Table 5.5 Comparison of the result of experiment
Figure 5.2 Comparison of feature subsets
5.4 Conclusions
Compared to one-tier classification, two-tier classification yields better result: The accuracy is higher than 60% and F-measure is larger than 0.6. These results show the effectiveness of two-tier classification. Also, the first stage of two-tier classification results in F-measure of 0.881. This high accuracy suggests that this classifier can accurately classify the difficulty of English sentences.
E3 E4 E5 E6 J1 J2 J3
E3 14 3 2 0 0 0 0
E4 3 18 3 0 0 0 0
E5 0 1 18 9 3 1 0
E6 1 2 3 14 1 0 1
J1 0 0 1 0 8 7 5
J2 0 0 1 3 4 15 5
J3 0 0 0 1 6 4 21
Actual grade
Predicted grade
classifier accuracy (%) F-measure
One-tier 53.107 0.531
1st / Two-tier 88.136 0.881 2nd / Two-tier 61.017 0.609
classifier 1 classifier 2 classifier 3 classifier 4
Total letters Total letters Total letters Total letters Total letters Total letter types Total letter types Total letter types Total letter types Total letter types
Total words Total words Total words Total words Total words
Total word types Total word types Total word types Total word types Total word types Total sentences Total sentences Total sentences Total sentences Total sentences Average word length Average word length Average word length Average word length Average word length
words/ sentence words/ sentence words/ sentence words/ sentence words/ sentence sentences / paragraph sentences / paragraph sentences / paragraph sentences / paragraph sentences / paragraph
words / word types words / word types words / word types words / word types words / word types cooma / sentence cooma / sentence cooma / sentence cooma / sentence cooma / sentence average syllables average syllables average syllables average syllables average syllables average syllables * 84.6 average syllables * 84.6 average syllables * 84.6 average syllables * 84.6 average syllables * 84.6
One-tier Two-Tier
Figure 5.2 lists feature subsets for classifiers used in one-tier and two-tier classifications. Every classifier uses total number of sentences. This result suggests that the number of sentences used in 20 paragraphs changes according to the difficulty level of the textbooks. Also, the feature subsets used in each classifier are different. This result shows the necessity to use multiple classifiers.
Chapter 6
Expanding Proposed Methods to textbooks used in Japan and South Korea
6.1 Introduction
The experiment in Chapter 5 have showed robust results by applying two-tier classifier model to wider school grade textbooks. In this chapter, the model is applied to English textbooks used in Japan and South Korea to investigate the robustness of the model for classifying textbooks used in cultural context different from Finland, on which the model is developed.
6.2 Data
Dataset used in Chapter 3 are used in this Chapter.
6.3 Experiments using textbooks of Japan 6.3.1 Outline
One-tier and two-tier classifications are conducted by using textbook data of Japan. Dataset are produced by using text based on 20 paragraphs. Table 6.1 shows the number of instances for each grade. Figure 6.1 shows the process of two-tier classification. At the first stage, the data are classified into junior high and high school, and at the second stage, each class is further classified into 3 classes.
Table 6.1 Instances for each grade (Japan) Grade Instances
J1 11
J2 11
J3 8
H1 8
H2 13
H3 12
Figure 6.1 Two-tier classification for Japan
6.3.2 Results
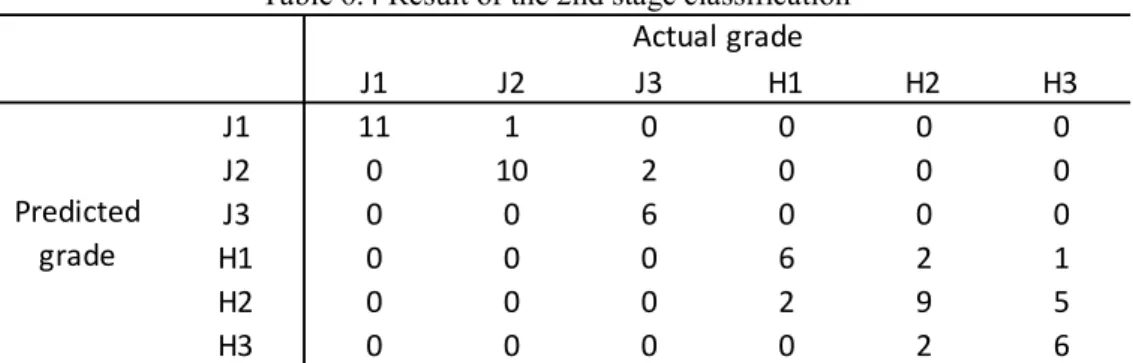
Table 6.2 shows the result of one-tier classification. Table 6.3 shows the result of first stage classification of two-tier experiment. Table 6.4 shows the final result of the two-tier classification. The first stage of two-tier classification classifies all the data accurately. Table 6.5 shows the comparison of the accuracy and the F- measures of one-tier and two-tier classifications. Two-tier classification shows higher result: 3.174 points higher accuracy and 0.028 higher F-measure. Feature subsets used by each classifier are listed in bold in Figure 6.2.
Table 6.2 Result of the one-tier classification
Table 6.3 Result of the 1st stage classification
J1 J2 J3 H1 H2 H3
J1 11 1 0 0 0 0
J2 0 10 2 0 0 0
J3 0 0 6 0 1 0
H1 0 0 0 6 3 1
H2 0 0 0 1 5 3
H3 0 0 0 1 4 8
Actual grade
Predicted grade
J1 - J3 H1 - H3
J1 - J3 30 0
H1 - H3 0 33
Actual grades Predicted
grades
Table 6.4 Result of the 2nd stage classification
Table 6.5 Comparison of the result of experiment2
Figure 6.2 Comparison of feature subsets
6.3.3 Discussion
Out of 4 classifiers, only the classifier 1 uses “comma per sentence” feature. This result suggests within junior high school years or high school years, this feature value remains without significant changes but between junior high school and high school, the number of comma per sentence greatly varies.
J1 J2 J3 H1 H2 H3
J1 11 1 0 0 0 0
J2 0 10 2 0 0 0
J3 0 0 6 0 0 0
H1 0 0 0 6 2 1
H2 0 0 0 2 9 5
H3 0 0 0 0 2 6
Predicted grade
Actual grade
6.5
classifier accuracy (%) F-measure
One-tier 73.016 0.721
1st / Two-tier 100.000 1.000 2nd / Two-tier 76.190 0.76
classifier 1 classifier 2 classifier 3
Total letters Total letters Total letters Total letters Total letter types Total letter types Total letter types Total letter types
Total words Total words Total words Total words
Total word types Total word types Total word types Total word types Total sentences Total sentences Total sentences Total sentences Average word length Average word length Average word length Average word length
words/ sentence words/ sentence words/ sentence words/ sentence sentences / paragraph sentences / paragraph sentences / paragraph sentences / paragraph
words / word types words / word types words / word types words / word types cooma / sentence cooma / sentence cooma / sentence cooma / sentence
average syllables average syllables average syllables average syllables average syllables * 84.6 average syllables * 84.6 average syllables * 84.6 average syllables * 84.6
One-tier Two-Tier
6.4 Experiment using textbooks of South Korea 6.4.1 Outline
One-tier and two-tier classifications are conducted by using textbook data of South Korea. Datasets are produced by using text based on 20 paragraphs. Table 6.6 shows the number of instances for each grade.
Two-tier classification is run in the process illustrated in Figure 6.3.
Table 6.6 Instances for each grade (South Korea)
Figure 6.3 Two-tier classification for Japan
6.4.2 Results
Table 6.7 shows the result of one-tier classification. Table 6.8 shows the result of first stage classification of
Grade Instances
J1 22
J2 20
J3 21
H1 17
H2 17
H3 13
comparison of the accuracy and the F-measures of one-tier and two-tier classifications. Two-tier classification shows higher result: 4.545 points higher accuracy and 0.056 higher F-measure. Adding to this overall high accuracy, the first stage of two-tier classification yields accuracy of 93.636% and F-measure of 0.936. Feature subsets used by each classifier are listed in bold in Figure 6.4.
Table 6.7 Result of the one-tier classification
Table 6.8 Result of the 1st stage classification
Table 6.9 Result of the 2nd stage classification
Table 6.10 Comparison of the result of experiment
J1 J2 J3 H1 H2 H3
J1 18 4 3 0 0 0
J2 2 13 2 0 3 0
J3 1 2 14 2 2 3
H1 0 0 1 10 3 6
H2 1 1 0 4 8 2
H3 0 0 1 1 1 2
Predicted grade
Actual grade
J1 - J3 H1 - H3
J1 - J3 60 4
H1 - H3 3 43
Actual grades Predicted
grades
J1 J2 J3 H1 H2 H3
J1 19 2 2 0 1 0
J2 2 14 7 0 2 0
J3 1 3 10 1 0 0
H1 0 0 2 8 1 4
H2 0 1 0 4 12 2
H3 0 0 0 4 1 7
Actual grade
Predicted grade
classifier accuracy (%) F-measure
One-tier 59.091 0.575
1st / Two-tier 93.636 0.936
2nd / Two-tier 63.636 0.631
Figure 6.4 Comparison of feature subsets
6.4.3 Discussion
Similar to the previous experiment using textbooks from Japan, only the classifier 1 which classifies junior high and high school uses “comma per sentence” feature. This result suggests the number of comma used in sentence does not increase gradually but increase in phases.
6.5 Conclusions
In this study, a system which can classify English sentences according to difficulty level is developed by using meta-features of dataset in order to provide English learners with appropriate level of reading text and by applying following proposed methods:
• We propose a new method to set paragraph as a unit of analysis for one instance when building dataset. In order to find appropriate number of paragraphs for better classification, an experiment is run by making 5 datasets with a range of paragraphs from 5, 10, 15, 20 and 25. The result shows 20 paragraphs bears the highest accuracy. The proposed method also leads to more accurate classification compared to the existing study which employs page as a unit of analysis, showing the
classifier 1 classifier 2 classifier 3
Total letters Total letters Total letters Total letters Total letter types Total letter types Total letter types Total letter types
Total words Total words Total words Total words
Total word types Total word types Total word types Total word types Total sentences Total sentences Total sentences Total sentences Average word length Average word length Average word length Average word length
words/ sentence words/ sentence words/ sentence words/ sentence sentences / paragraph sentences / paragraph sentences / paragraph sentences / paragraph
words / word types words / word types words / word types words / word types cooma / sentence cooma / sentence cooma / sentence cooma / sentence
average syllables average syllables average syllables average syllables average syllables * 84.6 average syllables * 84.6 average syllables * 84.6 average syllables * 84.6
One-tier Two-Tier
• Several experiments are conducted for various datasets by employing both one-tier and two-tier classifications. The results of the experiments show two-tier classification is more accurate than one-tier method. Also, first stage of two-tier classification shows considerably higher accuracy.
For a future research, following three points are worth exploring:
• Using 20 paragraphs as one incident produce higher accuracy in textbooks used in Finland. In order to develop a simpler and more versatile classification system, textbooks used in Japan and South Korea are converted into a dataset by using same paragraph numbers. However, due to linguistic and cultural differences, different paragraph numbers may produce higher classification accuracy in textbooks used in South Korea and Japan.
• Two features used for the study are both related to syllables. They are used widely in readability scores. However, these features have linear relations which can influence the result of the analysis.
Although the charts comparing features selected in the study have shown the proposed system distinguish between two features, eliminating these linear relations can have certain changes in accuracy and feature selection.
• Several feature subsets are produced which allow more accurate classification. By analyzing these subsets, new findings can be obtained regarding how the sentences or structures would change in the process of the rise of difficulty level.
Chapter 7
Discriminant Analysis on University Students’ Reading Skills
7.1 Introduction
The Courses of Study determined by the Ministry of Education, Culture, Sports, Science and Technology (MEXT) of Japan are broad standards for all schools, from kindergarten through high schools, to organize their programs in order to ensure a fixed standard of education throughout the country [1]. Since the end of World War II, the Course of Study have been revised 7 times, approximately at 10-year intervals. With the revisions, English education in Japan has gone through several reforms. The latest Courses of Study aim to nature communication skills in a foreign language [2 - 4].
The Course of Study does not apply to universities. However, a reform for university entrance examination has been implemented. In 2020, the current National Center Test will be replaced with the Common Test for University Admissions. In the new test system, applicants’ English proficiency will be assessed in four skills (reading, listening, speaking and writing). In order to assess speaking and writing skills, a certificate exam will be used.
One of the certificate exams to be used is TOEIC. The test has been drawing attentions from business world, owing to the widening and acceleration of the economic globalization. A study conducted in 2013 to listed companies in Japan showed that 69% of respondents used TOEIC score in evaluating job applicants’
qualification. The test was also used widely in deciding who to be promoted or transferred to overseas offices [5]. As a result, 2.5 million people took the test in 2017, of which 1.1 million were students [6].
In many private universities, the tests are used widely for entrance exam or credit certification. A survey conducted in December 2016 by the Institute for International Business Communication (IIBC), an administrator of the TOEIC in Japan, showed out of 751 universities surveyed, 427 used the test for entrance exam and 378 used the test for credit certification [7].
Although the test has been attracting as an objective certificate to assess examinee’s proficiency, the cost is rather high. Depending on the test type, minimum of 5,000 JPY per test is necessary, making it harder to take one frequently. In an English course offered in a school, a workbook can be used for trial exam.
However, duplicating the workbook is prohibited by the copyright law. If students have to buy the workbook, preprocessing is necessary to hide answer keys included in the workbook.
When a student can estimate the TOEIC score from own learning outcomes related to course activities, it is possible for him or her to decide when to take an official test based on the estimated scores. The estimation will also allow a teacher to give necessary instruction and advice to each student according to his or her proficiency.
This study is a first step for the estimation of the score from the learning outcomes. The discriminant analysis has been applied to classify students into upper and lower groups based on TOEIC Bridge reading scores by using learning outcomes in an English course conducted in a public school in Ishikawa.
7.2. Existing studies 7.2.1 TOEIC Program
TOEIC is the abbreviation for Test Of English as International Communication and is developed by ETS, a non-profit educational foundation in the U.S. At the beginning, there was only one test type called TOEIC Listening and Reading (L&R). Later, a simplified test called TOEIC Bridge and a test to evaluate output performance called TOEIC Speaking and Writing (S&W) were developed. Table 7.1 shows score comparisons between TOEIC Bridge and TOEIC L&R.
Table 7.1 Score comparison: TOEIC Bridge and TOEIC L&R
Bridge 90 100 110 120 130 140 150 160 L&R 230 260 280 310 345 395 470 570
Source: IIBC
7.2.2 Estimation of TOEIC score
Taguchi [8] reports a correlation between TOEIC scores and self-study hours not related to the course based on data from students in Aichi University of Education. The study hours were self-reported in 6-point scale, so the reliability of the data is not sufficient.
There are many existing studies to estimate TOEIC scores from other certificate scores. Maruyama et al [9] have conducted an experiment to estimate TOEIC scores from G-TELP scores using a generalized linear model. Dohi and Cheung [10] estimate TOEC scores from TOEFL scores based on data of students in Chiba University by using a simple linear regression model. Eguchi [11] calculates a correlation between TOEIC scores and TOEFL scores based on data of students in Hokusei University. These existing studies reports interesting findings. However, each estimation requires scores from another certificate test, which requires additional cost.
This study aims to overcome the cost problem by using learning outcomes from course activities which do not require additional cost.
7.3. Experiment 7.3.1 Participants
First year students in the Faculty of Intercultural Communication of Komatsu University participated in this project. In fall semester of 2018, they were required to take “English III” course. Due to the physical size of the classroom, the course was divided into three classes held on Tuesdays, Wednesdays and Fridays. The students freely decided which class to register (Table 7.2).
Table 7.2 Course name, days and students registered
Class Date Male Female Total
English IIIa Tue.13:00- 3 20 23 English IIIb Wed.13:00- 12 12 24 English IIIc Fri.13:00- 2 33 35
Total 17 65 82
76 students took TOEIC Bridge conducted in February of 2019. Three of them did not submit assignments for the course. Data from 73 students with both TOEIC Bridge and course assignments were used for discriminant analysis.
7.3.2 Textbook
“Skills for Better Reading, revised edition” published by Nanun-do was used for the course. According to the publisher, intended students for the text are expected to have TOEIC scores from 400 to 600. From Table 1, these scores can be interpreted as between 140 to 160 in TOEIC Bridge.
TOEIC Bridge is a simplified version of TOEIC. It consists of listening part (50 questions for 25 minutes) and reading part (50 questions for 35 minutes). The scores are 90 each (180 in total). Table 7.3 shows the test result conducted in February 2019. Compared to national average scores of first year university students (Total 124.0, Listening 61.1, Reading 62.9), the participating students have higher proficiency in reading and listening on average [6]. Since one of the course objectives was to improve reading skills, the reading scores were analyzed in this study.
Table 7.3 Descriptive statistics of TOEIC Bridge scores
Total Listening Reading
Mean 149.29 72.30 76.99
SD 13.22 6.38 8.39
min 108 52 52
max 174 90 90
Median 152 72 80
skewness -1.01 -0.45 -1.37
7.3.3 Learning outcomes Assignments
The course was conducted over 16 weeks. For 13 weeks, reading assignments were given to the students.
The assignments were adopted from written tests of EIKEN Grade P1 conducted and published by Eiken Foundation of Japan. A written test is composed of multiple-choice section (41 questions) and composition section (1 question). Out of 41 questions, 10 questions in reading sub-section were printed and distributed to
the students as an assignment at the end of class each week. The sub-section is divided into three question sets, as shown in Table 7.4.
Table 7.4 Average words size for each question set.
QS1 QS2 QS3 Total
Number of questions 3 3 4 10
Words in texts 312 412 494 1,218
Words in questions 241 239 343 823
Words in total 553 651 837 2,041
Note: QS: question set
According to Eiken Foundation’s evaluation criteria, the intended examinees of the Grade P1 are second to third year university students. Successful examinees are expected to fully understand and use English required in actual social life situations. The level of the test is difficult for the participating students. For the copyrights of the past test, section1, article 35 of the copy rights law is applied for this project so that the tests can be reproduced without a permission from the copyright holder.
Mid-term and final exams
The mid-term exam was conducted in November 2018. The final exam was held in February 2019. The questions were made based on the textbook used in the course. The mid-term exam covered 6 units in the textbook and was conducted separately for each class. 50% of the questions were same among three classes and the remaining 50% were different among each class. The final exam covered 4 units of the textbook and was conducted all together. For the experiments, a weighted average score of mid-term and final exams was calculated for each student. Table 7.5 shows the statistical information and readability scores for each exam.
Table 7.5 Statistical information and readability scores for each exam
Exam Class Sent Words Syll Lett FKGL ARI
Mid
A 65 860 1450 4432 9.5 9.5
B 65 917 1529 4687 9.6 9.7
C 70 961 1600 4862 9.4 9.3
Final all 62 963 1558 4523 9.6 8.5
Note Sent: sentences, Syll: syllables, Lett: letters
There are many readability scores [12,13]. Flesch-Kincaid Grade Level (FKGL) is most widely used for assessing the appropriateness of a given textbook [14]. FKGL was developed by Flesch and Kincaid in 1975 and the number indicates an appropriate grade level in the U.S. school system for a document being analyzed.
Ishioka et al [15] report English entrance tests in the National Center Test are at 4 to 8 in FKGL. Table 4 shows the exams for the course were more difficult than the entrance examination commonly used in Japan.
The formula of FKGL is as follows.
FKGL = 0.39 * WPS + 11.8 * SyPW - 15.59 where
WPS = Words Per Sentence SyPW = Syllables Per Word
As the formula shows, information on syllables are required for each word to calculate FKGL. When there is a word in a text to be analyzed which does not have syllable information, FKGL cannot be calculated.
Automated Readability Index (ARI) was developed by U.S. Airforce and uses the number of letters to calculate the readability [16]. ARI was developed by U.S. Airforce. Its result shows the appropriate grade level, same as FKGL. The formula is as follows:
ARI = 4.71 * LPW + 0.5 * WPS - 21.43 where
LPW = Letters Per Word
WPS = Words Per Sentence
As shown in Table 7.5, except for the final exam’s ARI, the readability scores did not show significant fluctuations. The result allowed to suppose all the students took same level of examinations.
Abbreviations in Table 7.6 are used in tables and figures for the remainder of the paper. Table 7.7 shows the learning outcome data.
Table 7.6 Legend
Abbreviation Meaning
WAS weighted average scores of mid and final exams
AAS Assignment average scores
AHRS Assignment study hours
ATMS the number of submissions of assignment
Table 7.7 Descriptive statistics of learning outcome
WAS
Assignment
AAS AHRS ATMS
Mean 71.17 5.15 1:11:15 10.77
SD 13.52 1.71 0:27:54 2.94
min 19.42 1.67 0:30:00 2
max 97.40 8.58 2:40:00 13
Median 73.15 5.18 1:05:50 12
Skewness -0.97 -0.08 1.00 -1.75
7.3.4 Methods and Software
Google Apps were used for collecting and scoring the assignments. The students were required to register study hours in addition to the answers to the assignment. Bell Curve for Excel (version 2.15) from Social Survey Research Information was used for discriminant analysis. Mint Reading Grade Level Formulas from Mint Phonetics Education Institute was used to calculate readability scores for the mid-term and final exams.
We used discriminant analysis instead of regression analysis because the distribution of TOEIC Bridge reading score was not normal.
7.4. Results 7.4.1 Correlation
Data from 73 students were used to conduct discriminant analysis. The students were divided into upper and lower groups based on TOEIC Bridge reading scores. The threshold between the group was set at 80% correct scores. Explanatory variables were four learning outcomes listed in Table 7.6. The number of combinations of these 4 variables are 15. In order to simplify the analysis, the partial correlation coefficients were calculated to find a variable having a weak correlation with the reading score.
Table 7.8 and Fig.1.1 show that the number of submissions has a weak correlation with the reading score. This explanatory variable was excluded and the remaining three learning outcomes were used for discriminant analysis.
Table 7.8 Partial correlation matrix (n=73)
1 2 3 4 5
1 Reading Score - .317 .332 -.276 -.056
2 WAS ** - .462 .001 -.027
3 AAS ** ** - -.073 .362
4 AHRS ** - .098
5 ATMS -
Note: **,P<0.01, *,P<0.05
Fig.7.1 Undirected graph (P<0.05)
7.4.2 Overview of discriminant analysis
The analysis overview is shown in Table 7.9.
Table 7.9 Experiment results: percentage of correct classifications
model Variable(s) % of correct classifications
Upper Lower Total
1 a 85.00% 76.92% 83.56%
2 b 76.67% 84.62% 78.08%
3 c 81.67% 61.54% 78.08%
4 a´b 88.33% 92.31% 89.04%
5 a´c 88.33% 69.23% 84.93%
6 b´c 80.00% 84.62% 80.82%
7 a´b´c 88.33% 76.92% 86.30%
Note: a: WAS, b: AAS, c: AHRS
The value for upper group corresponds with recall, the lower group value corresponds with specificity, and the total value corresponds with accuracy. Discriminant analysis does not yield precision. The data from the experiment were applied to the formula for precision to yield F-value as shown in Table 7.10.
Reading score
WAS
AAS AHRS
ATMS
variables -0.5000 ~-0.2500 0.2500 ~0.5000
Table 7.10 Experiment results: precision and F-value
Model Variable(s) Precision F-value Upper Lower Upper Lower
1 a 0.9444 0.5263 0.8947 0.6501
2 b 0.9583 0.4400 0.8519 0.5591
3 c 0.9074 0.4211 0.8596 0.5556
4 a×b 0.9814 0.6316 0.9298 0.7365
5 a×c 0.9298 0.5625 0.9060 0.6873
6 b×c 0.9600 0.4783 0.8727 0.5986
7 a×b×c 0.9464 0.5882 0.9138 0.7062 Note: a: WAS, b: AAS, c: AHRS
7.4.3 Detailed results for several models
Tables 7.11 and 7.12 respectively show the detailed results for models 4 and 6 which produced higher than 80% correct classification for both upper and lower groups.
Table 7.11 Experiment result of model 4 Prediction
% of correct classification Upper Lower
Observation Upper 53 7 88.33%
Lower 1 12 92.31%
Total 89.04%
Table 7.12 Experiment result of model 6 Prediction
% of correct classification Upper Lower
Observation Upper 48 12 80.00%
Lower 2 11 84.62%
Total 80.82%
Tables 7.13 and 7.14 respectively show the results for models 2 and 7, both with average assignment scores as an explanatory variable.
Table 7.13 Experiment result of model 2 Prediction
% of correct classification Upper Lower
Observation Upper 46 14 76.67%
Lower 2 11 84.62%
Total 78.08%
Table 7.14 Experiment result of model 7 Prediction
% of correct classification Upper Lower
Observation Upper 53 7 88.33%
Lower 3 10 76.92%
Total 86.30%
7.5. Discussion 7.5.1 Overview
As shown in Table 7.9, all the models except model 2 exceed 80% for correct classification for upper group.
However, the correct classifications for lower group varies from 60% to 90 % among different models. As for precision, similar tendency can be observed from Table 7.10. Although precision for upper group exceed 0.9 in all the models, for lower group, the maximum is 0.6316 in model 4.
Incorrect classifications include actual lower group students being misclassified as upper group and vice versa. The former case will likely to occur when the difficulty levels of assignments and examinations are low. The latter case will likely to occur when these difficulties are high.
7.5.2 Model 2
This model is the only model with less than 80% correct classification for upper group classification.
Approximately 25 % of the students who actually belong to upper group were predicted to be lower group students. This model employs only one variable (average assignment scores) for the prediction. The assignments were adopted from EIKEN Grade Pre-1 tests, which were at a higher difficulty level. The result suggests that even those who belong to upper group could not have higher score for the assignment.
7.5.3 Models 4 and 6
Models 4 and 6 have higher correct classifications for lower group than those of upper group. Both models employ average assignment scores for the prediction.
Model 4 uses weighted average scores of exams, too. These two explanatory variables allowed higher prediction not only for lower group but also for upper group.
Model 6 uses assignment study hours, in addition to average assignment scores. Compared to model 2, correct classification improves just by 3 % point for upper group and precision improves just in 0.03 point.
As shown in Table 7.8, partial correlation coefficient between assignment study hours and assignment average scores was negative weak (-0.073), leading to lesser improvement in prediction for additional variable.
7.5.4 Model 7
The model uses all the explanatory variables. Compared to model 4 which does not use assignment study hours, accuracy and precision for lower group yield lower numbers. As shown in Table 7.8, the partial correlation between assignment study hours and reading score was statistically insignificant. This partly explains degrade in prediction.
7.6 Conclusions
Using certificate exam is effective to objectively evaluate proficiency. TOEIC has been attracting attention from business world. However, the cost to take test is one of the obstacles for students to take one regularly.
When prediction can be achieved through learning outcomes of English course, students can obtain necessary guideline for the preparation. Also, teachers can have valuable index for class management.
In this study, discriminant analysis was applied in order to predict upper and lower group of TOEIC Bridge reading scores from learning outcomes. The results showed that a model employing weighted average exam scores and average assignment scores predicted upper and lower group with 89.04% of accuracy.
However, for the lower group, the precision was lower, suggesting assignments with higher difficult level misclassified upper group students as lower group students. In order to predict students’ proficiency accurately, assignments whose difficulty levels are calibrated properly according to students’ skill are important. Through these calibrated assignments, students will have a higher chance to improve their reading skills which, in turn, will have a positive influence on the result of a certificate exam.
There are three directions for future study.
The first direction of the study is to expand the participating students to include different faculties in order to find a better model in predicting students’ reading proficiency. One of the authors is scheduled to teach technical English for students in a faculty of science. The new experiments and results by applying this method to the students will be useful for many professors in similar faculties to review overall English course structures.
The second direction of the study is a further analysis of study hours. Discussions in 5.3 and 5.4 suggest that although many upper group students spent shorter hours for the assignments, some used longer hours.
Analyzing factors influencing the difference in study hours among the upper group students will lead to a new finding for more effective classification criteria.
And the third direction is to incorporate ability scores provided by TOEIC operator to improve accuracy of discriminant analysis. For TOEIC Bridge used in this study, five sub-scores are provided. Since each sub- score is rated from one to three and no distinctions are made between listening and reading sections, they are not good input for the analysis. However, TOEIC L&R test result comes with ten ability scores, five each for listening and reading sections. Each score is evaluated in percentile. The distinction between listening and reading section and percentile evaluation make these abilities scores good candidate for future analysis.
References
[18] Ministry of Education, Culture, Sports, Science and Technology. (n.d.). Improvement of Academic Abilities (Courses of Study). Retrieved April 2, 2019, from
http://www.mext.go.jp/en/policy/education/elsec/title02/detail02/1373859.htm
[19] Koreto, Y. (2017). The History of English Language Education in Postwar Japan: Focusing on the Revision of the Course of Study. Bulletin of Educational Science, No. 20, 1–12. (in Japanese)
[20] Kumazawa, M. (2018). Reforms in English Language Education in Japanese Secondary Schools: Impacts and Issues. Studies in Language and Culture, J.F. Oberlin University, No. 9, 17–31. (in Japanese)
[21] Tada, M. (2016). Recent Reform to the English Education System in Japan. 21st Century Education Forum, No. 11, 21–29.
[22] IIBC. (2013). Survey on English usage in listed companies in Japan. Retrieved March 22, 2019, from https://www.iibc-global.org/toeic/official_data/lr/katsuyo_2013.html (in Japanese) [23] IIBC. (2018). TOEIC Program DATA & ANALYSIS 2018. Retrieved March 22, 2019, from
https://www.iibc-global.org/library/default/toeic/official_data/pdf/DAA.pdf (in Japanese) [24] IIBC. (n.d.). TOEIC Tests Usage: entrance exam and credit certification. Retrieved March 22,
2019, from https://www.iibc-global.org/toeic/official_data/lr/search.html (in Japanese) [25] Taguchi, T. (2018). TOEIC, study time, and grit: A case study of Aichi University of
Education. Liberal Arts and Education, Aichi University of Education, No. 18, 1–9. (in Japanese)
[26] Maruyama, M., Ogasawara, S., and Utsunomiya, Y. (2018). Estimating the TOEIC Scores from the G-℡P Scores by the Generalized Linear Model: From the Data Obtained from Nagasaki University Students from 2011 to 2016. Journal of Center for Language Studies, Nagasaki University, No. 6, 33–51. (in Japanese)
[27] Doi, M., & Cheung, C. K. (2014). A Descriptive and Longitudinal Analysis of TOEIC IP and TOEFL ITP Scores at Chiba University. Papers on Languages and Cultures, No. 8, 15–32. (in Japanese)