Fukushima Medical University
福島県立医科大学 学術機関リポジトリ
This document is downloaded at: 2021-11-07T23:40:04Z
Title Effect of the Fukushima earthquake on weight in early childhood - a retrospective analysis( 本文 )
Author(s) 小野, 敦史
Citation
Issue Date 2018-09-28
URL http://ir.fmu.ac.jp/dspace/handle/123456789/719
Rights © The Author(s)
DOI
Text Version ETD
Effect of the Fukushima earthquake on weight in early childhood
- a retrospective analysis
Atsushi Ono, MD,
1Tsuyoshi Isojima, MD,
2Susumu Yokoya, MD, PhD,
3Noriko Kato,
MD, PhD,
4Toshiaki Tanaka, MD, PhD,
5Zentaro Yamagata, MD, PhD,
6Shoichi Chida,
MD, PhD,
7Hiroko Matsubara, PhD,
8Soichiro Tanaka, MD, PhD,
9Mami Ishikuro,
PhD,
10, 11Masahiro Kikuya, MD, PhD,
10, 11Shinichi Kuriyama, MD, PhD,
8, 10, 11Shigeo Kure, MD, PhD,
9, 10Mitsuaki Hosoya, MD, PhD
1Affiliations:
1Department of Pediatrics, School of Medicine, Fukushima Medical
University, Fukushima, Japan;
2Department of Pediatrics, Graduate School of Medicine,
The University of Tokyo, Tokyo, Japan;
3Department of Medical Subspecialties,
National Center for Child Health and Development, Tokyo, Japan;
4Department of
Early Childhood and Elementary Education, Jumonji University, Niiza, Japan;
5
Japanese Association for Human Auxology, Tokyo, Japan;
6Department of Health
Sciences, Interdisciplinary Graduate school of Medicine and Engineering University of
Yamanashi, Chuo, Japan;
7Department of Pediatrics, School of Medicine, Iwate
Medical University, Morioka, Japan;
8Department of Disaster Public Health,
International Research Institute of Disaster Science, Tohoku University, Sendai, Japan;
9
Department of Pediatrics, Graduate School of Medicine, Tohoku University, Sendai,
Japan;
10Tohoku Medical Megabank Organization, Tohoku University, Sendai, Japan;
11
Department of Molecular Epidemiology, Graduate School of Medicine, Tohoku
University, Sendai, Japan
Correspondence to: Atsushi Ono, Department of Pediatrics, School of Medicine,
Fukushima Medical University, 1 Hikariga-oka, Fukushima City, Fukushima, 960-1295
(Japan), [[email protected]], 81-24-547-1295
ABSTRACT
Objective
There have been no reports evaluating the physical growth in early childhood in
Fukushima Prefecture after the Great East Japan earthquake. We retrospectively
investigated the health examination data in early childhood (aged 0–3 years).
Methods
We divided the affected children into respective groups according to the interval from
the disaster to the time of health examination and age, as follows: group I, birth to 3–4
months in boys [1.81 (range, 0–6 months)] and girls [1.79 (range, 0–7 months)]; group
II, 3–4 months to 6–10 months in boys [6.37 (range, 3–9 months)] and girls [6.35 (range,
3–9 months)]; group III, 6–10 months and 18 months in boys [16.2 (range, 5–22
months)] and girls [16.9 (range, 5-22 months)]; and group IV, 18 months to 36–42
months in boys [21.0 (range, 18–24 months)] and girls [21.0 (range, 18–24 months)].
Using height and body mass index, the health status of each group was compared with
that of unaffected controls (i.e., children who experienced the disaster after their health
examination at 36–42 months).
Results
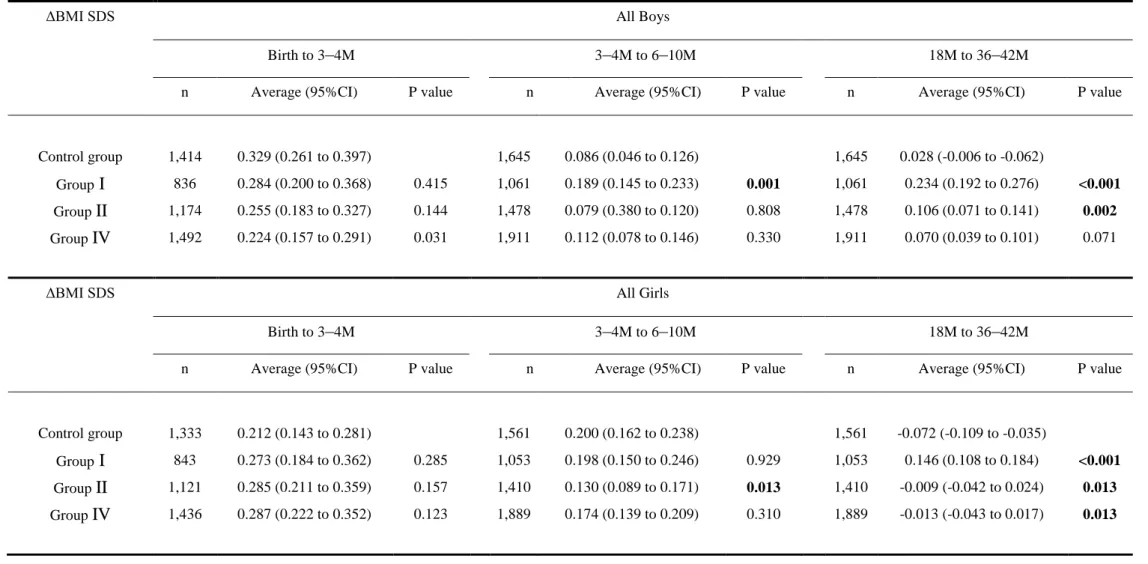
The change in body mass index between the health examinations at 18 months and 36–
42 months was significantly increased in group I (95% CI: all boys, 0.192–0.276 vs.
−0.006–0.062, p < 0.001 and all girls, 0.108–0.184 vs. −0.109 to −0.035, p < 0.001) and group II (95% CI: all boys, 0.071–0.141 vs. −0.006–0.062, p = 0.002 and all girls,
−0.042–0.024 vs. −0.109 to −0.035, p = 0.013).
Conclusions
Children who were affected by the disaster in Fukushima Prefecture in early childhood
were overweight. The use of pre-existing information, such as health examination data,
was beneficial for investigation of the physical growth of affected children.
INTRODUCTION
The Great East Japan earthquake occurred on March 11, 2011 [1] and caused a great
deal of damage in the areas of Iwate, Miyagi, and Fukushima Prefectures.[2] The
resultant tsunami destroyed many houses on the Pacific coast and forced many people in
the area to evacuate. Moreover, the Fukushima Daiichi Nuclear Power Plant accident
forced many people living around the power plant to leave their homes. Therefore, the
residents in Fukushima Prefecture were likely influenced, either directly or indirectly,
by the earthquake disaster. The influence of the disaster on affected adults and nursery
school children over the age of 3 years has been reported.[3-9] In this study, we
performed a growth survey on children who were affected in early childhood (aged 0–3
years) in Fukushima Prefecture.
Generally, body mass index (BMI) is used to assess physical data, such as obesity, in
adults. However, BMI cannot be compared among children because it varies in different
age groups and changes substantially with age. In order to standardize the height and
BMI in childhood according to sex and age, we used the standard deviation score
(SDS).
METHODS
Study design and subjects
The survey design and population were described in detail in a previous paper.[10]
According to the Maternal and Child Health Act, local governments across Japan must
perform health examinations between 18 months and 2 years old and between 3 years
and 4 years old.[11] Moreover, publicly funded infant medical examinations are carried
out in Fukushima Prefecture at 3–4 and 6–10 months of age. We sought to
retrospectively investigate the records of these five health examinations, including those
at birth, and invited all local governments in Fukushima Prefecture to participate in the
survey. Eventually, 31 of 57 local governments, representing 79.6% of the total number
of births in Fukushima Prefecture during the target periods, participated in this survey
(Figure 1).
Data were provided by the one of the following methods: 1) completion of survey
sheets by public health nurses who were employed by the local governments, 2) visits to
local health centers to transcribe health examination data, or 3) submission of electronic
datasets of pre-existing health examination records from which all personally
identifiable information were removed. The survey was conducted from July 2012 to
October 2014, in order to collect data on children who were born over a relatively wide
range of birth years.
During the periods of investigation, we collected data on 4,387 children who were born
between March 1, 2007 and August 31, 2007 and who experienced the disaster and its
after effects after their 36–42-month health examinations; on 6,167 children who were
born between March 1, 2009 and August 31, 2009 and experienced the disaster before
their 36–42-month health examinations; and on 10,046 children who were born between
June 1, 2010 and April 30, 2011 and who either experienced the disaster when they
were under 10 months old or were not yet born. During these target periods, data were
collected from a total of 20,600 children, who accounted for 81.9% of the 25,148 total
number of births registered by the 31 local governments.
We classified the children into the following six groups: 1) group zero included children
who experienced the disaster before birth; 2) group I included children who experienced
the disaster between birth and their 3–4-month health examination; 3) group II included
children who experienced the disaster between their 3–4- and 6–10-month health
examinations; 4) group III included children who experienced the disaster between their
6–10-month and 18-month health examinations; 5) group IV included children who
experienced the disaster between their 18-month and 36–42-month health examinations;
and 6) the control group, which included 3,206 children who experienced the disaster
after their 36–42-month health examinations.
We aimed to compare the groups based on the age when the children experienced the
disaster and their physical activity level (Figure 2). In the process of gathering such
necessary data (Figure 3) and in order to ensure that the data gathered were from the
same children in all health examinations, we used only complete data from at least four
health examinations and excluded the incomplete data. Group zero represented the
group of children who experienced the disaster before birth and were, therefore, not
eligible and excluded from this survey. The number of children who satisfied the
definition of group III during the first data collection was very few. Because of this
small number and the large difference in the populations, group III was not comparable
with the other groups under equal conditions and was excluded. We eventually used the
available data from 12,008 children.
From the Pacific coast side to the west, Fukushima Prefecture is separated into three
areas (i.e., Hamadori, Nakadori, and Aizu) by mountains and highlands that are 500–
2,000 meters above sea level. The distance from the west side of the Fukushima Daiichi
Nuclear Power Plant to the Hamadori, Nakadori, and Aizu areas are approximately 0–85
km, 15–100 km, and 70–170 km, respectively. It was thought that the degree of actual
radioactive contamination differed among the three areas (Figure 1), and the influence
on the residents of Fukushima Prefecture was likewise expected to differ. Therefore, we
further divided each of the four groups according to these three areas and evaluated the
corresponding influence of the disaster (Table 1 and Supplementary Table 1-6).
Statistical analysis
We assessed height and BMI using the records at birth and each of the health
examinations undertaken at 3–4 months, 6–10 months, 18 months, and 36–42 months of
age. Due to the fact that BMI in childhood changes substantially with age, comparison
of BMI among children of different age groups is difficult. Moreover, the age in months
of children taking the same health examination varies. For that reason, it was necessary
to standardize each BMI in childhood according to sex and age. Cole constructed centile
curves for BMI using the LMS method, which was adopted by Inokuchi et al for the
Japanese population.[12, 13] Therefore, we are now able to express BMI as SDS.
Standard deviation (SD) is defined as the square root of the variance and represents the
width of the distribution. The zero of SDS represents the average value, and the SDS
represents the number of times that the SD diverges from the average value. We
converted the height and BMI of all children to height SDS and BMI SDS using a calculation software,[14] then calculated the ΔBMI SDS as the difference in BMI SDS
between two consecutive health examinations, as follows: between birth and 3–4
months, between 3–4 and 6–10 months, and between 18 and 36–42 months.
Using the Microsoft Excel 2010 software package for Windows, the t-test was
performed to assess the significance of differences in height SDS, BMI SDS, and ΔBMI
SDS. We stratified the indicators by region and sex in order to examine the differences
between the control group and groups I, II, and IV. In our analysis, because there were
three pairwise comparisons between the control group and the other three groups for
each analysis stratified by region and sex, a p value of less than 0.016 was regarded as
statistically significant using the Bonferroni correction.
Ethics committee approval
The survey protocol was approved by the institutional review board of Fukushima
Medical University (authorization number 1487). Our survey was conducted in
accordance with the National Ethical Guidelines for Epidemiological Research.[15] We
collected only existing data and, therefore, did not obtain informed consent from the
participants. Accordingly, we disclosed information, including the significance,
objectives, and methods of the survey, to the public via the website of the School of
Medicine, Tohoku University (http://www.med.tohoku.ac.jp/public/ekigaku2013.html).
RESULTS
We compared the height SDS, BMI SDS, and ΔBMI SDS before and after the disaster
between the affected children (group I, II, and IV) and the unaffected children (control group). Moreover, we compared the ΔBMI SDS in these groups according to the three areas (i.e., Hamadori, Nakadori, and Aizu).
Height SDS
As shown in Figure 4 and Table 2, no significant differences were observed between the
control group and groups I, II, and IV.
BMI SDS
As shown in Figure 5 and Table 3, the BMI SDS of groups I, II, and IV were equal to or
less than that of the control group before the disaster. After the disaster, on the 36–
42-month health examination, the BMI SDS for boys in the control group [95%
confidence interval (CI): 0.187–0.277] was significantly lower than that in group I (95%
CI: 0.298–0.404; P = 0.001) and group II (95% CI: 0.302–0.390; p < 0.001). For girls,
the BMI SDS in the control group (95% CI: 0.162–0.250) was significantly lower than
that in group I (95% CI: 0.240–0.346; p = 0.013) and group II (95% CI: 0.265–0.355; p
= 0.001).
ΔBMI SDS
As shown in Figure 6 and Table 4, in the Hamadori area, the ΔBMI SDS between the 3–
4 and 6–10 month health examinations for boys was higher in group I than in the control group (95% CI: 0.085–0.233 vs. −0.124–0.030, p < 0.001). The ΔBMI SDS
between the 18 months and 36–42 months health examinations was significantly higher in group I than in the control group in both boys (95% CI: 0.319–0.473 vs. −0.052–
0.068, p < 0.001) and girls (95% CI: 0.208–0.342 vs. −0.206 to −0.048, p < 0.001). The
ΔBMI SDS between the 18 months and 36–42 months health examinations was
significantly higher in group II than in the control group in both boys (95% CI: 0.163–
0.285 vs. −0.052–0.068, p < 0.001) and girls (95% CI: 0.019–0.148 vs. −0.206 to
−0.048, p < 0.001).
In the Nakadori area, the ΔBMI SDS between the 18 months and 36–42 months health
examinations was significantly higher in group I than in the control group in both boys
(95% CI: 0.123–0.233 vs. 0.008–0.100, p = 0.001) and girls (95% CI: 0.062–0.166 vs.
−0.086–0.004, p < 0.001). For all of the three periods in the Aizu area, no significant
differences were observed between the control group and groups I, II, and IV.
DISCUSSION
The ΔBMI SDS between the 18 months and 36–42 months health examinations was
significantly increased in children who experienced the disaster between birth and their
6–10-month health examination. Also, a trend toward overweight children was observed
in the Hamadori and Nakadori areas, but not in the Aizu area. Likewise, previous
reports among nursery school children reported that unlike Iwate and Miyagi
prefectures, overweight was characteristically observed in Fukushima Prefecture with a
significant difference.[6, 9] It was described that the difference might be caused by
unbalanced diet and restricted physical activities. The children of Group I and II in this
survey, however, had mainly drunk milk around the time of disaster. Therefore, an
association of the observed overweight and unbalanced diet was unlikely.
On the other hand, in the aftermath of the tsunami, Fukushima Prefecture was severely
affected by the Fukushima Daiichi Nuclear Power Plant accident. The radiation levels
were relatively high in the Hamadori area, somewhat elevated in the Nakadori area, and
only slightly elevated in the Aizu area (Figure 1).[16] After the accident, the Ministry of
Education, Culture, Sports, Science and Technology and the Ministry of Health, Labour
and Welfare of Japan jointly released a statement on restrictions to outdoor activity in
all schools and nursery schools based on the air radiation. Restrictions on outdoor
activity were enforced by the local governments across almost all of the Hamadori area
and much of the Nakadori area that had high radiation levels.[17, 18]
There was a relatively close correlation between the areas with high air radiation level
in which restriction of outdoor activity was deemed necessary and the areas in which a
trend toward overweight children was observed. The impact of restriction of outdoor
activity after the disaster might have been more significant on children aged over one
old than on other children, probably because of the fact that toddlers are generally
encouraged and actually begin to engage in various activities, including outdoor play,
after one year old.[19] Based on the above, the restriction of outdoor activity as one of
potential causes of the presented trends in overweight in Fukushima Prefecture;
significant overweight after 1 year of age and its regional differences.
Body mass in young adults is strongly related to body mass in childhood.[20] Moreover,
an early adiposity rebound has been found to be significantly associated with BMI level
at a later age and an increased risk for being overweight.[21, 22] Early detection of
adiposity rebound is important in preventing metabolic syndrome.[23] It is also
important to promote early intervention in order to prevent adult obesity. Some studies
have reported that stress on the affected mothers caused growth failure in children
during the perinatal period [24, 25 and is a risk factor for childhood obesity.[26] Early
intervention for the affected mothers prior to delivery is, therefore, also necessary to
preserve the health of their children.[27]
There are three limitations to this study. First, we used data from only 31 of 57 local
governments that agreed to participate in this survey. Nevertheless, these local
governments were large municipalities and covered 79.6% of the number of childbirths
in Fukushima Prefecture during the target periods. Second, we did not investigate the
causes of overweight in detail and outdoor activity itself in early childhood; there had
been no comprehensive or extensive survey on outdoor activity in early childhood after
the disaster. Being overweight may be associated with an unbalanced diet; the changes
in the eating habits in the evacuation area were considered to be one of the causes of
adult obesity.[5, 28] However, there are no reports on the relationship between early
childhood diet, such as milk or baby food, and changes in body size before and after the
disaster. Another possible cause of overweight is stress, and it has been shown that
stress may cause growth failure and lead to being overweight. Sleep disorders may also
be an important factor in being overweight among affected adults and children.[29, 30]
However, we did not investigate in this study the influence of stress and sleep disorders
on being overweight. Therefore, diet, stress, and sleep disorders cannot be excluded as
factors that might have contributed to being overweight in this study. Lastly, because of
unequal interval between data collections, the number of children included in group III
became much smaller than the other groups. Consecutive data collection could have
minimized the difference between sample sizes of the groups analyzed.
We retrospectively analyzed the data on health examination and discovered that the
availability of normal baseline data for comparison with those after the event were
useful. The health examination data from within Fukushima prefecture is large, but not
all could be obtained and the only common variables available were height and weight.
The use of an online backup service and standardization of the format of data sheets to
manage health examination records nationwide will likely enable easier collection of
more data.
Conclusion
After the disaster, being overweight was observed between the 18 months and 36–42
months health examination in children who experienced the disaster between birth and
their 6–10-month health examination; this trend was observed in the Hamadori and
Nakadori areas where the radiation levels were relatively high. The use of pre-existing
health examination data in early childhood, when physical growth was marked, was
beneficial because the physical examination findings were described in detail.
Acknowledgments
The authors wish to express their gratitude to all those who were responsible for
maternal and child health in the respective local governments for their continuous
participation in the survey.
Funding and Competing interests:
This study was conducted as part of the “Surveillance Study on Child Health in the
Great East Japan Earthquake Disaster Area” and supported in full by funding from the
Health and Labour Sciences Research Grant (H24-jisedai-shitei-007, fukkou). The
authors have no financial relationships relevant to this manuscript, including (1) the
study design; (2) collection, analysis, and interpretation of data; (3) writing of the
report; and (4) decision to submit this manuscript for publication, and have no conflicts
of interest to disclose.
Abbreviation: SDS – Standard Deviation Score, BMI – Body Mass Index, LMS
method – Lambda-Mu-Sigma method
What is known about the subject
After the 2011 Great East Japan Earthquake, lifestyle diseases, such as obesity, in
affected adults were reported. Recently, overweight in nursery school children aged
over three years and who were affected by the disaster has also been reported.
What this study hopes to add
After the disaster in Fukushima Prefecture, a trend toward being overweight was
observed in early childhood (age 1 to 3 years). The use of pre-existing data on early
childhood, such as health examination data, was beneficial for investigating the physical
growth of the affected children.
REFERENCES
1. Japan Meteorological Agency. Information on the 2011 Great East Japan Earthquake.
http://www.data.jma.go.jp/svd/eqev/data/2011_03_11_tohoku/ (accessed 20 April,
2017).
2. National Police Agency of Japan. Damaged situation and police countermeasures
associated with 2011 Tohoku district–off the Pacific Ocean Earthquake.
https://www.npa.go.jp/archive/keibi/biki/higaijokyo_e.pdf Updated December 9, 2016
(accessed 20 April, 2017).
3. Tsubokura M, Takita M, Matumura T, et al. Changes in metabolic profiles after the
Great East Japan Earthquake: a retrospective observational study. BMC Public Health
2013;13:267. doi: 10.1186/1471-2458-13-267.
4. Kawasaki Y, Hosoya M, Yasumura S, et al. The basic data for residents aged 16
years or older who received a comprehensive health check examinations in 2011-2012
as a part of the Fukushima health management survey after the Great East Japan
Earthquake. Fukushima J Med Sci 2014;60:159–69.
5. Ohira T, Hosoya M, Yasumura S, et al. How lifestyle affects health–changes in health
status before and after the earthquake. Fukushima J Med Sci 2014;60:211–2.
6. Yokomichi H, Zheng W, Matsubara H, et al. Impact of the great east Japan
earthquake on the body mass index of preschool children: a nationwide nursery school
survey. BMJ Open 2016;6: e010978. doi: 10.1136/bmjopen-2015-010978
7. Zheng W, Yokomichi H, Matsubara H, et al. Longitudinal changes in body mass
index of children affected by the Great East Japan Earthquake. Int.J Obes (Lond)
2017;41:606–12.
8. Kikuya M, Matsubara H, Ishikuro M, et al. Alterations in physique among young
children after the Great East Japan Earthquake: Results from a nationwide survey. J
Epidemiol 2017;27:462–8. doi: 10.1016/j.je.2016.09.012
9. Isojima T, Yokoya S, Ono A, et al. Prolonged elevated body mass index of preschool
children after The Great East Japan Earthquake. Pediatr Int 2017;59:1002–9. doi:
10.1111/ped.13340
10. Matsubara H, Ishikuro M, Kikuya M, et al. Design of the health examination survey
on early childhood physical growth in the Great East Japan Earthquake affected areas. J
Epidemiol. 2017;27:135–42. doi: 10.1016/j.je.2016.03.001.
11. National Diet Library. Maternal and Child Health Act, Law number: Act No. 141 of
1965 (in Japanese).
http://law.e-gov.go.jp/cgi-bin/idxselect.cgi?IDX_OPT=1&H_NAME=%95%ea%8e%71
%95%db%8c%92&H_NAME_YOMI=%82%a0&H_NO_GENGO=H&H_NO_YEAR
=&H_NO_TYPE=2&H_NO_NO=&H_FILE_NAME=S40HO141&H_RYAKU=1&H_
CTG=1&H_YOMI_GUN=1&H_CTG_GUN=1 (accessed 20 April, 2017).
12. Cole TJ. The LMS method for constructing normalized growth standards. Eur J Clin
Nutr 1990;44:45–60.
13. Inokuchi M, Hasegawa T, Anzo M, et al. Standardized centile curves of body mass
index for Japanese children and adolescents based on the 1978-1981 national survey
date. Ann Hum Biol 2006;33:444–53.
14. The Japanese Society of Pediatric Endocrinology. Software for BMI and BMI
percentile SDS. http://jspe.umin.jp/medical/taikaku.html (accessed 20 April, 2017).
15. Ministry of Education, Culture, Sports, Science and Technology, and Ministry of
Health, Labour and Welfare. Ethical Guidelines for Epidemiological Research (in
Japanese). http://www.lifescience.mext.go.jp/files/pdf/37_139.pdf (accessed 20 April,
2017).
16. Fukushima Prefecture. Result of monitoring survey of radiation levels in Fukushima
Prefecture. https://www.pref.fukushima.lg.jp/sec/16025d/kako-monitoring.html.
(accessed 20 April, 2017).
17. Ministry of Health, Labour and Welfare, Japan. The temporary way of thinking in
the use judgements of buildings and grounds of nursery schools in Fukushima.
http://www.mhlw.go.jp/stf/houdou/2r98520000019qpz-att/2r9852000001nluo.pdf.
(accessed 20 April, 2017).
18. Ministry of Education, Culture, Sports, Science and Technology, Japan. The
temporary way of thinking in the use judgements of buildings and grounds of schools in
Fukushima. http://www.mext.go.jp/a_menu/saigaijohou/syousai/1305173.htm).
(accessed 20 April, 2017).
19. Tremblay MS, Leblanc AG, Carson V, et al. Canadian Physical Activity Guidelines
for the early years (aged 0-4 years). Appl Physiol Nutr Metab 2012;37:345–69.
20. Tsukada H, Miura K, Kido T, et al. Relationship of childhood obesity to adult
obesity: A 20–year longitudinal study from birth in Ishikawa prefecture, Japan (in
Japanese). Nihon Koshu Eisei Zasshi 2003;50:1125–34.
21. Rolland-Cachera MF, Deheeger M, Bellisle F, et al. Adiposity rebound in children:
a simple indicator for predicting obesity. Am J Clin Nutr 1984;39:129–35.
22. Rolland-Cachera MF, Deheeger M, Maillot M, et al. Early adiposity rebound:
causes and consequence for obesity in children and adults. Int J Obes (Lond) 2006;30
Suppl 4:S11–7.
23. Koyama S, Ichikawa G, Kojima M, et al. Adiposity rebound and the development of
metabolic syndrome. Pediatrics 2014;133:e114–9. doi: 10.1542/peds.2013-0966.
24. Harville E, Xiong X, Buekens P. Disasters and perinatal health: a systematic review.
Obstet Gynecol Surv 2010;65:713–28.
25. Bromet EJ, Havenaar JM, Guey LT. A 25 year retrospective review of the
psychological consequences of the Chernobyl accident. Clin Oncol (R Coll Radiol)
2011;23:297–305.
26. Dancause KN, Laplante DP, Fraser S, et al, Prenatal exposure to a natural disaster
increases risk for obesity in 5
1/
2-year-old children. Pediatr Res 2012;71:126–31.
27. Goto A, Bromet EJ, Fujimori K, Pregnancy and Birth Group of Fukushima Health
Management Survey. Immediate effects of the Fukushima nuclear power plant disaster
on depressive symptoms among mothers with infants: a prefectural-wide cross-sectional
study from the Fukushima Health Management Survey. BMC Psychiatry 2015;15:59.
doi: 10.1186/s12888-015-0443-8.
28. Inoue T, Nakao A, Kuboyama K, et al. Gastrointestinal symptoms and
food/nutrition concerns after the great East Japan earthquake in March 2011: survey of
evacuees in a temporary shelter. Prehosp Disaster Med 2014;29:303–6.
29. Ohira T, Hosoya M, Yasumura S, et al. Effect of evacuation on body weight after
the Great East Japan Earthquake. Am J Prev Med 2016;50:553–60.
30. Halal CS, Matijasevich A
,Howe LD, et al. Short sleep duration in the first years of
life and obesity/overweight at age 4 years: A birth cohort study. J Pediatr 2016;168:99–
103.
FIGURE LEGENDS
Figure 1
Upper: The 31 local governments that participated in this survey are shown on the map
of Fukushima Prefecture. Lower: The air radiation dose from March 2011 to December
2014 for each of the three areas is shown.
◆: Hamadori area, ■: Nakadori area, ▲: Aizu area
Figure 2
The health examination periods (birth, 3–4 months, 6–10 months, 18 months, and 36–42
months) and the six groups (zero, I, II, III, IV, and control) divided according to the age
during the disaster and average (range) age of each group.
M, month health examination
Figure 3 The number of data collected from the 31 local governments participating in
this survey.
Figure 4 Height SDS of all boys and girls in Fukushima Prefecture
◆: Control Group, ■: Group I, ▲: Group II, ×: Group IV
SDS, standard deviation score; M, month health examination
Figure 5 The BMI SDS of all boys and girls in Fukushima Prefecture
◆: Control Group, ■: Group I, ▲: Group II, ×: Group IV
BMI, body mass index; SDS, standard deviation score; M, month health examination
※ P value < 0.016 ※※ P value < 0.01 ※※※ P value < 0.001
Figure 6 ΔBMI SDS of all boys and girls in Fukushima Prefecture
◆: Control Group, ■: Group I, ▲: Group II, ×: Group IV
BMI, body mass index; SDS, standard deviation score; ΔBMI SDS, BMI SDS between
two consecutive health examinations; M, month health examination
※ P value < 0.016 ※※ P value < 0.01 ※※※ P value < 0.001
Figure 1
0 0.5 1 1.5 2
Hamadori area Nakadori area Aizu area
2011 2012 2013 2014
A ir r adi at ion dos e
March 2011
0 30k
Aizu area Nakadori area Hamadori area
Fukushima
Daiichi
Nuclear
Power
Plant
Birth 3-4M 6-10M 18M 36-42M
I 2114
II 2888
III 383
IV 3800 Zero
551
Control 3200
Health Examination
Group N=
Figure 2
Births recorded by 31 local governments in Fukushima Prefecture during target periods N=25148
Data collected during periods for investigation N=20600
March to August 2007 4387 March to August 2009 6167
Available Data N=12008 Group I 2114 Group II 2888
Matched Data
Unmatched Data N=7658 Unavailable Data
N=934 Group Zero 551
Target
periods
Figure 3
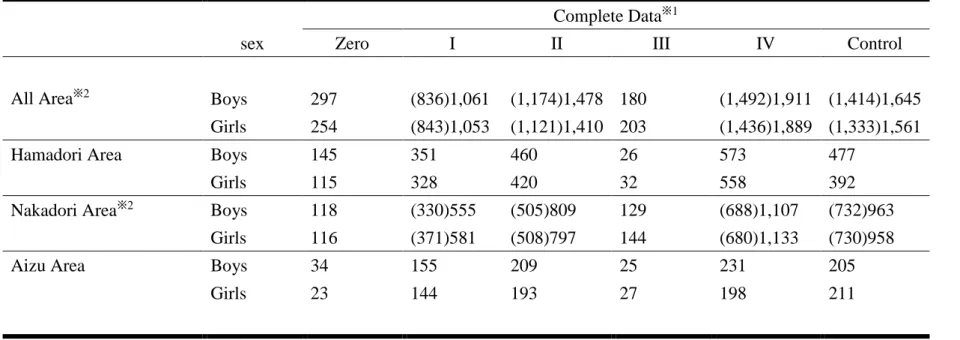
Table 1 The sex distribution in each area and group in those with complete data
Complete Data
※1sex Zero I II III IV Control
All Area
※2Boys 297 (836)1,061 (1,174)1,478 180 (1,492)1,911 (1,414)1,645 Girls 254 (843)1,053 (1,121)1,410 203 (1,436)1,889 (1,333)1,561
Hamadori Area Boys 145 351 460 26 573 477
Girls 115 328 420 32 558 392
Nakadori Area
※2Boys 118 (330)555 (505)809 129 (688)1,107 (732)963
Girls 116 (371)581 (508)797 144 (680)1,133 (730)958
Aizu Area Boys 34 155 209 25 231 205
Girls 23 144 193 27 198 211
※ 1 the only data from group I, II, IV and Control are used in this study.
※ 2 the number in brackets represents the number of children who were examined at birth. They are fewer than the number of other health examination
periods because some data on height at birth were missing in Nakadori area.
Table 2 Number, Average (95% Confidence Interval) and P-value for Height SDS in Fukushima Prefecture
Height SDS All Boys
Birth 36–42M
n Average (95%CI) P value n Average (95%CI) P value
Control group Group I Group II Group IV
1,414 836 1,174 1,492
0.105 (0.050 to 0.160) 0.136 (0.065 to 0.207) 0.121 (0.064 to 0.178) 0.119 (0.069 to 0.169)
0.522 0.728 0.748
1,645 1,061 1,478 1,911
-0.046 (-0.091 to -0.001) -0.106 (-0.164 to -0.048) -0.107 (-0.154 to -0.060) -0.079 (-0.122 to -0.036)
0.110 0.069 0.300
Height SDS All Girls
Birth 36–42M
n Average P value n Average P value
Control group Group I Group II Group IV
1,333 843 1,121 1,436
0.097 (0.038 to 0.156) 0.098 (0.025 to 0.171) 0.153 (0.096 to 0.210) 0.088 (0.035 to 0.141)
0.979 0.187 0.816
1,561 1,053 1,410 1,889
-0.006 (-0.055 to 0.043) -0.063 (-0.122 to -0.004) -0.065 (-0.115 to -0.015) -0.064 (-0.107 to -0.021)
0.143 0.100 0.080
M; month health examination
Table 3 Number, Average (95% Confidence Interval) and P-value for BMI SDS in Fukushima Prefecture
BMI SDS All Boys
Birth 36–42M
n Average (95%CI) P value n Average (95%CI) P value
Control group Group I Group II Group IV
1,414 836 1,174 1,492
-0.048 (-0.102 to 0.006) -0.080 (-0.146 to -0.014) -0.085 (-0.143 to -0.027) -0.017 (-0.068 to 0.034)
0.479 0.363 0.406
1,645 1,061 1,478 1,911
0.232 (0.187 to 0.277) 0.351 (0.298 to 0.404) 0.346 (0.302 to 0.390) 0.281 (0.239 to 0.323)
0.001
<0.001 0.120
BMI SDS All Girls
Birth 36–42M
n Average (95%CI) P value n Average (95%CI) P value
Control group Group I Group II Group IV
1,333 843 1,121 1,436
0.016 (-0.041 to 0.073) -0.119 (-0.190 to -0.048) -0.094 (-0.155 to -0.033) -0.035 (-0.088 to 0.018)
0.004 0.009 0.202
1,561 1,053 1,410 1,889
0.206 (0.162 to 0.250) 0.293 (0.240 to 0.346) 0.310 (0.265 to 0.355) 0.237 (0.196 to 0.278)
0.013 0.001 0.300
M; month health examination
Table 4 Number, Average (95% Confidence Interval) and P- value for ΔBMI SDS in Fukushima Prefecture
ΔBMI SDS
All Boys
Birth to 3 – 4M 3 – 4M to 6 – 10M 18M to 36 – 42M
n Average (95%CI) P value n Average (95%CI) P value n Average (95%CI) P value
Control group Group I
Group II
Group IV
1,414 836 1,174 1,492
0.329 (0.261 to 0.397) 0.284 (0.200 to 0.368) 0.255 (0.183 to 0.327) 0.224 (0.157 to 0.291)
0.415 0.144 0.031
1,645 1,061 1,478 1,911
0.086 (0.046 to 0.126) 0.189 (0.145 to 0.233) 0.079 (0.380 to 0.120) 0.112 (0.078 to 0.146)
0.001
0.808 0.330
1,645 1,061 1,478 1,911
0.028 (-0.006 to -0.062) 0.234 (0.192 to 0.276) 0.106 (0.071 to 0.141) 0.070 (0.039 to 0.101)
<0.001 0.002
0.071
ΔBMI SDS
All Girls
Birth to 3 – 4M 3 – 4M to 6 – 10M 18M to 36 – 42M
n Average (95%CI) P value n Average (95%CI) P value n Average (95%CI) P value
Control group Group I
Group II
Group IV
1,333 843 1,121 1,436
0.212 (0.143 to 0.281) 0.273 (0.184 to 0.362) 0.285 (0.211 to 0.359) 0.287 (0.222 to 0.352)
0.285 0.157 0.123
1,561 1,053 1,410 1,889
0.200 (0.162 to 0.238) 0.198 (0.150 to 0.246) 0.130 (0.089 to 0.171) 0.174 (0.139 to 0.209)
0.929
0.0130.310
1,561 1,053 1,410 1,889
-0.072 (-0.109 to -0.035) 0.146 (0.108 to 0.184) -0.009 (-0.042 to 0.024) -0.013 (-0.043 to 0.017)
<0.001 0.013 0.013
ΔBMI SDS
Hamadori Boys
Birth to 3 – 4M 3 – 4M to 6 – 10M 18M to 36 – 42M
n Average (95%CI) P value n Average (95%CI) P value n Average (95%CI) P value
Control group Group I
Group II
Group IV
477 351 460 573
0.371 (0.249 to 0.493) 0.305 (0.178 to 0.432) 0.305 (0.191 to 0.419) 0.262 (0.157 to 0.367)
0.472 0.440 0.180
477 351 460 573
-0.047 (-0.124 to 0.030) 0.159 (0.085 to 0.233) -0.049 (-0.119 to 0.021)
0.053 (-0.007 to 0.113)
<0.001
0.972 0.042
477 351 460 573
0.008 (-0.052 to -0.068) 0.396 (0.319 to 0.473) 0.224 (0.163 to 0.285) 0.075 (0.015 to 0.135)
<0.001
<0.001
0.127
ΔBMI SDS
Hamadori Girls
Birth to 3 – 4M 3 – 4M to 6 – 10M 18M to 36 – 42M
n Average (95%CI) P value n Average (95%CI) P value n Average (95%CI) P value
Control group Group I
Group II
Group IV
392 328 420 558
0.250 (0.115 to 0.385) 0.287 (0.144 to 0.430) 0.442 (0.325 to 0.559) 0.355 (0.248 to 0.462)
0.713 0.034 0.229
392 328 420 558
0.001 (-0.078 to 0.080) 0.121 (0.041 to 0.201) -0.026 (-0.098 to 0.046)
0.135 (0.074 to 0.196)
0.039 0.625
※10.008
392 328 420 558
-0.127 (-0.206 to -0.048) 0.275 (0.208 to 0.342) 0.083 (0.019 to 0.148) 0.015 (-0.043 to 0.073)
<0.001
<0.001 0.004
ΔBMI SDS
Nakadori Boys
Birth to 3 – 4M 3 – 4M to 6 – 10M 18M to 36 – 42M
n Average (95%CI) P value n Average (95%CI) P value n Average (95%CI) P value
Control group Group I
Group II
Group IV
732 330 505 688
0.383 (0.290 to 0.476) 0.285 (0.146 to 0.424) 0.299 (0.185 to 0.413) 0.276 (0.175 to 0.377)
0.252 0.262 0.127
963 555 809 1,107
0.137 (0.085 to 0.189) 0.189 (0.125 to 0.253) 0.104 (0.048 to 0.160) 0.106 (0.061 to 0.151)
0.234 0.394 0.374
963 555 809 1,107
0.054 (0.008 to 0.100) 0.178 (0.123 to 0.233) 0.062 (0.014 to 0.110) 0.081 (0.041 to 0.121)
0.001
0.082 0.384
ΔBMI SDS
Nakadori Girls
Birth to 3 – 4M 3 – 4M to 6 – 10M 18M to 36 – 42M
n Average (95%CI) P value n Average (95%CI) P value n Average (95%CI) P value
Control group Group I
Group II
Group IV
730 371 508 680
0.284 (0.193 to 0.375) 0.392 (0.199 to 0.459) 0.291 (0.178 to 0.404) 0.297 (0.203 to 0.391)
0.570 0.926 0.840
958 581 797 1,133
0.267 (0.220 to 0.314) 0.200 (0.134 to 0.266) 0.169 (0.115 to 0.223) 0.117 (0.132 to 0.222)
0.090
0.006※10.007
958 581 797 1,133
-0.041 (-0.086 to 0.004) 0.114 (0.062 to 0.166) -0.030 (-0.074 to 0.014) -0.018 (-0.056 to 0.020)
<0.001
0.726 0.435
ΔBMI SDS
Aizu Boys
Birth to 3 – 4M 3 – 4M to 6 – 10M 18M to 36 – 42M
n Average (95%CI) P value n Average (95%CI) P value n Average (95%CI) P value
Control group Group I
Group II
Group IV
205 155 209 231
0.041 (-0.137 to 0.219) 0.230 (0.043 to 0.417) 0.038 (-0.117 to 0.193) -0.028 (-0.199 to 0.143)
0.154 0.979 0.583
205 155 209 231
0.157 (0.049 to 0.265) 0.261 (0.152 to 0.370) 0.266 (0.157 to 0.375) 0.291 (0.193 to 0.389)
0.193 0.167 0.072
205 155 209 231
-0.050 (0.006 to -0.006) 0.070 (-0.034 to 0.174) 0.021 (-0.063 to 0.105) 0.005 (-0.076 to 0.086)
0.092 0.258 0.370
ΔBMI SDS