Architectural Institute of Japan
ArchitecturalInstitute of Japan
Lxt..!,g,,].,,,.,,,,.,.,,,.,,i,,,.,
{OT",r,'.",i..O,1.S.'g".Cft"A'r})a"Nd.93og"21tro':I:ob".,?",g,],n,eering
gpt,g,fizt?im#x,ee,](ffva,g:
'
THE
VERTICAL
LOAD
CARRYING
CAPACITY
OF
THE
COLUMNS
OF
MULTISTORY
REINFORCED
CONCRETE
FRAMES
WITH
THE
EXPERIENCE
OF
HORIZONTAL
LOADING
(PART
2)
-The
effect
of
varioushorizontal
loading
by
TAKAYUKI
SHIMAZU'
and
MD.
ALI
AKBAR
MOLLICK"',
Members
ofA.
I.
J.
1.
Introduction
This
paper
is
the
second
presentation
of aseries
of studieson
the
verticalload
carryingcapacity
ofthe
columnsin
mttltistory reinforced concreteframes
withthe
experienceof
horizontal
ioading.
In
Ref.
(
1
)
atheoretical
approach
and one experimental verification
of
it
werepresented.
In
that
approachan
eiastic
stabilityproblem
of
a
cbntinuous
bar
built
'in
atthe
base
with multi-rotational springs overthe
height
wasdealt
with,for
estimatingthe
verticalload
carrying capacity ofthe
columns of amultistory weakbeam-strong
celumnframe
already subjectedto
horizontal
load
up
to
post
yielding
range,It
was assumedby
consicleringthe
Testoringforce
characteristics of reinforced concpbtemembers
to
be
basically
of
origin
oriented
type
withdegraded
stiffnessthat
beam
ends actas
rotationai springspossessing
equivalent
elastic
stiffnesses
determined
from
the
maximum
rotationsever
experienced
under
horizo"tal
loading,
while continubus columnsin
a rnultisteryframe
act as a continuousbar
having
the
equivalent elasticflexural
rigidity whichto
be
evaluated simultaneouslyfrom
the
equation
derived
based
on energy rnethodto
determine
the
value ofits
buckling
load.
Good
agreement was obtainedbetween
'calculated
resutts andtest
ones.In
that
stucly,however,
only onehorizontal
loading
program
was adoptedto
verifythe
validity ofthe
proposed
theoretical
approach.
As
the
horizontal
loading
history
is
assumed
to
have
the
mostinfluence
on
the
verticalload
carrying capacity ofthe
columns owingto
the
change ofthe
horizontal
load
resisting characteristics of aframe,
fot:us
is,
in
this
paper,
placed
onthe
effect of varioustypes
ofhorizontal
loading
programs.
These
p[ogiams
were selectedto
observethe
effect
ofthe
magnitude ofthe
maximumtotal
deflection
angle,the
number efloading
cycles andthe
history
of applied amplitudes.Jn
this
studythe
better
correlationbetween
the
modeltest
structures andprototype
was also madeby
selectingthe
strength
distribution
ofthe
beams
over
the
height
ofthe
test
structures
and makiitgthe
additional arrangement of constantgravity
load
on eachfloor
beam
than
in
the
study ofPart
1.
'
'
It
has
been
taken
into
considerationto
studythe
advantageouspeints
ofthe
limit
statedesign
method oyerthe
currently used elasticdesign
method, althoughin
this
regard much more studies are reqttiredfor
agenera!
cenclusion.The
abstractof
this
paper
wasalready
reportedin
Ref,2.
2.
Experimental
Program
2,
1
Test
Structures
:
A
single-baysix-steried
reinforcedconcrete
interior
frame
designed
following
the
AIJ
Building
Code
as shownin
Fig.3
of
Part
1
wasalso
used
as aprototype
to
select
the
test
structures
of
this
study.These
teststructures
wereplane
frames
withthe
number ofstories reducedto
four
for
the
simplicity ofthe
app2ication ofloads
asin
Part
1,
The
configuration of atypical
modeltest
structure with overalldimension
and reinLforcementdetails,
wasthe
same aspresented
in
Fig.s
ofPart1.
i
Professor,
University
ofHiroshima,
Dr.
ofEng,
#G[aduate
Student
University
of
Hiroshima,
Mr.
ofEng.
(Manuscript
receivedJan"ary
S,
1988)
-46-Speeimcl-wmCl.Ifft2cl-gH]Cl-M{4
'C3-laHlC3-wrl2c]-ma・C3."H4HoOPSaStirrvps
H{rrm)1700 10 eCum)BOO soeF60'
H de1um・5,83-4e1"'Qlec/c
9-F42HF9
'
'mF40-rT-o
U7 ers'
L'
±.2-2.]ab
aF40-;T"-uF40HrTIO'".Her-O@10ctc
notsets-dig,ll2-3.2"li-sp8-
oEe4oHFT latv -o'
uttsL)L3-3,2e'eaF4DH`.'-iFfinlier-'eHaoH-lfinEE
2-3.201.3.2fp'Table1
,L
Mechanical,
Properties
t.
tt
ofMFterials
,
Test'StFuetures'ConcreteE.(xlOf)Fc'
/t'-//
''
Cl--iL2,4235T.O
Ct-VH22.60,370.2
Reinforeement,
cL--la2.qG346.9'Dia.ff/xloE,(xloeq(xto5
Ct--1142.43335.T6.0-'4.43tS96.50
C3-Vlll2."346,84,oe4.6T1.995.99
C3-Vlt22.'4l332.3'
/t3,2
¢5102l.99G.22
C3・VtS32.34202,42.3
¢5.a3-1.991・.Ol・
C3--t42.31'31T,O1,Oip:.t5.XIO'5.52.
' uoit:k.sl.cm
unit:kg/c-tt/
'
Fig.1
LMIt:mmCToss-section
Properties
ofMembers
of
Test
Structures
BasedonLimitState
.DesigriMethod・Basecl'onCu[crentlyUsedElast
DestgrilrE2thod
±cttO,]4
tO.668,pa
O,66O.99
'
U
go.lt,
ees
O.66' O.66O.9
,11cl'e.11c3"
Testtructarres Cl.vatlCl-UMI CITwn2Cltunt2 Cl-maC3-rm Cl-val4C]-LH4 lb-±zotalLoeding Prograns 2,oe'tl.OO o.so1 o.oo O.50 1.oe 2.oo a68 T,.Cycl/es
].DOe.eo1.oottt
tt
Ttttttttt
ttt
ttttt
ttt
tt
tt
tttt
ttt
2.00 e.oo 2.002,OO].ooo.soO.SDt.oo2.00'
---
----.--
--
---
----
--
....-,--
---.-
--
---
![...t
t/
tTotRi DcfLcctien'Aiigle{:')'
.
+Tensile Retnforcenent Ratio(m'
.
Fig.3
Loading
Programs
Us.ed
in
Horl'zontal
Loading
Test
Fig.2
Modification
ofBearn
Stre]gth
Ratios
frpm
Prototypes
to
Models
./
'
tt
t
tt
The
total
.pumber
of
test
structures
was-eight.The
member cross s,ectionalproperties
of allthe
eighttest
structuresare
illust[ated
in
Fig.
11
The
moelificg.Fipn ofthe
b,e4m
strength ratiosfrorrl'piototype't.o
rpodelis
illustrated
in
Fig,
2.
Four
.test
st'fuctures inCl
series,the
same asthe
test
structureC63-41H
ofPart1,
weredesigned
basicaily
accordingto
the
liniit.state
desigp
methocl.Th6
bther
four
test
structuresin
C3
series weredesignea
basically
accordingto
the
currently used elasticdesign
method.They
were simila[to
the
test
structureC63-42H
ofPart
1,
having
not suddenbut
gradual
clec'rease
of strength ofthe
beams
from
top
to
bottom
ov'er'the
height
ofthe
frames.
The
summation'of
strength
of
the
beams
over
t;
the
height
of
frames
of
6ach
series
wasthe
sameto
bring
them
in
Teasonable:aObMuPiaatr;301n
TTahbeleMie.ChrniCai
PIORertlf.S
Ofthe
Matenal usedfor
the
fonsEructio?.gf
ell
the
tr?t
structures afe'
2,2
Horizontal
Loading
P'rograms
:
Four
horizontal
loading
programs
charhcterizedby
the
magnitude ofdeflection
amplitude, number'of cycles anclthe
histery
oftipplied
amplitudewere
usedfor
this
study as summarized'
in
Fig.
3.
Two
test
structures, onefrom
each series, weretested
undereach
horizointal
loading
program.
In
these
programs,
an ultimatetotal
interstory
deftect{on,angle
induced
by
severe earthquakes was assumedto
be
2.
0
percent
'
-47-Architectural Institute of Japan
ArchitecturalInstitute of Japan
.
with
H3
program
being
assumed
to
be
induced
by
extreme earthquakes.Among
the
four
programs,
the
first
one(H
O,
the
same
one asthat
usedin
Partl,
was consideredto
representone
response ofthe
severe earthquakesthat
may
occur
one
time
in
the
life
time
of abttilding.
The
second one(H2),
of
multi-cycles reversals at a constant amplitude, representsone
respense ofthe
moderate earthquakesthat
mayoccur
several
times
in
the
life
time
ofabuliding.
The
third
one
(H3),
also of multi-cyeles reversals at a constant amplitude,represents
one
response ofthe
extremeearth-quakes
that
may occurless
than
onetime
in
the
life
time
ofabuilding.
The
last
one<H
4),
the
reversedtype
of
the
first
one, aiso represents
one
response
of
the
severe
earthquakes
that
may occur as ofH1
andis
similar
to
responses
mestly causedby
actualearthquakes
as characterizedby
higher
amplitudes
in
the
initial
stage andlower
amplitudesin
the
iater
stage
of
their
excitations.
2.
3
Testing
and
Measurernent
:
All
the
eighttest
strue-tures
weretested
underthe
displacement
controlledstatical-ly
appliedreversed
horizontal
loading,
during
which apw A 1oo Cl-"lr 100
-]o
-2e
-o
lo legtm) +t..-hL..p
t;
200i-i
]oo?cigJ]co c]-"e2oeleo-le-lo
t.1ooPID"lte,'s-P20"dCMM)
t-''s
1oo:'f ]eoP{ig)]oe1co cl-"U100・]o-2
le]ooptm-
-rLie-]--100:1!]oe Ptig rm zco cl-"tG l.10
-f2}ig,.
H'eTtttij'de:s,t/,ilsl'.11tt/'i,,lil・itV'I・l・,;・,'
',C:;iittt.
[ttttttt'tttttt
ttt
'tttttt"
,R
'
ll.s.g-1/trl・/1;t/t:1/ttttt・,y...f.tt.,1.,/,.t・ls.::1/t/tt.=>-tras..tttttt-ttt
.tttttttttsc:...ttX{9..'.t...tt.tt:
tttttttt..rolle
t 1-.'i・・1ilV・:1/'//11'iii'/li・1//,1,/L`ll-f-tttLt-'--tttFle--t'tttt
,
tt-ttttttttt-ttt.
Idtemib:actsttli-;itEil/1,'/・P.'i,.ltt-11ll,:,i.111,x.o-tttttttttttt
:tttt
>.Stmaf
1::・:1 ncL.C. D,T,Displaoenwittransducers w,s.g,wirestiraingage L,C.LnadCellFig.4Set
upfor
Loading
andMeasurement
-lo
]Oeq("m)
C]・zaL]]co2oo LOO ) 'Fm) 1-l;:)
IOl -FLi..
4-g,i-F
Fig.5
Hysteresis
Leopsunder
-r-HH."t'r zoo;:・l ]ooPtig)3co100 e]-"-100
-)eT2
' 1 ]N(ta"1-r-"-+e
rm'
3coHorizentalLoading
-48-Table2
Experimental
Results
of aLlthe
Test
Structures
Vndertlori2ontalLuad
UnderYerticalLoad
Test
Pu(Kg)
Sutl{mtn)
-fi4it[<mm)
StructufesPes.Heg.Ave.Pes.Nes,Rfil・1(tum)Wu(Lon)
[lSl.l(mm)
CI-VHI325.D305.5315.233,93L,4-ST,T20.LO-3D,3-Ba.o
Cl-VIL22B5,O2TO,O27T,5bT,1T7.0-2,22T,93-1.t-t2.0
Cl--ll3312,5250.02SL,33-,O33,9-20.514.ql-3e,6-se.o
cl-vllq313,e275.0294.034.030,2-n,720.9L-21.7.96.0
C3-VM31o,e290,O300,D31.034.0-2e.tLT.BO-33,4-4T,O
C3-Vl12265,a26o.e262,5'IT.O16.4-a.324.52-Lg.6-50.0
C3-VH32S5,O252,5268,T34.03a.1-26.1It.al-ql.o-42.0
C3-V"4292,O285,O2BB.534.02D.9+O.2],j.2030.754.0tt +.t-Pd-b
PPd.]1.-
ttP,P.t.L
t?4 ; ti/'
y''
-
tt
1''
r
'
1 15tox
tslo
xx
×
':t
EL
,:"a:,;t{ , "AL the End l of Cvcle No/1:
Yso
'S
5
/
4
Vs
ill3/i
rCl-wH]
za
-40 -30-20-10O
l
1
P],lui]
Nti NS xl N.1 Ni Nl xN NL NI Ni 1: 11 Ltlo
2e 3o 4ocmm)Ri,i,
i
,i dJi tt itJ t lt tl fl lllJ tl"r tlti/Cl-WH4
-40-]O-20-10
15le
IO5l
xsx
SH SN×
hs
"
O 10s4.3 t i''tt 20]O
40
{mmn)
1105110Stlt
t
' ' ' ltt i C3-WH] tG
Cl-WH3
cl.wn4
C3-WH3
Fig.6
Crack
Patterns
underHorizontaL
Loading
-40 -co -20-ro
O 10ro soco
(mm}
Fig.7
Deflected
Shape
underHorizontal
Loading
constant vertical
load
ofwr12
FlbD=O.
2
{
;l4=5.
04
ton)
was under application onthe
tops
of columns with agravityload
of120
kg
on eachfloor
beam
applied astwo
points
loading
althoughthe
12e
kg
on eachfloor
was alittle
lower
than
design
level,
At
the
end ofthe
last
cycles of reversedhorizontal
loading,
the
verticalloading
test
wa$performed
by
monotoneusincrement
ofthe
verticalload
onthe
columns upto
the
occurrence offrame
failure.
Ten
displacement
transducerS
wereinstalled
and wire straingages
were attached ontwenty
strategicpoints
onthe
test
structuresfor
the
measurement of various response ofthe
test
s.tTuctu[esduring
the
test.
However,
allthe
test
results are notpresented
in
this
paper.
Fig.4
illustrates
the
testing
arTangement.The
verticalloading
apparatus wasdesigned
in
such a waythat
the
top
ofthe
tesit
structures could movefreely
in
its
verticalplane.
3.
Test
Results
D
The
Behavior
underHorizontal
Loading
All
the
eighttest
structures showthe
failure
mechanismby
yielding
underbending
atthe
columnbottorn
ofthe
first
stery and
beam
ends ofthe
secondto
fifth
stories underthe
reversed cyclichorizontal
loading
to
demonstrate
the
hy'steretic
response characteristics ofductile
type.'
・
The
relationsbetween
storyforce
andtop
displacement
during,the
reversedhorizontal
loading
for
allthe
test
structures are shown
in
Fig.5.
The
maximurn response valuesfor
horizontal
load
with respectivehorizontal
displacement
and residualh'orizontal
displacement
aretabulated
in'
the
left
part
ofTable
2.
The
hysteretic
response characteristics of reversedhorizontal
loading
test
ofthe
structures underthe
four
different
loading
programs
are naturallydifferent
but
the
response characteristics oftwo
test
structures under・the
sameloading
prograrns
are almostthe
same,However,
the
rate ofdegradation
of stiffnessduring
the
samehorizontal
loading
history
is
alittle
largeT
in
the
test
structuresin
C
3
seriesthan
in
the
C
1
series.The
horizontal
strength ofthe
test
strdcturesC
1-WH
1
ofthis
study andthe
same
one,
C
63-41
H
of
Part
1
also
showed
nearlythe
same
values,indicating
that
a
constant
gravity
load
on eachfloor
has
little
influence
onthe
final
collapse mechanism againsthorizontal
loading.
-49-Architectural Institute of Japan
ArchitecturalInstitute of Japan H"1 }Ltl"lit2 -1'
r
/tt
kN)t2 Hi/1woil H]12d'-t'
Ct-enl4eFlsss
aaltL..JEtsP-'''''''''''''
-
--so
-go
-]o
-2o
-]o
:e
l
B8
8
×
x
t'ttth
tt,tt
'
?s
Y-l2 5 4] 2 G cl-vallvli11Cl-wn2
cl-wre fi;11 HltZ -J/t "Vtu,n 2 Flt]t2 Flt]li ±tt
J 1:t/'
i'
'・i--'
'
'
)"
'
[C-Nl
C3-IME C3-wrl] C]-an14 O 10 5 4 ] G y -2b 10 tmob;
th/
-se
-no
Fig.9-30
-20
-10
Deflected
Maximum
-o
lo 2o ]e (ntqlShape
atthe
Vertical
Load
Fig.8
Crack
Patterns
underVertical
Loading
W(tan)
W(ton)
3e
20Cl-rm
10
W(ton)
30
2eCl-WH2
la
3o
W(tan)
20Cl-wrl3
10
30
20Cl-;H4
10
W(ton)
-so-6o-4o-2oo2o4o6oso-4o-2oo2o4e6e-6o-4o
UlaL.aclvn30
W(ton)
20C3-Lut1
10
tnt;W{ton)
30
'Heli,L't
20c3-vel2
10
-20O2040-80-60-40-20O2040GH<im)
30
30
20
20
c3-wn3C3-wn4
10
10
.W(ten)
-60-40-20O20"80-6o-4o-2oo2o4oso-60-40-20O204060-60-40-20O2040'
6H
<nrn)
Fig.10
Load-Deflection
Curves
underVertical
Loading
The
cragk'patterns
ofthree
from
eighttest
structures observedunder
horizontal
loading
areillustrated
in
Fig,
6,
Fig.7
illustrates
the
deflected
shape ofthese
test
structures
at
the
peak
and atthe
end ofdifferent
cyc],es under reversedhorizontal
loading,
It
shouldbe
netedthat
there
is
little
evidence
of residualdeflection
causedby
horizontal
loading
in
case ofH4
program
though
remarkabledeflections
are
found
to
remainin
ca$e ofH1
and
H3
programs
having
the
same value ofgiven
maxlmum amplitude{2
×10J'
rad,)
withthat
in
H4,
The
H4
program
wasselected
to
be
the
typical
one of actual responsesto
earthquake rnotions,ii)
The
Behavior
undetVertical・
Loading
Fig.
8
showsthe
crackpatterns
of allthe
test
structuresdeveloped
under
verticalloading
applied afterhorizontal
loading
test,
Among
eighttest structures,four
(of
H
1,
H4)
failed
atthe
third
floor
bearn-column
joints,
two
(of
H
2)
failed
atthe
second
floor
beam-column
joints
andthe
resttwo
(of
H3)
showed overallbuckling
failure.
This
difference
offailure
patterns
canbe
diTectly
related withthe
given
horjzontal
loading
pTogTams.
Fig.
9
s/hows
the
-50-'
Tabte3
CorfelationofExperlmentedandCalculated
VaLues
ofUltimate
Horizontal
Load
andthe
CalculatedValuesofCoefficients
Hax.Ilori2ontalLoafl
Test'StructuresallpExp・<kg)Cal.<kg>ExprCal(ratio)
Cl-VHIO.33i,oo'315,2289,ql.09
Ci-Wll2o.srJO.TB27?.5'291.qo.grJ
Cl-WT13O,33'[.oe281.3289.0O.9T
cl-wllqO.33t.eo294,O290.21.01
C3-VlltO.35・O.98300.0285,O1.05
C3-Vl)2O.64O,69262,5282.4O.93
C3-Vlt3O,35O.9B26B.7285.q'o.gq
C3-Vll4O.3TO.962B8.5286,e1.01
Table4
Distribution'of
fu.
in
Interster{es
efa
Typical
Test
Structure
Frame
TestStru
¢tufe:Cl-WHI-s
R(xiOcad.)
AtthePeakofCycleNo.
StoryLevet
1(O.'25X)T(2.0X)
4
2.74(1.14)22.84(I.11)
3
3.08(1.28)24.55(1.19)
2
2.35(O.98)23.16(I.12)
1
1.q8(O.61>11.90(O.58)
Average2.4t(1.00)20.61(1.00)
deflected
shape at maximum verticalload.
'
'
The
maximum response valuesfor
verticalload
with respectivehorizontal
diEplacement
and
residualdisplachinent
aretabulated
in
the
rightpart
ofTable
2.
Vertical
load
versushorizontal
displacement
for
allthe
test
structures
are shownin
Fig.
10.
The
highest
or
lowest
verticalload
carrying capacity was observedin
case ofthe
test
structureexperienced
i'n
the
horizonial
loading
of
H
2
or
H
3
program
respectively,The
verticalload
carryi'ng
capacity
and
the
buckl'ipg
mode ofthe
'test'stru'ctures
with
the
expelien'ce of'Hlprogram
were nearlythe
same asthose
of'thetest
Structures
ofH4
program.'
This
showsthat
the
'vertical
load
carrying capacityis
determined
onlyby
the
eve'r
experienced
maximum
amplitude
regardless
of
the
loading
history,
indicating
the
va[idityof
the
equiv'alent
elast-ic
stability
theory
methodproposed
in
Part
1.
With
the
expetience ofthe
stimehorizontal-lotiding
program,
the
ultimate'
'vertical
lpad
carrying
capacity
of
the
test
structures
in
C
1
series'is
alwaysa
little
higher
than
in'the
C
3
serie's.
The
vertidal
load
carrying capacity ofthe
test
structureC
1-WHI
ofthis
study'was ne'arlythe
same asthat
ofC
63-41
H
ofpart
1
whichwas'the
identical
sPecimen.This
maybe
clue
to
the
developmentbf
the
same rotational stiffness underthe
action ofhorizontal
loadihg.'
On
the
otherhand,
the
vertical'lead
carrying capacity ofthe
test
structureC
3-WH
1
ofthis
study shows muchgreater
valuethan
C63-42
H.of
Part
1.
This
maybe
da'e
to
the
gradtial
arrangement ef'
'
stfe'ngth
distributibn
ofthe
beams
overthe
height
offramek
ofthis
study.''
'
'
4.
Discu$sions
i)
Maximurn
Strength
unqerHorizontal
Loading
Table
3
showsthe
comparisonbetween
test
results and calculated valuesfor
the
maximum strength of eighttest
'
structures under
horizontal
loading.
Thes'e
calculated values were obtainedby
assuming simple equilibrium conditien on aframe
asdefined
by
Eq.
(17)
in
Part
1,
Table
3
also showgthe
results of' a. andl9
defined
in
Part
1
for
the
test
structuTes ofthis
study.These
valuesindic.ate
that
allthe
test
structures exceptH2
loading
program
ones'
'
'
t
t
tt
Table5
Correlationef
Experimented
andCalcutated
Ultimate
Vertical
Load
Car[ylng
Capacity
and theValues
of-
'
the
Coefficients
and t'heShape
Function
'
Max,YertiealLead
TestStructuresT
avmExp.(Lon)Cal.(ton)ExpXCal<ratLo)C]-VHIo.snO.T3I.6520.10]9.2q].06
Cl-VH2O.B6O,481.E527,9328.02O.99
Cl-V"3'O.56O.841.6514,4115,qlD.93
[1-VIMO.89o.6eL.6520.9119.T4L.06
C3-WHIO.T9'O.802[251?.80IT.69].o]
C3-Vtt2O,82O.522,SO24.522q.r2le.99
C3-VH3O.35O.93zieLl.41n.6]lo.gs
C3-VH4O,82O,742.30i9.20I7.5511.09
t/
littt...i---t.'Atl'
'''''ltA
'''
/'tttttltt'
//.t-.J.'-'
/6thi PointA!Highestj'HorizontalIoad
PeintA=ItwestHoi ±zcrntallaad T=Pg-C!gNeEQChighest)'
Fig.
1'1
Deterrnination
of'the
VaLue'
ofr
-51-Architectural Institute of Japan
ArchitecturalInstitute of JapanT1.0
O.7o,s
o.
Werwcu1
lt3
O
O・Ol
O・02
O・03
O・04
eav.(rad)
1/3
1av
Fig.12
The
Decrease
ofStrength
underfforizontal
Fig.
13
Determination
efthe
Calculated
Values
ofWcr
Loading
withthe
Increase
ofNumbeT
ofCycles
reach
the
horizontal
strengthof
collapse mechanism(fi
==0.It
canbe
seenfrom
the
table
that
the
measured valuesof
maximum strength under
horizontal
loadings
have
good
agreement with calculated values,It
eanbe
also observedthat
both
the
experirnental and calculated values ofthe
maximum strength underhorizontal
loading
for
the
test
strllctures
in
C1
series area
little
greater
than
for
their
counterparts
in
the
C3
series.
This
mightbe
due
to
the
variationof
the
strength
properties
of
concrete,
relating
to
flexural
strength
at
the
bottom
of
columns.
ii)
Maximum
Strength
under
Vertical
Loading
The
analytical approach madein
Part
1
was rnodified especially onthe
equivqlent
rotational stiffness ofbeam
enCEsby
introducing
the
rotational stiffness recluction ratio7
during
horizontal
loading.
This
modification was madedue
to
the
employment of varioushorizontal
loading
programs
in
this
studypartieularly
by
taking
into
accountthe
effect ofH
3
horizontal
loading
program.
Thus,
equivalent rotational stiffnessbecomes
7.M.,1enma.,
The
value ofr
has
been
defined
as
the
ratioof
the
lowest
to
the
highest
loads
atthe
everexperienced
maximum
arnptitudein
horizonthl
Ioading
history
as shownin
Fig.
11,
Table
4
lists
the
distributions
efa.,.
overthe
height
of aframe
for
atypical
test
structure at
the
peak
ofthe
lst
andthe
7th
cycles ofthe
horizontal
loading
program.
Except
the
lst
storylevel
one,the
values of
e,...
do
not vary withtheir
average valueda..
significantLy allowingto
usethe
average valuetza.,
for
a representativeindex.
Fig.12
shows
the
correlationbetween
the
values ofr
andthe
yalues ofda..
whilch we/reobtained
from
deflected
shape ofFig.7.
This
figure
indicates
how
the
values of7
decrease
withthe
successiveloading
cycles withoutincreasing
the
averagebeam
end rotationth...
Also
in
this
figure
two
lines
areplotted
withthe
data
availablein
case of allthe
test
structures,indicating
the
decrease
of7
withthe
increase
ofda..
in
the
second andin
the
tenth
cycles.Fig,
13
showsthe
deterrnination
ofthe
calculated values ofVVI,.
from
the
intersection
between
the
curve
by
Eq.
(12)
in
Part1
andWL.IWL.-a.
curvefor
eighttest
structures ofthis
study.The
comparisonbetween
measured and calculated valuesfor
the
verticalload
carryingcapacity
of columnsis
listed
in
Table
5.
This
table
also showsthe
values offlexural
rigidity reduction ratio of columnsduring
vertica],loading
(a.),
constant usedfor
the
shapefunction
of columns(m)
as well as rotational stiffness reduction ratio ofbeam
endsduring
horizontal
loading
<7),
It
is
seenthat
there
is
good
agreementbetween
the
calculated and experimented values,of maximurn strength under vertical
loacling.
All
the
test
structures underlimit
statedesign
method showthe
values ofVli}.
alittle
higher
than
those
under currently used elasticdesign
method.Figure
9
in
the
above sectionshows
the
comparisonbetween
the
measuredand
calculateddeflected
shapes at maximum verticalload
in
case
of allthe
test
structures,
which showthe
idientical
eonfiguration
each
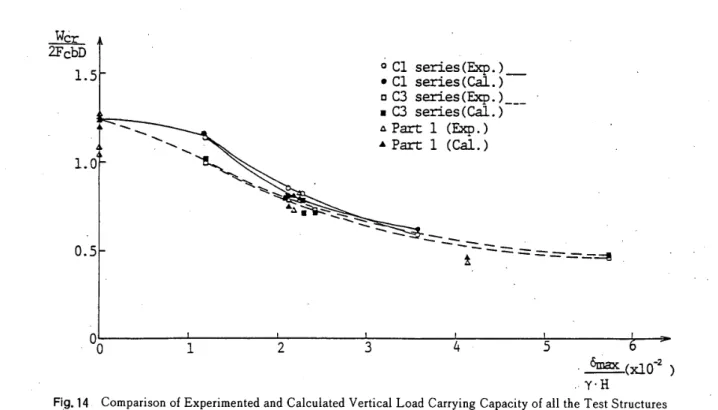
other.Fig.
14
showsthe
experimented and calculated verticalload
earrying capacities of columns asthe
strength ratio-52-wdr2FEit5i5D
1.
L
o.s
es(Exp.)h
es(Cal.)
es(Exp.)
es(Cal.)
(Exp.)
(Cal.)
s------L
.--.-.
---
t
h'=--==e
oo
1
2
3
Fig.
14
Cornparison
ofExperimented
andCalculated
Vertical
Loa
Including
those
in
Part]
4・
5
'
6max
(xioe
)
Y・H
d
Carrying
Capacity
ofallthe
Test
Structures
acrlE =
VliLrf2
Er
bD
versusamaxlr'H
wherea.a.IH
is
the
ever experiencecl maximumdeflection
angle of aframe.
It
is
fovnd
t.hat
a..IF:,decreases
into
the
one' narrow strip asOma.lr.H
increases,
regardless
of
strengthdistribution
of
beams
overthe
height,'
number of stories andprogram
ofhorizontal
loading.
The
trend
of
this
figure
showsthe
necessity ofimposing
sorne
reistrictions onthe
probable
values of maximumdeformation
angleinduced
by
'
earthquakes
or
the
design
level
oflong-term
axialforce
for
columnsin
aseismicdesign
ofbtrildirigs,
It
has
been
generally
recognizedthat
the
higher
seisrnic strength abuilding
has,
the
sinallerthe
maximumdeformation
angleinduced
by
earthquakebecomes.,
If
sufficientseismic
strength
is
provided
withhffective
seismic elements;such
as shear wallsfor
abuilding,
the
maxirnumdeformation
angle willbe
small, maybe
within1.
0
×10'Z
rad. evenduring
extreme earthquakes.In
this
casethere
occur noseFious
problems
on
the
verticalload
carrying capacity of columns after earthquakesjudging
from
the
figu;e
14.
0n
the
otherhand
if
a
building
consists
of onlyframe
systems which areexpected
to
have
much capability ofdeformation
with relativelylow
strength,
the
maximumdeformatio4
angle may reach2
×10'!rad.
or moreduring
major or extremeearthquakes,
In
this
case
strong restrictions are needfor
the
'
design
level
of
long-term
axial
force
for
columns atthe
stage of aseismicdesign
ofbuilclings,
for
instance,
about115th
'
to
116th
ofLbD
to
securethe
safety
factor
of
3
on
the
premise
ofthe
eontinued serviceability ofbuildings
after major or extreme earthquakes.Based
onthe
findings
at
this
stage
the
following
approach maybe
suggested.The
maximumdeformation
anglesinduced
by
earthquakes
maybe
estimated
by
the
proposed
methods, one of which was reportedin
Ref.
3,
derived
from
the
dynamic
analysis resultson
single
degree
of
freeclom
systems.Using
these
methods andtaking
into
accountthe
tre'nd
ofFig.
12,
the
way ofdetermining
the
design
level
o
£long
term
axialload
of columnsfrom
the
trend
ofFig.
14
willbe
established although-more experimental results shouldbe
addedfor
makingthe
final
'
'
conclusions.
'
'
5.
Conclusions
The
following
statembnts canbe
madefrom
the
study.1)
Experimental
works were conducted on eightIAoth
scaled
plane
frame
strudtures
of
single-bay, multistdry reinforced concrete weakbeath-strong
column
type
to
study
the
effectof
the
different
patterns
of reversgdhorizontal
loading
onthe
verticalload
carrying capacityof
col,ulnns.
Four
different
patterns
ofhorizontal'loading
program,
characterizedby
maximumdeflection
angle, number ofloading
cycles
and
the
history
of applied amptitude were employed.'
2)
For
the
response・analysisunder
vertical
loading,
the
characteristics ofthe
degradation
of stiffness offrames
'
obtained
under
horizontal
loadipg
were
applied
into
the
theoretical
appraach.presentedin
Part
1.
It
was
found
that
-53-Architectural Institute of Japan
Arohiteotural エnstitute of Japan
this
modified
methodgives
good
predictions
of
the
ve 【tical
load
carryi11g capacity ofthe
columns of multistoryplane
frame
structuresQf
weakbeam
・
strong columntype
even wlththe
experience ofdifferent
types
ofhorizontal
loading
,
3
)
It
wasfound
from
all
the
test
results offrames
including
those
ofPart
l
that
the
reduced values ofthe
verticalload
carrying
capacity
can
be
closely
relatedwith
the
ever
experienced
maximumdeflection
angledivided
by
the
stiffness
degradation
ratio
underhorizontal
loading
,
regardless of sttengthdist
τibution
ofbeams
overthe
heigh
電,
number of stories and
program
ofhoizontal
loading
.
【t
wasalso
found
that
the
proposed
limit
state
design
method
gives
higher
valuesof
safety
factor
againstgravity
load
for
multistoryframes
withthe
experience ofh
(〕rizontalloading
than
the
currently
used elasticdesign
method.
4
)
Further
studies
a
【e
requiredto
get
general
conclusions
aboutthe
stability
of continuous coLumlls of weakbeam−
strong colu 皿ntype
offrames
regardingthe
aseismicdesign
ofbuildings
.
6.
Acknowledgements
T
揃sstudyhas
been
conducted atthe
Structural
Engineering
Depart
皿ent ofthe
University
ofHiroshiIna
.
The
authors would
like
to
thank
H ,
Araki,
research associate ofthe
Earthquake
Engineering
Laboratory
.
The
authors acknowledgethe
cooperationof
H .
Ohtani
andY .
Kakita
,graduates
.
Reterences
D
Shimazu
,
T .
andMohit
,
S.
M .
P.
:“
The
Vertical
Load
Carryng
Capacity
efthe
Colu
皿ns ofMultistory
Reinforced
Concrete
Frames
wi 山 出eExperience
ofHorizontal
Load
五ng”
,
Jo
腫mal ofStructural
a皿d
Construction
Engineering
(
Transaction
ofAIJ
)
No
.
360
,
February
,
1986
,
pp
.
119
−
131
.
2
)
MoHick
,
M
.
A
.
A
.
,
Shimazu
,