Author(s)
Tokuyama, Takenobu; Shy, Jhy-Yun; Lin, Hui-Chen; Henmi,
Yasuhisa; Mather, Peter; Hughes, Jane; Tsuchiya, Makoto;
Imai, Hideyuki
Citation
Crustacean Research, 49: 141-153
Issue Date
2020-09-03
URL
http://hdl.handle.net/20.500.12000/46908
Genetic population structure of the fiddler crab Austruca lactea (De Haan,
1835) based on mitochondrial DNA control region sequences
Takenobu Tokuyama, Jhy-Yun Shy, Hui-Chen Lin, Yasuhisa Henmi, Peter Mather, Jane Hughes, Makoto Tsuchiya, Hideyuki Imai
Abstract.̶ The fiddler crab, Austruca lactea inhabits tidal flat areas and is widely
distributed across Japan, the Korean Peninsula, China, Taiwan and northern Vietnam. Fiddler crab habitat is being lost rapidly due to human impacts and this species is cur-rently listed as endangered in Japan. We studied the population genetic structure of A. lactea using mitochondrial DNA control region markers to define management units. A. lactea individuals were sampled from Osaka, Hiroshima and Kumamoto in Japan, and from Taichung and the Penghu Islands in Taiwan. All local samples exhibited high levels of genetic diversity, and no sampled populations showed evidence for a significant decline in effective population size that can result from population bottle-neck effects. Pairwise FST estimates distinguished three discrete A. lactea populations corresponding with, the Seto Inland Sea (Osaka and Hiroshima), Kyushu (Kumamoto) and Taiwan. The three populations showed clear differences in historical population expansion times and their population dynamics after expansion. Results of the study indicate that A. lactea dispersal is limited geographically and that high levels of ge-netic diversity are maintained both within and among populations.
Key words: genetic structure, gene flow, mitochondrial control region, fiddler crab
■ Introduction
The fiddler crab, Austruca lactea (De Haan, 1835) has a natural distribution that includes Japan, Taiwan, the Korean Peninsula, China and northern Vietnam (Crane, 1975; Shih et al., 2009; Shih, 2013). In Japan, A. lactea is found in tidal flats on the islands of Honshu, Shikoku and Kyushu (Sakai, 1976; Yamaguchi, 1978). Natural habitat in estuarine tidal flats has been significantly reduced in recent times as a result of anthropogenic shore protection measures and reclamation work. As a consequence, local fiddler crab population sizes have been declin-ing, and the species has been listed as endan-gered (II; Vulnerable) in the Threatened Wild-life of Japan, Red data book (Takeda, 2006). In the latter half of the 20th century, the rate of
loss of tidal areas in Japan reached 40% (Hana-wa, 2006), with Osaka experiencing the highest rate of loss (90%). This remarkable reduction in wild habitat potentially threatens persistence of fiddler crab populations. Clarifying A. lactea genetic population structure in Japan will assist with understanding and conserving this species over the longer term.
The magnitude of larval dispersal in inverte-brates can impact their natural genetic struc-tures significantly (McConaugha, 1992). Adults of most decapods do not disperse over large geographical distances, rather dispersal and gene flow are often determined by planktonic larval stages. As a consequence, their relative dispersal ability is strongly linked to the dura-tion of each species larval phase (Scheitema, 1975; Grantham et al., 2003). Larval stage
du-ration in fiddler crabs has been hypothesised to last from three to four weeks (Hyman, 1920; Otani, 1993). In decapods where the length of larval duration has been confirmed experimen-tally, e.g., the swimming crab, Portunus tritu-berculatus, the first stage after hatching was observed to range from 14 (26°C) to 27 (20°C) days in the laboratory (Hamasaki, 1996). Dis-persal distances of P. trituberculatus and the acorn barnacle Balanus glandula, another crus-tacean species with a similar larval phase dura-tion, were estimated to be 47 km and 85 km, respectively (Shiota & Kitada, 1992; Schwindt, 2007). Based on these estimates, dispersal abil-ity and genetic population structures of fiddler crab has been assumed to be similar to that of P. trituberculatus and B. glandula.
It is also important to recognise that plank-tonic larvae do not necessarily disperse over the entire larval period (Todd, 1998) so the ex-tent of natural genetic differentiation among discrete populations of marine organisms can be significantly impacted by the relative philopatry of their larvae (Shanks, 2009). In particular, many estuarine organisms, including fiddler crabs, employ a larval retention strategy (Bilton et al., 2002). Wild capture of fiddler crab larvae (A. lactea and Tubuca arcuata) and simulation studies of their dispersal has dem-onstrated that larvae remain close to their local estuaries after hatching (Uno & Nakano, 2002). Based on these observations, it is quite possible that A. lactea could show significant popula-tion structuring even over fine spatial scales across the natural distribution.
In earlier studies of genetic population struc-ture of A. lactea that employed a mtDNA con-trol region marker (Kitamura et al., 2005) and in P. trituberculatus using RFLP analysis of the whole mtDNA molecule (Imai et al., 1999), micro-scale genetic heterogeneity was ob-served between local samples in Seto Inland Sea populations. In contrast, a study of T. arcu-ata using RFLP analysis of mtDNA control re-gion showed no significant genetic
differentia-tion among localities in mainland Japan and Taiwan apart from Okinawa-jima Island (Aoki et al., 2008a). In a study that examined mtDNA CO1 region sequence variation in the mudflat crab, Chiromantes dehaani and the horned ghost crab Ocypode ceratophthalma, both of which live in the supratidal zone, no significant population structure was evident between Seto Inland Sea and Kyushu Island populations (Kawane et al., 2008). Thus, the extent of wild population structure can vary significantly among inter-tidal decapod species.
Imai & Numachi (2002) and Chu et al. (2003) showed that mitochondrial DNA control region of crustacea is useful for detecting and evaluat-ing intraspecific diversity. Here we conducted a genetic analysis of the fiddler crab, A. lactea, after designing new primers to amplify a se-quence of the mtDNA control region. The study aims to document natural population ge-netic structure in this species in Japan and Tai-wan and to identify wild management units (MUs), where they are present. In addition, we estimated population dynamics following pop-ulation expansion and clarified whether popu-lation bottlenecks may have occurred due to modern declines in available habitat due to hu-man impacts.
■ Materials and Methods
Sampling and DNA extraction
Two hundred and fifty-nine specimens of A. lactea were collected from three localities in Japan and two localities in Taiwan (Table 1; Fig. 1). Sampling month and year for each sampled locality, respectively were as follows; Osaka in Sep. 2015, Hiroshima in Oct. 2015, Kumamoto in Dec. 2014, Taichung in Mar. 2014, Penghu in Nov. 2014. Captured adult in-dividuals were preserved in 70% ethanol and stored at 4℃. Muscle tissue was later excised from either the abdomen or legs and samples stored in 0.5 mL of TNES-8M urea buffer (Asahida et al., 1996). DNA was extracted
us-ing an SDS-phenol-chloroform method with diethyl ether (Imai et al., 2004) and DNA sam-ples were stored in Tris-EDTA buffer prior to genetic analysis.
Genetic marker design and PCR amplification
New conserved mtDNA control region prim-ers were designed based on complete mtDNA sequences available for spiny lobster, Panuli-rus japonicus (AB071201; Yamauchi et al., 2002), and swimming crab, P. trituberculatus (AB093006; Yamauchi et al., 2003). The new primer sequences were as follows; Uca-12s-F1 (5′-TTAAGTTTAACCGCAGATGCT-3′) and Uca-tRNA-R1 (5′-ACCCTTTTAAATCAG
GCACTAT-3′). PCR amplification was per-formed with 35 cycles in a 25-μL reaction mix-ture in an Astec PC-320 (Astec Co., Ltd., Tokyo, Japan) thermal cycler. The reaction mixture contained 12.5 μL of Emerald Amp PCR Master Mix (Takara Bio Inc., Otsu, Ja-pan), 1.0 μL of template DNA, 1.0 μL of each primer, and 9.5 μL of distilled water. Amplifi-cation included an initial denaturation step at 94℃ for 2 minutes, followed by 35 cycles (de-naturation at 94℃ for 30 seconds, annealing at 59℃ for 30 seconds, and extension at 72℃ for 1 minute), and a final extension at 72℃ for 3 minutes. Electrophoresis was carried out in a 1% Agarose S gel (Wako Pure Chemical Indus-tries, Ltd., Osaka, Japan). After electrophoresis, gels were stained with ethidium bromide and products checked on a transilluminator (Ad-vance Scientific Products Pty Ltd., Queensland, Australia).
Sequencing and population analysis
All PCR products were purified and se-quenced at Macrogen Japan Corp. (Kyoto, Ja-pan) using an Applied Biosystems 3730xl DNA analyser (Foster City, CA). Nucleotide sequence data were aligned with MEGA 5.05 (Tamura et al., 2011) and unique haplotypes confirmed. A haplotype tree was constructed using the neighbour-joining method (Saitou & Nei, 1987) based on the number of nucleotide substitutions per site. A bootstrap analysis was carried out with 1,000 replicates to determine the robustness of the tree (Felsenstein, 1985).
Table 1. Sampling localities, numbers of samples and genetic diversity indices for the fiddler crab Austruca lactea. n: number of individuals. Nh: number of haplotypes. Number in parentheses mean number of unique haplotypes in each locality. h: haplotype diversity; π: nucleotide diversity.
Localities n Nh (unique) h±SD π±SD (%)
Sennan, Osaka, Japan 52 48 (45) 0.995±0.006 1.46±0.75
Matsunaga Bay, Hiroshima, Japan 53 50 (46) 0.998±0.004 1.33±0.68
Nagaura Island, Kumamoto, Japan 50 50 (49) 1.000±0.004 1.69±0.86
Taichung, Taiwan 54 54 (53) 1.000±0.004 2.46±1.23
Penghu Island, Taiwan 50 50 (49) 1.000±0.004 2.71±1.34
Total 259 247 (242)
Fig. 1. Sampling sites and sample size (n) for Austruca
lactea. The black arrow means the route of Kuroshio Current.
This map data was designed on GMT (http://gmt.soest.hawaii. edu/projects/gmt).
Evolutionary distances were calculated using a maximum composite likelihood approach (Tamura et al., 2004).
Analysis of molecular variance (AMOVA) (Excoffier et al., 1992) was undertaken in Arle-quin ver. 3.5.2.1 (Excoffier & Lischer, 2010) based on the number of samples, the number of haplotypes and the number of nucleotide sub-stitutions per site. Genetic parameters, includ-ing haplotype diversity (h; Nei, 1987) and nu-cleotide diversity (π; Tajima, 1983), were estimated. Statistical tests for neutrality, Ta-jima s D test (TaTa-jima, 1983) and Fu s FS test (Fu, 1997), were conducted. Effective popula-tion size Nef was stimated based on the formu-lae θ=2Nefν (Watterson, 1975), ν=mμ (m: the sequence length, μ: the mutation rate) and μ= 19% (per Myr) from a previous study of the penaeid shrimp, Farfantepenaeus aztecus (McMillen-Jackson & Bert, 2003).
Pairwise FST estimates (Reynolds et al., 1983) were calculated to estimate genetic dif-ferentiation among populations. Estimates of number of migrants between localities per gen-eration (Nem) were calculated based on the for-mula Nem=[1/FST−1]/4 (Hudson et al., 1992). Population dynamics at each sampled locality were generated via mismatch distribution anal-ysis based on pairwise differences between se-quences. To estimate population expansions, time since population expansion τ and popula-tion size θ were calculated before and after ex-pansion. Absolute time T (years) since popula-tion expansion was calculated based on the formula T=τ/2u and u=2 μk (k: sequence length) (Rogers & Harpending, 1992; Harpend-ing, 1994). A haplotype network was construct-ed using PopART (Leigh and Bryant, 2015) applying a median-joining method.
■ Results
Genetic diversity
After alignment and sequence trimming, 816 bp of nucleotide sequence from the
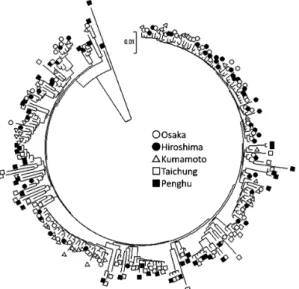
mtDNA control region was used in all analy-ses. 281 variable sites were identified that de-fined 247 unique haplotypes. Nucleotide se-quences of all haplotypes were deposited in the DNA Databank of Japan (DDBJ) under acces-sion numbers LC472550-LC472808. Five hap-lotypes were shared among multiple locations, while all other haplotypes were unique to indi-vidual localities (Table 1). Of the five shared haplotypes, one was found in Penghu and Taic-hung, one in Kumamoto and Hiroshima, and the others in Osaka and Hiroshima. In the hap-lotype tree, no population formed an isolated clade (Fig. 2). Results of the haplotype network show that all populations were represented widely across the network. Certain haplotypes identified in the Penghu Islands were more di-vergent from remaining haplotypes than the average (Fig. 3). Haplotype diversity (h) and nucleotide diversity (π) for each population are presented in Table 1. Haplotype diversity indi-ces were very high at all localities. Nucleotide diversity indices for the Taichung and Penghu sites were higher than for other localities. Re-sults of Tajima s D test and Fu s FS test were both negative at all sites and P-values for Fu s
Fig. 2. A. lactea haplotype tree constructed using the neighbour-joining method.
FS test were zero at all locations (Table 2). Ef-fective population size estimates, Nef, are shown in Table 2. Effective population sizes at the Taichung and Penghu localities were slight-ly larger than at the other three localities.
Genetic population structure
Mean FST estimate among localities obtained from the AMOVA was 0.06298, suggesting presence of integrated population structure (P<0.05). Pairwise FST estimation between Osaka and Hiroshima and between Taichung
Table 2. Effective female population size (Nef) and neutrality test values for the localities of Austruca lactea sampling.
Localities Nef Tajima s D Tajima s D p-value Fs Fs p-value
Osaka 62803.6 −1.670 0.022 −24.462 0
Hiroshima 60405.5 −1.744 0.016 −24.559 0
Kumamoto 70558.8 −1.567 0.022 −24.353 0
Taichung 115356.8 −1.827 0.010 −24.148 0
Penghu 130317.8 −1.862 0.009 −24.142 0
Fig. 3. A. lactea haplotype network generated using a median-joining method with PopART software. Sizes of circles are proportional to the frequency of each unique haplotype, while lengths of lines indicate the number of mutations between haplotypes.
and Penghu were negative indicating essential genetic homogeneity (Table 3). Other compari-sons of pairs of localities showed positive FST values and all were significant (P<0.05). The P-value for the FST estimate between the Osaka and Hiroshima localities was the largest detect-ed (0.93694±0.0310). Mismatch distribution
plots for the Taichung and Penghu localities showed a single peak while plots for the Osaka and Hiro shima localities showed two peaks (Fig. 4). Osaka and Hiroshima samples will hereafter be referred to as the Seto Inland Sea population, the Kumamoto samples as western Kyushu population, and the Taichung and
Pen-Fig. 4. Mismatch distribution based on A. lactea mtDNA control region. Bars represent observed frequency of pairwise differences among unique haplotypes, and the line shows the expected curve predicted for a population that has undergone range expansion in the past.
Table 3. Pairwise FST (below the diagonal) and pairwise FST P values (above the diagonal) for between-localities of Austruca lactea.
Localities Osaka Hiroshima Kumamoto Taichung Penghu
Osaka 0.9369±0.0310 0.0090±0.0091* 0.0000±0.0000* 0.0000±0.0000*
Hiroshima −0.0081 0.0000±0.0000* 0.0000±0.0000* 0.0000±0.0000*
Kumamoto 0.0351 0.0428 0.0000±0.0000* 0.0000±0.0000*
Taichung 0.1021 0.1030 0.0645 0.5135±0.0360
Penghu 0.0998 0.1027 0.0572 −0.0001
*: Significant P-values (Bonferroni correction, P<0.05). The error values are shown±standard deviation.
Table 4. Nem values (below the diagonal) between localities of Austruca lactea and direct geographical distances (km) between
localities measured using Google Maps (https://maps.google.co.jp) (above the diagonal). If the FST value between localities was
negative, Nem was not calculated, and is showed with a hyphen.
Localities Osaka Hiroshima Kumamoto Taichung Penghu
Osaka 180 490 1820 1930
Hiroshima ̶ 340 1680 1790
Kumamoto 6.87 5.59 1350 1450
Taichung 2.20 2.18 3.63 110
ghu samples as the Taiwanese population, re-spectively. τ values decreased in the order Tai-wan>western Kyushu>Seto Inland Sea (Table 5). θ1 values were higher than the θ0 val-ues at all localities.
■ Discussion
Significant differentiation between localities
Results of genetic diversity estimates, pair-wise FST estimates and mismatch distribution analysis in combination indicate essential ge-netic homogeneity between the two Japanese (Osaka–Hiroshima) and between the two Taiwa nese (Taichung–Penghu) localities. Aside from these pairs, all other comparisons be-tween localities indicate significant population differentiation. Thus, across the geographical scale of sampling in this study, A. lactea can be categorised into three populations that corre-spond geographically with a Seto Inland Sea population, a western Kyushu population and a Taiwanese population. At the same time in the phylogenetic analysis, the three populations formed a single monophyletic clade (Fig. 2 & Fig. 3), so accordingly, they can best be defined as MUs for short-term conservation purposes (Moritz, 1994).
The pattern of population structuring ob-served here for A. lactea here however, does not conform with patterns reported in earlier phylogeographic studies of a number of semi-terrestrial crabs, T. arcuata, O. ceratophthalma
and C. dehaani (Aoki et al., 2008b; Kawane et al., 2008) across the same region. T. arcuata showed essential genetic homogeneity across the largest geographical scale sampled i.e. be-tween Japan and Taiwan, and very little genetic differentiation between the Seto Inland Sea and western Kyushu regions was observed in the latter two species. While these comparisons may appear to provide conflicting patterns, di-rect comparisons among these species may not be simple. Aoki et al. (2008b) used only an RFLP approach which targets only a limited number of mutational sites, while Kawane et al. (2008) employed sequencing of a large fragment of the whole mitochondrial DNA COI region. In the current study we also se-quenced a large fragment of the complete mito-chondrial control region and so were able to examine the extent of genetic differentiation among sites in greater detail.
In the current study, the western Kyushu population was genetically differentiated from the other two Japanese populations sampled. An earlier study of T. arcuata by Aoki et al. (2008b) also reported genetic differentiation between the Seto Inland Sea and Kyushu gions for this species even though the two re-gions are geographically close. This pattern potentially results from historical geological conformation of the coastline of western Kyu-shu. Complex coastal geological structure may have restricted gene flow between T. arcuata populations in the two regions.
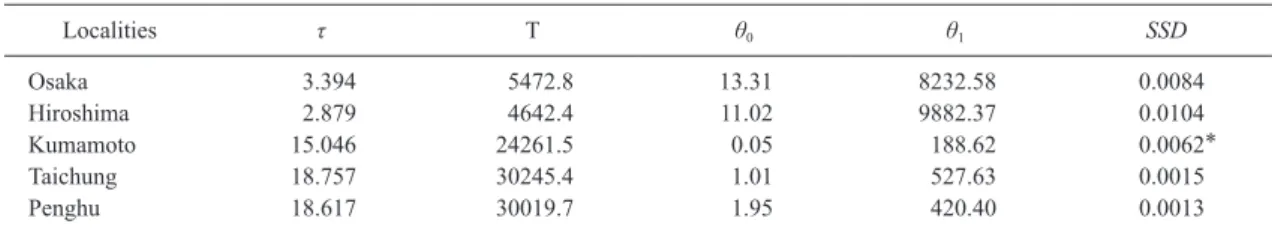
Table 5. Results of the mismatch distribution analysis for Austruca lactea. The absolute time after expansion (T) was calculated based on τ. Localities τ T θ0 θ1 SSD Osaka 3.394 5472.8 13.31 8232.58 0.0084 Hiroshima 2.879 4642.4 11.02 9882.37 0.0104 Kumamoto 15.046 24261.5 0.05 188.62 0.0062* Taichung 18.757 30245.4 1.01 527.63 0.0015 Penghu 18.617 30019.7 1.95 420.40 0.0013
τ: Time since expansion. T: absolute time (years) since expansion. θ0: population size before expansion. θ1: population size after expansion. SSD: sum of square deviations from the sudden expansion model.
The Kuroshio Current flows from the east side of Taiwan along the southern coast of Kyu shu to the southern coast of Shikoku Is-land. In addition, a component of the Kuroshio Current flows through the East China Sea fac-ing western Kyushu (Fig. 1). While the current is sufficiently powerful to potentially impact larval gene flow in some marine organisms (Kawabe, 1986; Sugimoto & Kobayashi, 1988; Tomita et al., 2016; Abdullah et al., 2017; Hamasaki et al., 2017), it has also been dem-onstrated to act as a potential genetic barrier to dispersal in other marine species (Aoki et al., 2008a; Iwamoto et al., 2012; Imai et al., 2013; Yamakawa & Imai, 2014; Iwamoto et al., 2015). Results here at least suggest that the Kuroshio Current potentially limits larval dis-persal by fiddler crabs between the Seto Inland Sea and Kyushu regions. An earlier experimen-tal study showed that planktonic larvae of the fiddler crab have a relatively short time to achieve pelagic larval dispersal (Otani, 1993). After this period, zoea larvae cannot metamor-phose to the megalopa stage and will die. Be-cause of this time limit and the apparent larval retention strategy (Bilton et al., 2002), fiddler crabs are unlikely to use the Kuroshio Current effectively to disperse between the Seto Inland Sea and Kyushu regions.
Population dynamics and expansion times
All sampled localities showed significant negative values in Tajima s D and Fu s FS tests (P<0.05) (Table 2). For the Mismatch distri-bution analysis, all localities also showed rela-tively low SDD values and a fit to the sudden expansion model (Table 5). These, data suggest that all modern populations are expanding.
Heterogeneous mismatch distributions were observed among three populations (the Seto Inland Sea, Kyushu and Taiwan) (Fig. 4), indi-cating that differences between Japan and Tai-wan were substantial. The mismatch distribu-tion analysis also provided estimated population expansion times for the five
sam-pled localities. Reconstructions of sea level changes across the late Pleistocene, approxi-mately 20,000 years ago suggest that the is-lands of Honshu, Shikoku and Kyushu were connected physically and at this time when sea levels were much lower than at present, the Seto Inland Sea did not exist (Maeda, 1976, 1980). Approximately 10,000 years ago after sea levels had risen, seawater began to flow into the area of the modern Seto Inland Sea from the Pacific Ocean and sea levels reached their present status approximately 6,000 to 7,000 years ago. Molecular results in the cur-rent study do not conflict with this inferred geological history of the region with T-values for the Osaka population suggesting that this population expanded earlier (estimated at 1,000 years before) before the Hiroshima population . Based on this timing hypothesis, we can infer that A. lactea likely colonised and expanded from the south to form populations after the Seto Inland Sea level had stabilised. The mis-match distribution analysis results for the O saka and Hiroshima population showed two peaks (Fig. 4). A number of hypotheses were considered for this pattern. The first hypothesis is that A. lactea may have invaded the Seto In-land Sea two times. Another is that historical population drastically declined in size at cer-tain times in the past. We can evaluate and compare these competing hypotheses with the dynamics of A. lactea from eastern Kyushu and Shikoku Island.
Taiwan and Penghu Island are believed to have been connected physically and located on the edge of the Eurasian Continent during the late Pleistocene (estimated at 90,000 to 10,000 years ago) (Ujiie, 1990; Oshiro & Nohara, 2000). Considering the reported geological his-tory for this region and the T-values estimated in this study, the coastal environment (i.e. sea levels and/ seawater temperatures) in the Tai-wan region probably stabilised approximately 30,000 years ago, a time during which A. lac-tea populations likely expanded. Following
historical population expansions, sea surface elevation across the Holocene separated Peng-hu from Taiwan approximately 4,700 years ago (Chen & Liu, 1996). The mismatch distribution analysis results suggest however, that A. lactea populations did not decline significantly at this time (Fig. 4). They indicate that A. lactea gene flow was ongoing between Taiwan and Penghu after insularisation of the Penghu Islands, so this event probably did not significantly affect A. lactea population dynamics.
■ Conclusions
A. lactea populations in Japan and Taiwan are genetically differentiated into three discrete population groupings as follows; Seto Inland Sea, western Kyushu and Taiwan populations. Results of the current study, suggest that mod-ern A. lactea populations do not utilise the Kuro shio Current for effective larval dispersal. This in-shore marine crab species has a rela-tively low larval dispersal capacity resulting from possessing a relatively short pelagic lar-val phase. Results here confirm a need to estab-lish MUs for each of the three identified differ-entiated modern population areas and to develop conservation strategies for each of these populations.
■ Acknowledgements
We are grateful to Dr. Jyuan-Ru Tsai of Tunghai University, many students from Prof. J.Y. Shy s Laboratory, N.P.U. and Mr. Kenzo Nishino of Port of Hannan Division, Osaka Prefectural Government for their kind help in collecting specimens. This research was sup-ported financially by the JSPS Program for Ad-vancing Strategic International Networks to Accelerate the Circulation of Talented Re-searchers and the JSPS KAKENHI (Grant-in-Aid for Scientific Research C) JP17K07918.
■ Literature Cited
Abdullah, M. F., Cheng, J. H., Chen, T. I., & Imai, H., 2017. Development of compound polymorphic microsatellite markers for the pronghorn spiny lobster Panulirus penicilla-tus and comparison of microsatellite data with those of a previous mitochondrial DNA study performed in the northwestern Pacific. Biogeography, 19: 137–145.
Aoki, M., Imai, H., Naruse, T. & Ikeda, Y., 2008a. Low genetic diversity of Oval Squid, Sepioteuthis cf. lessoniana (Cephalopoda: Loliginidae), in Japanese waters inferred from a mitochondrial DNA non-coding re-gion. Pacific Science, 62: 403–411.
Aoki, M., Naruse, T., Cheng, J. H., Suzuki, Y. & Imai. H., 2008b. Low genetic variability in an endangered population of fiddler crab Uca arcuata on Okinawajima Island: analy-sis of mitochondrial DNA. Fisheries Sci-ence, 74: 330–340.
Asahida T., Kobayashi T., Saitoh K. & Nakayama I., 1996. Tissue preservation and total DNA extraction from fish stored at ambient tem-perature using buffers containing high con-centration of urea. Fisheries Science, 62: 727–730.
Beerli, P., 2006. Comparison of Bayesian and maximum likelihood inference of population genetic parameters. Bioinformatics, 22: 341–345.
Beerli, P., 2009. How to use MIGRATE or why are Markov chain Monte Carlo programs difficult to use? In: G. Bertorelle, M. W. Bruford, H. C. Hauffe, A. Rizzoli & C. Vernesi, (eds), Population Genetics for Ani-mal Conservation, Cambridge University Press, Cambridge, pp. 42–79.
Bilton, D. T., Paula, J. & Bishop, J. D. D., 2002. Dispersal, genetic differentiation and specia-tion in estuarine organisms. Estuarine, Coastal and Shelf Science, 55: 937–952. Chen, Y. G. & Liu, T. K., 1996. Sea level changes
in the last several thousand years, Penghu Islands, Taiwan Strait. Quaternary Research,
45: 254–262.
Chu, K. H., Li, C. P., Yam, Y. K. & Lavery, S., 2003. Application of mitochondrial control region in population genetic structure of the shrimps Penaeus. Molecular Ecology Re-sources, 3: 120–122.
Crane, J., 1975. Fiddler crabs of the world. Ocy-podidae: Genus Uca, Princeton University Press, New Jersey.
Excoffier, L., Smouse, P. E. & Quattro, J. M., 1992. Analysis of molecular variance in-ferred from metric distance among DNA haplotype application to human mitochon-drial DNA restriction data. Genetics, 131: 479–491.
Excoffier, L. & Lischer, H. L., 2010. Arlequin suite ver. 3.5: a new series of programs to perform population genetics analyses under Linux and Windows. Molecular Ecology Resources, 10: 564–567.
Felsenstein, J., 1985. Confidence limits on phy-logenies: An approach using the bootstrap. Evolution, 39: 783–791.
Fu, Y. X., 1997. Statistical tests of neutrality of mutation against population growth, hitch-hiking and background selection. Genetics, 147: 915–925.
Grantham, B. A., Eckert, G. L. & Shanks, A. L., 2003. Dispersal potential of marine inverte-brates in diverse habitats. Ecological Appli-cations: 13, Supplement: The science of ma-rine reserves, S108-S116.
Guan, B. X., 1994. Patterns and structures of the currents in Bohai, Huanghai and East China Seas. Oceanology of China Seas, 1: 17–26. Guo, X., Futamura, A. & Takeoka, H., 2004.
Re-sidual currents in a semi-enclosed bay of the Seto Inland Sea, Japan. Journal of Geophysi-cal Research, 109: 1–23.
Hamasaki, K., 1996. Study on the reproduction and development of the swimming crab, Portunus trutuberculatus. Special Research Report, Volume 8. Japan Sea-Farming Asso-ciation, Tokyo, 124p. (in Japanese)
Hamasaki, K., Iizuka, C., Sanda, T., Imai, H. & Kitada, S., 2017. Phylogeny and
phylogeog-raphy of the land hermit crab Coenobita purpureus (Decapoda: Anomura: Coenobiti-dae) in the Northwestern Pacific Region. Marine Ecology, 38: e12369.
Hanawa, S., 2006. Present situation and future of tidal flats in Japan. Chikyu Kankyo, 11: 235–244. (in Japanese)
Harpending, H. C., 1994. Signature of ancient population growth in a low-resolution mito-chondrial DNA mismatch distribution. Hu-man Biology, 66: 591–600.
Hudson, R. R., Slatkin, M. & Maddison W. P., 1992. Estimation of levels of gene flow from DNA sequence data. Genetics, 132: 583– 589.
Hyman, O. W., 1920. The development of Gelasi-mus after hatching. Journal of Morphology, 33: 485–501.
Imai, H. & Numachi, K., 2002. Genetic variabili-ty of swimming crab based on PCR-RFLP analysis of mitochondrial DNA D-loop re-gion. Suisanzoshoku, 50: 1–7. (in Japanese with English abstract)
Imai, H., Fujii, Y., Karakawa, J., Yamamoto, S. & Numachi, K., 1999. Analysis of the popula-tion structure of the swimming crab, Portu-nus trituberculatus in the coastal waters of Okayama Prefecture, by RFLPs in the whole region of mitochondrial DNA. Fisheries Sci-ence, 65: 655–656.
Imai, H., Cheng, J. H., Hamasaki, K. & Numachi, K. I., 2004. Identification of four mud crab species (genus Scylla) using ITS-1 and 16S rDNA markers. Aquatic Living Resources, 17: 31–34.
Imai, H., Hanamura, Y. & Cheng, J., 2013. Ge-netic and morphological differentiation in the Sakura shrimp (Sergia lucens) between Japanese and Taiwanese populations. Con-tributions to Zoology, 82: 123–130.
Iwamoto, K., Chang, C. W., Takemura, A. & Imai, H., 2012. Genetically structured popu-lation and demographic history of the gold-lined spinefoot Siganus guttatus in the northwestern Pacific. Fisheries Science, 78: 249–257.
Iwamoto, K., Abdullah, M. F., Chang, C. W., Yo shino, T. & Imai, H., 2015. Genetic isolation of the mottled spinefoot Siganus fuscescens Ryukyu Archipelago population. Biogeogra-phy, 17: 61–85.
Kawabe, M., 1986. Study on the Kuroshio and the Tsushima Current. Journal of Oceanog-raphy, 42: 319–332.
Kawane, M., Wada, K. & Watanabe, K., 2008. Comparisons of genetic population structure in four intertidal brachyuran species of con-trasting habitat characteristics. Marine Biol-ogy, 156: 193–203.
Kitamura, T., Nitta, A., Oda, T. & Wakao, H., 2005. Population structure in mitochondrial DNA of fiddler crab. In: Japanese Society for DNA polymorphism Research, (ed.), DNA Polymorphism, 13, Toyoshoten, To-kyo, 140–144. (in Japanese)
Leigh, J. W. & Bryant, D., 2015. PopART: Full-feature software for haplotype network con-struction. Methods Ecology Evolution, 6: 1110–1116.
Maeda, Y., 1976. The sea level changes of Osaka Bay from 12000 BP to 6000 BP. Environ-mental changes in the Osaka Bay area dur-ing the Holocene, Part I. Journal of Geosci-ences, Osaka City University, (20): 43–58. Maeda, Y., 1980. Holocene transgression in
Osa-ka Bay and Harima Nada. Umi to Sora (Sea and Sky), 56: 145–150. (in Japanese with English abstract)
McConaugha, J. R., 1992. Decapod larvae: dis-persal, mortality, and ecology. A working hypothesis. American Zoology, 32: 512– 523.
McMillen-Jackson, A. L. & Bert, T. M., 2003. Disparate patterns of population genetic structure and population history in two sym-patric penaeid shrimp species (Farfante-penaeus aztecus and Lito(Farfante-penaeus setiferus) in the eastern United States. Molecular Ecology, 12: 2895–2905.
Motoh, H, de la Pena, D., Dimaano, M. & Tam-pos, E., 1978. Preliminary report on the first production of the crab stages of alomasag,
Portunus pelagicus (Linnaeus). Aquaculture Department, Southeast Asian Fisheries De-velopment Center, Iloilo. 21pp.
Moritz, C., 1994. Defining evolutionarily signifi-cant units for conservation. Trends in Ecol-ogy and Evolution, 9: 373–375.
Nei, M., 1987. Molecular evolutionary genetics. Columbia University Press, New York. Oshiro, I. & Nohara, T., 2000. Distribution of the
Pleistocene terrestrial vertebrates and their migration to the Ryukyus. Tropics, 10: 41– 50.
Otani, T., 1993. Conditions of metamorphosis in megalopas of the fiddler crab Uca arcuata (De Haan) reared in the laboratory. Nippon Suisan Gakkaishi, 59: 929–932. (in Japanese with English abstract)
Reynolds, J., Weir, B. S. & Cockerham, C. C., 1983. Estimation for the coancestry coeffi-cient: basis for a short-term genetic distance. Genetics, 105: 767–779.
Rogers, A. R. & Harpending, H., 1992. Popula-tion growth makes waves in the distribuPopula-tion of pairwise genetic differences. Molecular Biology and Evolution, 9: 552–569.
Saitou, N. & Nei, M., 1987. The neighbor-joining method: a new method for reconstructing phylogenetic trees. Molecular Biology and Evolution, 4: 406–425.
Sakai, T., 1976. Crabs of Japan and the Adjacent Seas. Kodansha, Tokyo. (in Japanese) Scheltema, R.S., 1975. Relationship of larval
dis-persal, gene-flow & natural selection to geo-graphic variation of benthic invertebrates in estuaries and along coastal regions. Estua-rine Research, 1: 372–391.
Schwindt, E., 2007. The invasion of the acorn barnacle Balanus glandula in the south-western Atlantic 40 years later. Journal of Marine Biological Association UK, 87: 1219–1225.
Shanks, A. L., 2009. Pelagic larval duration and dispersal distance revisited. Biological Bul-letin, 216: 373–385.
Shih, H. T., 2009. Genetic evidence for the recog-nition of two fiddler crabs, Uca iranica and
U. albimana (Crustacea: Brachyura: Ocypo-didae), from the northwestern Indian Ocean, with notes on the Uca lactea species-com-plex. Hydrobiologia, 635: 373–382.
Shih, H. T. 2013. Systematics of the Indo-west Pacific broad-fronted fiddler crabs (Crusta-cea: Ocypodidae: Genus Uca). The Raffles Bulletin of Zoology, 61: 641–649.
Shiota, K. & Kitada, S., 1992. Life history of swimming crab in Hiuchi Nada, Seto Inland Sea estimated from marking experiments. Nippon Suisan Gakkaishi, 58: 2297–2302. (in Japanese with English abstract)
Sugimoto, T. & Kobayashi, M., 1988. Numerical studies on the influence of the variations of the Kuroshio Path on the transport of fish eggs and larvae. Geo Journal, 16: 113–117. Tajima, F., 1983. Evolutionary relationship of
DNA sequences in finite populations. Genet-ics, 105: 437–460.
Takeda, M., 2006. Uca lactea. In: Ministry of the Environment, (ed). Threatened wildlife of Japan, Red data book, 2nd ed. Japan Wild-life Research Center, Tokyo. pp. 63. (in Jap-anese)
Tamura, K., Nei, M. & Kumar, S., 2004. Pros-pects for inferring very large phylogenies by using the neighbor-joining method. Proceed-ings of the National Academy of Sciences, 101: 11030–11035.
Tamura, K., Peterson, D., Peterson, N., Stecher, G., Nei, M. & Kumar, S., 2011. MEGA5: Molecular evolutionary genetics analysis us-ing maximum likelihood, evolutionary dis-tance, and maximum parsimony methods. Molecular Biology and Evolution, 28: 2731–2739.
Todd, C. D., 1998. Larval supply & recruitment of benthic invertebrates: do larvae always disperse as much as we believe? Develop-ments in hydrobiology, 132: 1–21.
Tomita, S., Matsuzaki, S., Oka, S., Toda, M. & Imai, H., 2016. High levels of genetic diver-sity and gene flow in the endangered goby Hypseleotris cyprinoides on Okinawajima Island, Ishigakijima Island and Luzon
Is-land. Japanese Journal of Ichthyology, 63: 27–32. (in Japanese with English abstract) Ujiie, H., 1990. Geological history of the Ryukyu
Island Archipelago. In: H. Ujiie, (ed.), Na-ture of Okinawa: Geomorphology and Geol-ogy, Hirugisha, Naha, pp. 251–255. (in Japa-nese)
Uno, K. & Nakano, S., 2002. Effect of salinity on habitat of larvae of Uca around the Yoshino River mouth. Annual Journal of Hydraulic Engineering, JSCE, 46: 1175–1180. (in Jap-anese with English abstract).
Watterson, G. A., 1975. On the number of seggating sites in genetical models without re-combination. Theoretical Population Biolo-gy, 7: 256–276.
Yamaguchi, T., 1970. Ecology of a fiddler crab (Uca lactea). Calanus. Bulletin of the Aitsu Marine Biological Station, 2: 5–30. (in Japa-nese with English abstract)
Yamaguchi, T., 1978. Preliminary report on life history and population ecology of a fiddler crab, Uca lactea (De Haan). Japanese Asso-ciation of Benthology, (15–16): 10–15. (in Japanese)
Yamakawa, A. Y. & Imai, H., 2014. Genetic di-versity and population structure of Meretrix lamarckii from a Japanese sandy beach. Bul-letin of the Biogeographical Society of Ja-pan, 69: 143–160. (in Japanese with English abstract)
Yamauchi, M. M., Miya, M. U. & Nishida, M., 2002. Complete mitochondrial DNA se-quence of the Japanese spiny lobster, Panu-lirus japonicus (Crustacea: Decapoda). Gene, 295: 89–96.
Yamauchi, M. M., Miya, M. U. & Nishida, M., 2003. Complete mitochondrial DNA se-quence of the swimming crab, Portunus trit-uberculatus (Crustacea: Decapoda: Brachy-ura). Gene, 311: 129–135.
Addresses
(TT and HI) Laboratory of Marine Biology and Coral Reef Studies, Faculty of Science, University of the Ryukyus, Nishihara, Okinawa
903–0213, Japan
(JYS) Department of Aquaculture, College of Marine Resources and Engineering, National Penghu University of Science and Technology, Magong, Penghu 880, Taiwan
(HCL) Department of Life Science, College of Science, Tunghai University, Taiwan Boulevard, Taichung 40704, Taiwan
(YH) Aitsu Marine Station, Center for Water Cycle, Marine Environment, and Disaster Management, Kumamoto University, Chuo-ku, Kumamoto City, Kumamoto 860–8555, Japan (PM and JH) Australian Rivers Institute,
Griffith University, Nathan, Brisbane, Queensland 4111, Australia
(MT) International Institute of Okinawan studies, University of the Ryukyus, Nishihara, Okinawa 903–0213, Japan
(TT) Present address: Kansai Division, World Intec Co., Ltd., 5F Dai-san Bldg., Osakaekimae, 1–1–3–500 Umeda, Kita-ku, Osaka 530–0001, Japan
E-mail address of corresponding author