Integrating Sustainability in Supply Chain Network Design
18
0
0
全文
(2) Journal of the Eastern Asia Society for Transportation Studies, Vol.13, 2019. Over the years, the world we live in has changed dramatically. Climate model projections reveal a simple emergent relationship for our future climate: surface warming increasing nearly linearly with cumulative CO2 emitted since the preindustrial age. This relationship has been illustrated in terms of how surface warming increases with the cumulative CO 2 emission using different models (Williams et al. 2017). In the year 2014, 14% of total global emission were attributed to the transportation sector and 6% to buildings (IPCC, 2014). For that reason, it is essential to consider sustainability of the supply chain network earlier during the design phase. Moreover, increase in environmental concerns together with legislations are forcing concerned authorities to take a fresh look at the impact of their supply chain operations on the environment (Chaabane et al. 2012). While the environmental component of sustainability is seemingly straight forward, the social component of sustainability has different dimensions within itself. Depending on the studies, social aspect of supply chain measure ranges from service level, demand fulfillment at any cost, social justice, rights of stakeholders, creation of job opportunities etc. Furthermore, the social aspect of sustainability has been receiving less attention in comparison to the environmental and economic aspects. In today’s dynamic world there is an emerging need for supply chain network design problems to address the different dimensions of sustainability. While concerns about greenhouse gas emissions have prompted for minimization of environmental impacts as an important consideration when designing a supply chain network, concerns about social impact have prompted for maximization of service level to customers. Supply chain network design can be different depending on the types of products being handled, involved types and number of stakeholders, geographical region, budgetary limitations, and purpose of the network itself. In this study, we aim to explore the impact of integrating sustainability in the overall network configuration by building three models and determine the network configuration for each option. We start by building a basic model which considers only one of the three components and gradually add the other components of sustainability. Option I develops an efficiency based model which determines the network configuration with the objective of minimizing total cost; Option II develops an efficiency and environmental impact based model which determines the network configuration with the objective of minimizing total costs and total environmental impacts. Option III develops the sustainability based model which determines the network configuration when considering all the three components of sustainability with the objectives of minimizing total cost, total environmental impact, and unfulfilled demand. We focus on facility location and allocation problem within the supply chain network design problem. The remainder of this paper is organized as follows. Section 2 presents a review of the relevant literature on sustainable supply chain network design problems. The problem addressed in this study is defined and mathematical formulations for three different options are proposed in Section 3. In Section 4, we present the solution methodology adopted for solving the multiobjective optimization model. Numerical analysis of the proposed model and solution methodology is presented in Sections 4 and 5. In Section 6, we compare the results of the three models. Concluding remarks and suggestions for future research are given in Section 7.. 2. LITERATURE REVIEW 976.
(3) Journal of the Eastern Asia Society for Transportation Studies, Vol.13, 2019. Facility location and allocation within the supply chain network design problem is typically a strategic decision with long-term impact. The design of the network has a significant impact on the effectiveness of its performance. In this section, we provide a review of the extant of literature that has incorporated the concepts/measures of sustainability when designing supply chain network. The term sustainability has been used differently in different studies. While some studies have incorporated all three components encompassed in triple bottom line (TBL) approach: economic, environment, and social components simultaneously to define sustainability, some other studies have used either a single component or combination of components to define and measure sustainability of supply chains. As Barbosa-Povoa et al. (2018) quotes, “on the sustainability pillars, the concept of sustainable supply chain has been by far the most improperly used, as the different authors have primarily focused their attention on the economic and environmental dimensions, often combined, but few addressed the social dimension simultaneously. These findings reinforce the ones provided by Seuring (2013), Brandenburg et al. (2014) and Bradenburg and Rebs (2015). As such there is no standard measure of sustainability agreed upon till date. Sustainability has become popular in the commercial logistics vocabulary in recent years. More and more organizations are realizing the strategic importance of sustainability investments. Most of the efforts to achieve supply chain sustainability have been predominantly directed at reducing environmental burdens of the supply chain, commonly measured in terms of greenhouse gas emissions and resource consumption (Fahimnia and Jabbarzadeh, 2016). The social sustainability has focused more on the potential damage to human health and the community/society at large (Boukherroub et al., 2015). Minimization of GHG emission has been the most popular environmental objective (Benjaafar et al., 2013; Tang and Zhou, 2012), which is not surprising given the global emission reduction forces and environmental regulatory mandates to tackle climate change (Fahimnia and Jabbarzadeh, 2016). Despite the fact that the number of studies accounting for all three dimensions of sustainability are increasing, a large majority of the works still focus on the economic and environmental factors. In contrast, social aspects of sustainable development are rarely considered in the quantitative studies in comparison with environmental issues and even less research addresses all three dimensions together (Terouhid et al., 2012; Eskandarpour et al., 2015; Rajeeva et al., 2017; and Barbosa-Povoa et al. 2018). Additionally, there seems to be unanimity in the choice of objective function in terms of economic and environmental components. Generally, different types of costs have been used as a measure of the economic component and CO2 and GHG emissions as the measure of environmental component as evidenced by studies conducted by Lee et al., (2010), Chaabanen et al., (2012), Validi, et al. (2014), Mari et al., (2014) Nagurney (2015), Babazadeh, et al., (2018) and Wang, et al., (2018). On the contrary, different studies seem to be using different types of indicators to measure social component of sustainability. Xifenga et al., (2013) used maximization of customer service reliability, Chen and Andresen (2014) used minimization of employee injuries and SantibañezAguilara et al., (2014), Bairamzadeh, et al., (2015) Varseia and Polyakovskiy (2017), and Motaa et al., (2018) used maximization of number of jobs generated as the indicators to measure social component. As such maximization of number of jobs created is gaining its popularity as an indicator to measure social component of sustainability. Our review of the existing literature identified two important things which require further study. First, although there is a growing interest on the topic of sustainable network design 977.
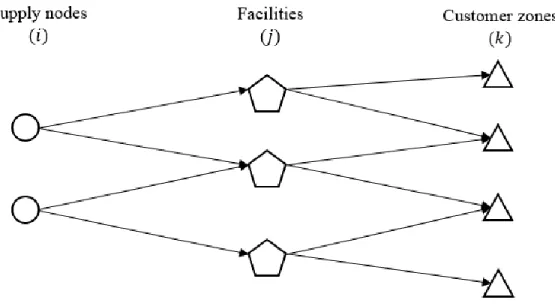
(4) Journal of the Eastern Asia Society for Transportation Studies, Vol.13, 2019. problem, there is a general lack of studies which have illustrated the sequential impact of incorporating different components of sustainability on the network design decisions. Studies have only incorporated one or more components of sustainability and presented the results without comparison with the existing structure of the network. From a decision makers point of view, a strategic decision like network design is both cost, time and resource intensive therefore a detailed comparison with the existing system becomes indispensable. Second, the number of studies focusing specifically on sustainability issue for facility location within the supply chain network design problem is still limited. With the aim of addressing these gaps in the literature and illustrating the impact of incorporating different components of sustainability in the supply chain network design problem, we develop three generic optimization models. The first optimization model is an efficiency based single objective optimization model, the second optimization model is efficiency and environmental impact based bi-objective model and the third optimization model is sustainability based three-objective optimization model. The details of the problem description and mathematical model formulation are presented in the subsequent sections.. 3. DESCRIPTION AND MODEL FORMULATION The problem context studied here considers an organization operating a three-echelon supplydistribution network for a particular product which is sourced from a number of suppliers and must be dispatched to a number of customer zones. Increasing regulations for carbon and waste management and greater corporate social responsibility is necessitating organizations to redesign supply chain networks such that they are conscious of their environmental and social impacts in addition to cost minimizing or profit maximizing objectives. A typical supply-distribution network can be represented by a directed graph such that the nodes of this graph corresponds to the existing suppliers, potential facilities, and existing customer zones. Directed arcs are associated to the physical transportation network, which can be used to move the product from one node to another. Consider a supply chain network, G = (N, A), where N is the set of nodes and A is the set of arcs. Here N is composed of the set of suppliers, S, facilities, W, and customer zones, C, i.e., N = S ∪ W ∪ C. Figure 1 shows the structure of the proposed supply chain network. The design decisions aim to choose the suppliers from the supplier set, select the best subset of facilities to be opened so as to satisfy model objectives, and finally consider how to distribute the product in the transportation and distribution process of the whole network. We envision different scenarios to illustrate the impact of accounting for all three components of sustainability on the design decision. For ease, we consider CO 2 emission as the only environmental influence, which is a very popular environment index and can be measured easily. The following section provides further details on the mathematical model, assumptions, and nomenclature used in the model formulation.. 978.
(5) Journal of the Eastern Asia Society for Transportation Studies, Vol.13, 2019. Figure 1: Structure of proposed supply chain network. Assumptions ▪ ▪ ▪ ▪ ▪ ▪. A single product is produced and distributed throughout the network. The location of supply nodes and customer zones are fixed. Supply nodes and facilities can be configured at various capacity levels. CO2 emission depends on the type and size of vehicle hence mode choice affects the environmental cost. Vehicle type L is used to move goods in the upstream supply chain and vehicle type S is used to move goods in the downstream distribution chain. All the vehicles are considered carrying full truck-load.. Nomenclature Parameters 𝐹𝑗 𝑒𝑗 𝑇𝐶𝑖𝑗 𝑇𝐶𝑗𝑘 𝐿 𝑢𝑖𝑗 𝑆 𝑢𝑗𝑘. : Fixed costs incurred during the establishment of facility 𝑗 : Fixed emission associated with the establishment of facility 𝑗 : Total transportation cost from supply node 𝑖 to facility 𝑗 : Total transportation cost from facility 𝑗 to customer zone 𝑘 : Unit transportation cost from supply node 𝑖 to facility 𝑗 per km using vehicle type 𝐿 : Unit transportation cost from facility 𝑗 to customer zone 𝑘 per km using vehicle type 𝑆. 𝑣 𝐿 , 𝑣 𝑆 : Capacity of vehicle type 𝐿 and 𝑆 𝑑𝑖𝑗 : Distance between supply node 𝑖 to facility 𝑗 979.
(6) Journal of the Eastern Asia Society for Transportation Studies, Vol.13, 2019. 𝑑𝑗𝑘 𝑒𝑖𝑗 𝑒𝑗𝑘 𝑐𝑜𝐿 𝑐𝑜 𝑆 𝑆𝑖 𝑊𝑗 𝑑𝑘. : Distance between facility 𝑗 to customer zone 𝑘 : Total carbon emission from supply node 𝑖 to facility 𝑗 (kg/unit) : Total carbon emission from facility 𝑗 to customer zone k (kg/unit) : Average CO2 emission per ton-km by vehicle type 𝐿 : Average CO2 emission per ton-km by vehicle type 𝑆 : Capacity of supply node 𝑖 : Total number of facilities : Demand at customer zone 𝑘. Decision variables 𝑞𝑖𝑗 𝑞𝑗𝑘 𝑦𝑗. : Quantity of goods shipped from supply node 𝑖 to facility 𝑗 : Quantity of goods shipped from facility 𝑗 to customer zone 𝑘 : A binary variable which equals 1 if a facility is open in location 𝑗 and 0 otherwise. We present model formulation for three cases: Option I, Option II, and Option III. The first model considers a single objective optimization model with the sole aim of enhancing efficiency. Minimization of total cost is used as a measure of efficiency which is formulated as the sum of the total cost of establishing and operating a supply chain network to fully satisfy the demand. We relate lower cost performance of the supply chain network to higher efficiency. The second model considers two objectives, encompassing two out of the three components of sustainability to fully satisfy the demand. The first objective minimizes total cost and the second objective minimizes total CO2 emission. In the second model, minimization of total CO2 emission is used as a measure of environmental impact/performance which is formulated as the sum of fixed facility establishment and transportation related emissions. We relate lower emissions to lower environmental impact or better environmental performance. The third model considers three objectives, encompassing all the three components of sustainability namely, economy, environment, and society. The first objective minimizes total cost, the second objective minimizes total CO2 emission, and the third objective minimizes the total unfulfilled demand. In the third model, minimization of unfulfilled demand is used as a measure of the social component of sustainability which is formulated as the difference between the total quantity supplied and the total quantity demanded by the customer zones. We relate unfulfilled demand as the social component of sustainability; larger unfulfilled demand rate implies poor performance over the social component. Often there is a tendency to overlook/ignore the importance of fulfilling incoming demand for products when attempting to minimize costs or emissions. Companies often aim at a certain structure of network configuration that meets the needs of the provider side while ignoring the need of the receiver side. To highlight and develop an understanding of the impact of fulfilling incoming demand on the overall supply chain network configuration, we have used this as a measure of social component of sustainability. The model formulations are discussed in the succeeding sections.. 980.
(7) Journal of the Eastern Asia Society for Transportation Studies, Vol.13, 2019. 3.1 Model formulation for Option I: Considers Efficiency The optimization model is formulated as follows: Minimize, 𝑂1 = ∑𝑗 𝐹𝑗 𝑦𝑗 + ∑𝑖 ∑𝑗 𝑇𝐶𝑖𝑗 + ∑𝑗 ∑𝑘 𝑇𝐶𝑗𝑘. (1). Where, 𝑇𝐶𝑖𝑗 = 𝑇𝐶𝑗𝑘 =. 𝐿 𝑢𝑖𝑗 ×𝑑𝑖𝑗. 𝑣𝐿. × 𝑞𝑖𝑗. 𝑆 𝑢𝑗𝑘 ×𝑑𝑗𝑘. 𝑣𝑆. (2). × 𝑞𝑗𝑘. (3). ∑𝑘 𝑞𝑗𝑘 − ∑𝑖 𝑞𝑖𝑗 = 0. ∀𝑗 ∈ J. (4). ∑𝑗 𝑞𝑖𝑗 ≤ 𝑆𝑖. ∀𝑖 ∈ I. (5). ∑𝑖 𝑞𝑖𝑗 ≤ 𝑊𝑗. ∀𝑗∈ J. (6). ∑𝑘 𝑞𝑗𝑘 ≤ 𝑊𝑗. ∀𝑗 ∈ J. (7). ∑𝑗 𝑞𝑗𝑘 = 𝑑𝑘. ∀𝑘 ∈ K. (8a). 𝑞𝑖𝑗 ≥ 0. ∀𝑖 ∈ I, 𝑗 ∈ J. (9). 𝑞𝑗𝑘 ≥ 0. ∀𝑗 ∈ J, 𝑘 ∈ K. (10). 𝑦𝑗 ∈ {0,1}. ∀𝑗 ∈ J. (11). The objective function (1) minimizes the total cost. It minimizes initial investment cost associated with establishment of facility, transportation cost associated with transport of goods from supply nodes to facilities, and transportation cost associated with transport of goods from facilities to customer zones. Equations (2) and (3) show the functions used to calculate upstream and downstream transportation cost. Constraint (4) represents the flow balance constraint. Constraints (5) – (7) are the availability constraints. The demand constraint is represented by equation (8a) which stipulates that all the demand must be fulfilled. Equations (9) – (11) depict the nature of the decision variables.. 981.
(8) Journal of the Eastern Asia Society for Transportation Studies, Vol.13, 2019. 3.2 Model formulation for Option II: Considers efficiency and environmental impact The optimization model is formulated as follows: Minimize, 𝑂1 = ∑𝑗 𝐹𝑗 𝑦𝑗 + ∑𝑖 ∑𝑗 𝑇𝐶𝑖𝑗 + ∑𝑗 ∑𝑘 𝑇𝐶𝑗𝑘. (1). 𝑂2 = ∑𝑗 𝑒𝑗 𝑦𝑗 + ∑𝑖 ∑𝑗 𝑒𝑖𝑗 + ∑𝑗 ∑𝑘 𝑒𝑗𝑘. (12). Where, 𝑇𝐶𝑖𝑗 = 𝑇𝐶𝑗𝑘 =. 𝐿 𝑢𝑖𝑗 ×𝑑𝑖𝑗. 𝑣𝐿. × 𝑞𝑖𝑗. 𝑆 𝑢𝑗𝑘 ×𝑑𝑗𝑘. 𝑣𝑆. (2). × 𝑞𝑗𝑘. (3). 𝑒𝑖𝑗 = 𝑞𝑖𝑗 × 𝑐𝑜𝐿 × 𝑑𝑖𝑗. (13). 𝑒𝑗𝑘 = 𝑞𝑗𝑘 × 𝑐𝑜 𝑆 × 𝑑𝑗𝑘. (14). ∑𝑘 𝑞𝑗𝑘 − ∑𝑖 𝑞𝑖𝑗 = 0. ∀𝑗 ∈ J. (4). ∑𝑗 𝑞𝑖𝑗 ≤ 𝑆𝑖. ∀𝑖 ∈ I. (5). ∑𝑖 𝑞𝑖𝑗 ≤ 𝑊𝑗. ∀𝑗∈ J. (6). ∑𝑘 𝑞𝑗𝑘 ≤ 𝑊𝑗. ∀𝑗 ∈ J. (7). ∑𝑗 𝑞𝑗𝑘 = 𝑑𝑘. ∀𝑘 ∈ K. (8a). 𝑞𝑖𝑗 ≥ 0. ∀𝑖 ∈ I, 𝑗 ∈ J. (9). 𝑞𝑗𝑘 ≥ 0. ∀𝑗 ∈ J, 𝑘 ∈ K. (10). 𝑦𝑗 ∈ {0,1}. ∀𝑗 ∈ J. (11). The first and second objective represent the economic and the environmental components of sustainability. The objective function (1) minimizes the total cost; and (2) minimizes total carbon dioxide emission. Objective (2) encompasses the facility establishment associated and arc-dependent CO2 emissions. For each node an amount of CO2 emission proportional to the size of the facility, and accompanying activities is generated with establishment of a facility and for each arc and each flow in the arc, an amount of CO 2 emission 𝑒𝑖𝑗 and 𝑒𝑗𝑘 is generated proportional to the choice of transport mode, amount of product transported and distance travelled. Equation (13) and (14) represents the utility function for calculating CO2 emission and equation (4) – (11) are the same constraints derived from the first model. 982.
(9) Journal of the Eastern Asia Society for Transportation Studies, Vol.13, 2019. 3.3 Model formulation for Option III: Considers Sustainability The optimization model is formulated as follows: Minimize, 𝑂1 = ∑𝑗 𝐹𝑗 𝑦𝑗 + ∑𝑖 ∑𝑗 𝑇𝐶𝑖𝑗 + ∑𝑗 ∑𝑘 𝑇𝐶𝑗𝑘. (1). 𝑂2 = ∑𝑗 𝑒𝑗 𝑦𝑗 + ∑𝑖 ∑𝑗 𝑒𝑖𝑗 + ∑𝑗 ∑𝑘 𝑒𝑗𝑘. (12). 𝑂3 = ∑𝑘 𝑑𝑘 − ∑𝑗 ∑𝑘 𝑞𝑗𝑘. (15). Where, 𝑇𝐶𝑖𝑗 = 𝑇𝐶𝑗𝑘 =. 𝐿 𝑢𝑖𝑗 ×𝑑𝑖𝑗. 𝑣𝐿. × 𝑞𝑖𝑗. 𝑆 𝑢𝑗𝑘 ×𝑑𝑗𝑘. 𝑣𝑆. (2). × 𝑞𝑗𝑘. (3). 𝑒𝑖𝑗 = 𝑞𝑖𝑗 × 𝑐𝑜𝐿 × 𝑑𝑖𝑗. (13). 𝑒𝑗𝑘 = 𝑞𝑗𝑘 × 𝑐𝑜 𝑆 × 𝑑𝑗𝑘. (14). ∑𝑘 𝑞𝑗𝑘 − ∑𝑖 𝑞𝑖𝑗 = 0. ∀𝑗 ∈ J. (4). ∑𝑗 𝑞𝑖𝑗 ≤ 𝑆𝑖. ∀𝑖 ∈ I. (5). ∑𝑖 𝑞𝑖𝑗 ≤ 𝑊𝑗. ∀𝑗∈ J. (6). ∑𝑘 𝑞𝑗𝑘 ≤ 𝑊𝑗. ∀𝑗 ∈ J. (7). ∑𝑗 𝑞𝑗𝑘 ≤ 𝑑𝑘. ∀𝑘 ∈ K. (8b). 𝑞𝑖𝑗 ≥ 0. ∀𝑖 ∈ I, 𝑗 ∈ J. (9). 𝑞𝑗𝑘 ≥ 0. ∀𝑗 ∈ J, 𝑘 ∈ K. (10). 𝑦𝑗 ∈ {0,1}. ∀𝑗 ∈ J. (11). The first, second, and the third objectives represent the economic, environmental, and the social components of sustainability. The objective function (1) minimizes the total cost; (2) minimizes total carbon dioxide emission; and (3) minimizes the total unfulfilled demand. Equations (13) and (14) represent the utility function for calculating CO2 emission and equation (4) – (11) are the same constraints derived from the first model. To understand the impact of introducing a third objective on the overall supply chain network configuration, we have revised equation (8a) used in the preceding models to equation (8b) in this model formulation. In the revised formulation, the demand of customer zones is allowed to be greater than supply leading 983.
(10) Journal of the Eastern Asia Society for Transportation Studies, Vol.13, 2019. to a situation where all the demand may not be fulfilled. This implies that companies can select a supply chain network configuration that best suits their needs. 4. SOLUTION APPROACH FOR THE MULTI-OBJECTIVE OPTIMIZATION MODEL One of the most popular approaches to solving multi-objective optimization involves formulating a single objective optimization problem related to the multi-objective problem by using a realvalued scalarizing function. Besides the weighted sum method, the epsilon constraint method may be the best-known technique to solve multi-objective optimization problems (Ehrgott, 2005). In this study, Option II two-objective and Option III three-objective problem is solved using this method. This method has several advantages over the weighting method (for a detailed explanation of these advantages, see (Mavrotas, 2009)). In the epsilon constraint method, one of the objective functions is optimized by using the other objective functions as constraints, incorporating them into the constraint part of the model. Through the parametric variation on the right-hand side of the constrained objective function, the efficient solutions of the problem can be obtained. The epsilon constraint reformulation for Option II and Option III is presented below. The optimization model for Option II is reformulated to optimize total cost such that total carbon emission is constrained to a real value scalar 𝜀2 as follows: Minimize, 𝑂1 = ∑𝑗 𝐹𝑗 𝑦𝑗 + ∑𝑖 ∑𝑗 𝑇𝐶𝑖𝑗 + ∑𝑗 ∑𝑘 𝑇𝐶𝑗𝑘. (1). ∑𝑗 𝑒𝑗 𝑦𝑗 + ∑𝑖 ∑𝑗 𝑒𝑖𝑗 + ∑𝑗 ∑𝑘 𝑒𝑗𝑘 ≤ 𝜀2. (16). Subject to (2−11), (13−14). Similarly, the optimization model for Option III is reformulated to optimize unfulfilled demand such that total carbon emission and total cost are constrained to real valued scalar 𝜀2 and 𝜀1 as follows: Minimize, 𝑂1 = ∑𝑗 𝐹𝑗 𝑦𝑗 + ∑𝑖 ∑𝑗 𝑇𝐶𝑖𝑗 + ∑𝑗 ∑𝑘 𝑇𝐶𝑗𝑘. (15). ∑𝑗 𝑒𝑗 𝑦𝑗 + ∑𝑖 ∑𝑗 𝑒𝑖𝑗 + ∑𝑗 ∑𝑘 𝑒𝑗𝑘 ≤ 𝜀2. (16). ∑𝑘 𝑑𝑘 − ∑𝑗 ∑𝑘 𝑞𝑗𝑘 ≤ 𝜀3. (17). subject to (2−7), (8b), and (9−11).. 984.
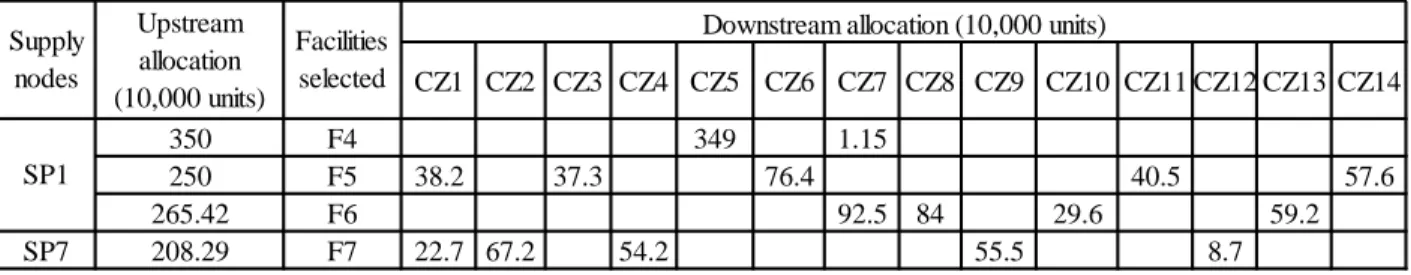
(11) Journal of the Eastern Asia Society for Transportation Studies, Vol.13, 2019. 5. NUMERICAL ILLUSTRATION A minimum road infrastructure connecting all the nodes in this network is given for a 3-level supply chain design problem. Customer zones, supply nodes, and facilities can be located at different nodes. There are in total 7 supply nodes, 12 candidate facilities, and 14 customer zones. Each arc is associated with a transportation cost and an amount of CO 2 emission. Establishment of facility is associated with a fixed establishment cost and facility associated CO2 emission. Each customer zone has a known demand. The number of suppliers and their capacities, number of potential facilities and their capacities and their associated emission, unit transportation cost from one echelon to the other, CO2 emission per ton-km for road transport, and the number of customer zones and their demands is given. The sections below present the results of the numerical illustration for the two options. The models were coded in Lingo 17.0 Optimization modeling software. All the experiments were run on a personal computer with an Intel (R) Core (TM) i7-3770 CPU (3.40 GHz) and 8 GB of RAM. All the test problems were computed in under 10 minutes. 5.1. Results: Option I. The Option I efficiency based model resulted in the selection of facilities F4, F5, F6, and F7 to fulfill all the demand of 14 customer zones (i.e. there is no unfulfilled demand) at a total cost of 8.374 million USD. The total cost comprises of 4 million USD incurred as the fixed establishment cost, 0.314 million USD as the upstream transportation cost from the supply nodes to the facilities, and 4.42 million USD as the downstream transportation cost from facilities to the customer zones. Table 1 shows the details of upstream and downstream allocation. From Table 1 we can observe that among the seven supply nodes only two (SP1 and SP7) are selected to supply goods to the four selected facilities, with major movement of goods occurring from SP1 which supplies to three among the four facilities, thereby highlighting the significance of SP1. We can also observe that the largest proportion of the customer demand is fulfilled by F4 followed by F6, F5, and F7, highlighting the order of significance of the facilities based on the demand fulfillment rate.. Table 1: Demand allocation for Option I supply and distribution network. 985.
(12) Journal of the Eastern Asia Society for Transportation Studies, Vol.13, 2019. Supply nodes SP1 SP7. 5.2. Upstream allocation (10,000 units) 350 250 265.42 208.29. Downstream allocation (10,000 units) Facilities selected CZ1 CZ2 CZ3 CZ4 CZ5 CZ6 CZ7 CZ8 CZ9 CZ10 CZ11 CZ12 CZ13 CZ14 F4 F5 F6 F7. 349 38.2. 37.3. 1.15 76.4. 40.5 92.5 84. 22.7 67.2. 54.2. 57.6. 29.6 55.5. 59.2 8.7. Results: Option II. The Option II efficiency and environmental impact based model was solved using the epsilon constraint method by the parametric variation of the second objective which deals with the environmental impact. Figure 2 shows some points on the Pareto frontier. The Pareto frontier provides the decision-maker a portfolio of alternative optimal solutions to choose from when making the location decision. We can observe a trade-off relationship between the efficiency and environmental impact from Figure 2. A decrease in total CO2 emission results in an increase in total cost associated with the supply chain network highlighting the inverse relationship between the two objectives. The solution with the minimum total cost of 8.374 million USD results in the highest CO2 emission of 50 tons and a network configuration with facilities in F4, F5, F6, and F7. This result corresponds to the solution of Option I represented by N in Figure 2. On the other hand, the solution with the minimum CO2 emission of 38 tons results in the largest total cost of 9.69 million USD and a network configuration with facilities in F1, F4, F5, and F6. All the other points in between the two extreme points N and M presents alternative solutions to the same problem.. N (50, 837.41). (49, 873.64) (48, 875.68) (47, 879.34). (42.77, 881.17.41) (40.84, 882.08.41) (40, 892.26) (39, 916.25). M (38, 969.35). Figure 2: Results for Option II model 986.
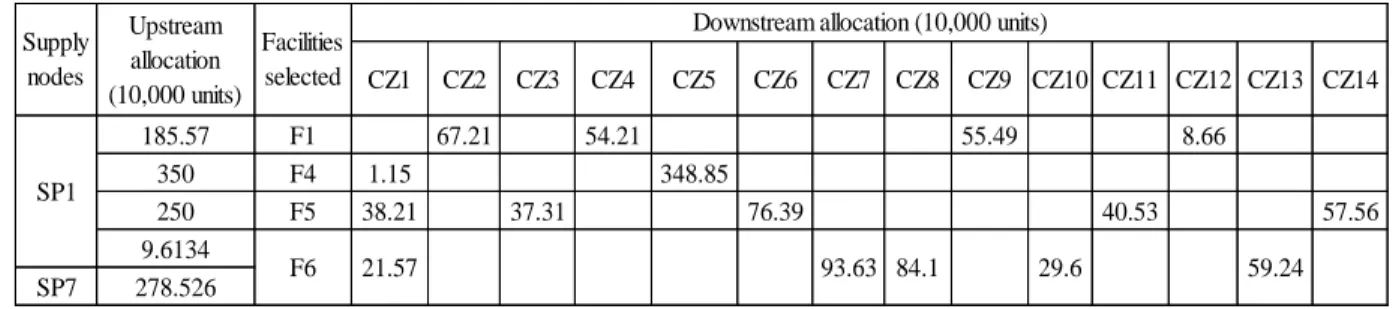
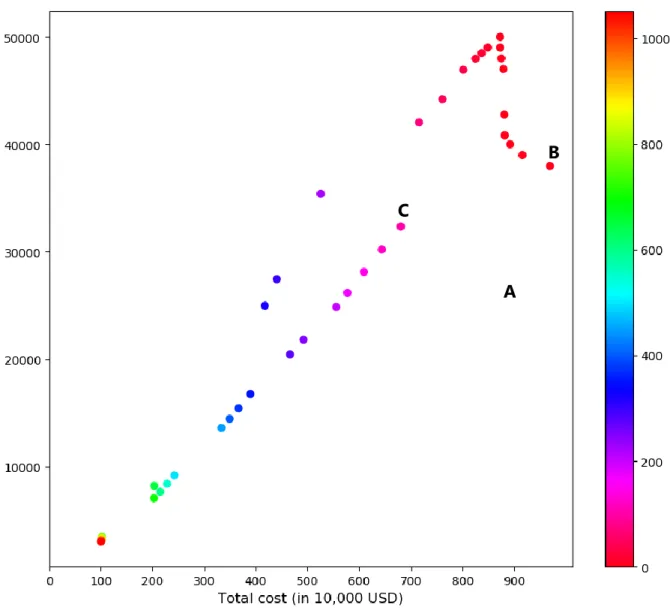
(13) Journal of the Eastern Asia Society for Transportation Studies, Vol.13, 2019. For illustration purpose, we present the results of demand allocation for a case with minimum total CO2 emission which has been marked as point M in the Figure 2. The Option II efficiency and environmental impact based model resulted in the selection of four facilities F1, F4, F5, and F6 to fulfill all the demand of 14 customer zones incurring a total cost of 9.69 million USD and CO2 emission of 38 tons as one of the Pareto optimal results. Table 2 shows the details of upstream and downstream allocation of goods for fully satisfied demand condition. From Table 2 we can observe that among the seven supply nodes only two supply nodes namely SP1 and SP7 are selected to supply goods to the four facilities F1, F4, F5, and F6, respectively. Major movement of goods occurs from SP1 which supplies to three among the four facilities with the largest amount of goods being handled, thereby highlighting the significance of SP1 as a supply node. We can also observe that the largest proportion of the customer demand is fulfilled by F4 followed by F6, F5, and F1, highlighting the order of significance of the facilities based on the proportion of demand fulfilled. Table 2: Demand allocation for Option II supply and distribution network Supply nodes. SP1. SP7. 5.3. Upstream Facilities allocation selected CZ1 (10,000 units) 185.57 350 250 9.6134 278.526. F1 F4 F5. 1.15 38.21. F6. 21.57. Downstream allocation (10,000 units) CZ2. CZ3. 67.21. CZ4. CZ5. CZ6. CZ7 CZ8. 54.21. CZ9 CZ10 CZ11 CZ12 CZ13 CZ14 55.49. 8.66. 348.85 37.31. 76.39. 40.53 93.63 84.1. 29.6. 57.56 59.24. Results: Option III. The Option III sustainability based model was solved using the epsilon constraint method by the parametric variation of the second and the third objective which deals with environmental impact and demand fulfilment respectively. We solve the reformulated model presented in Section 4 and generate some points on the Pareto frontier by parametric variation in social component of sustainability. Figure 3 illustrates the total cost and total CO2 emission at every value of 𝜀3 i.e. unfulfilled demand. Starting from the best possible situation in which all the demand is fulfilled i.e. a situation where unfulfilled demand is zero, a gradual increase in total cost and total CO2 emission can be observed with decreasing values of total unfulfilled demand. This implies that higher demand fulfillment will incur both high total cost and high total CO2 emission. Point A in Figure 3 corresponds to the Option I solution where the total cost is minimized. Points A and B shown in Figure 2 are the two extreme points which corresponds to the results of Option II under the condition that all the incoming demand is fulfilled.. 987. Unfulfilled demand (in 10000 units).
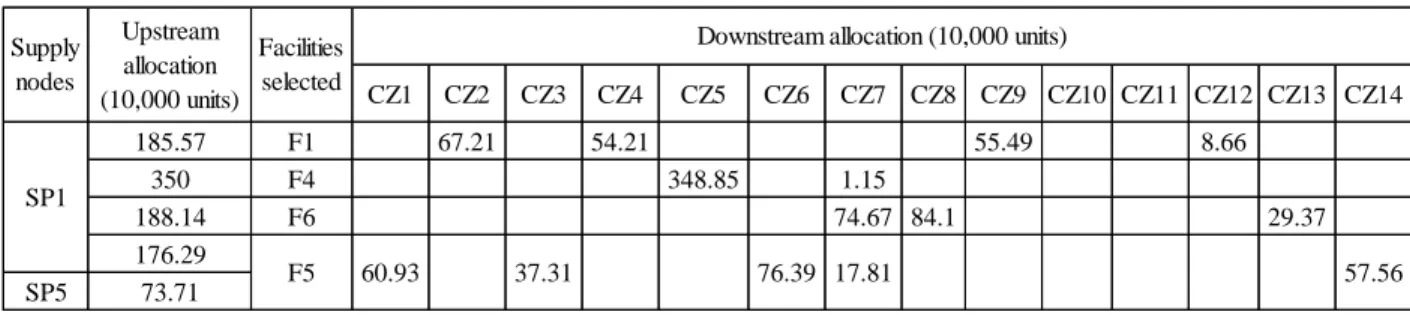
(14) Journal of the Eastern Asia Society for Transportation Studies, Vol.13, 2019. B C. A. Figure 3: Result for Option III model For illustration, among several points on the Pareto frontier for Option III sustainability based model presented in Figure 3, we explain the results obtained at point C. Point C in Figure 3 corresponds to a solution which incurs a total cost of 6.81 million USD, total CO 2 emission of 32.36 tons leaving 1 million units of demand unfulfilled and selection of facilities in F1, F4, F5, and F6. At this point 90.68 percentage of the total demand arising from the customer zones is fulfilled. Table 3 shows the details of upstream and downstream allocation of goods for solution at point C. From Table 3 we can observe that among the seven supply nodes only two supply nodes namely SP1 and SP5 are selected to supply goods to four facilities which are selected to be located at F1, F4, F5, and F6. Major movement of goods occurs from SP1 which supplies to all four facilities with the largest amount of goods being handled, thereby highlighting the 988.
(15) Journal of the Eastern Asia Society for Transportation Studies, Vol.13, 2019. significance of SP1 as a supply node which is followed by SP5. We can also observe that the largest proportion of the customer demand is fulfilled by F4 which is followed by F5, F6, and F1, highlighting the order of significance of the facilities based on the demand fulfillment rate. Table 3: Demand allocation for Option III supply and distribution network Supply nodes. SP1. SP5. 5.4. Upstream Facilities allocation selected CZ1 (10,000 units) 185.57 350 188.14 176.29 73.71. F1 F4 F6 F5. Downstream allocation (10,000 units) CZ2. CZ3. 67.21. CZ4. CZ5. CZ7 CZ8 CZ9 CZ10 CZ11 CZ12 CZ13 CZ14. 54.21. 55.49 348.85. 60.93. CZ6. 37.31. 1.15 74.67 84.1 76.39 17.81. 8.66 29.37 57.56. Comparison of model results. Comparison of the results of the numerical illustration and selected solution points of Option I and II models shows an increase of 7.47 percent in total cost for the supply chain network configuration that aims to minimize environmental impact (point M) in contrast to minimizing total cost. A corresponding reduction in total CO2 emission of 21 percent can be attained when minimizing environmental impact with all the incoming demand being fulfilled. By comparison of the results of the numerical illustration and selected solution points of Option I and III models we can observe a reduction in 18.63 percent in costs, 35.28 percent in CO2 emissions with 8.45 percent increment in unfulfilled demand. Similar comparison of Option II and III reveals a reduction in 29.72 percent in costs, 14.84 percent in CO2 emissions with 8.45 percent increment in unfulfilled demand. We can also observe that, while the network configuration for Option I and III is different, the network configuration for Option II and III is the same but the supply sourcing and allocation decisions are fairly different. The significance of supply nodes SP1 is highlighted by its repetition in all the three model results. Although a change in the network configuration and associated allocation decisions can be observed for the three models, irrespective of the model, similar observation can be made regarding the significance of facility sites F4, F5, and F6 due to their repetition.. 6. SUMMARY AND CONCLUSION In this study, we have developed three optimization models for a supply and distribution network design problem with the broader aim of highlighting the impact of incorporating all three components of sustainability which is in contrary to the commonly employed conventional approaches. Most of the studies in the field were found to usually focus on economic and/or environmental component of sustainability. However, there are only limited numbers of studies focusing on all the three components. While minimization of cost and/or environmental impact is 989.
(16) Journal of the Eastern Asia Society for Transportation Studies, Vol.13, 2019. essential, one cannot deny the importance of incorporating social aspect of sustainability to enable informed decision making. Option I efficiency based model enables us to determine supply chain network configuration for a typical case in which the decision-makers are only concerned on minimizing the total network cost. The Option II efficiency and environmental impact based model enables us to determine supply chain network configuration that minimizes total cost and total CO 2 emission. Option II model allows the decision-makers to see the trade-off between the two objectives. A higher emphasis on minimizing total cost leads to larger negative environmental impact and a lower emphasis on minimizing total cost leads to smaller negative environmental impact. This model gives a set of Pareto optimal solutions with different cost, CO 2 emission, and network configuration for each solution such that the decision-maker can select a solution that best meets their needs. On the other hand, Option III sustainability based model enable us to determine supply chain network configuration that minimizes total cost, total CO 2 emission, and total unfulfilled demand. Minimizing total unfulfilled demand leads to increase in both total cost and total CO2 emission. The set of Pareto optimal solutions provide the decision-maker ample alternatives to choose the supply chain network configuration that best meets their needs. The models proposed in this study were implemented using a test dataset. The result of the mathematical models shows the network configuration including the number and location of facilities, optimal supply nodes to be included in the network configuration, quantity of goods to be shipped from each supplier to the facility and from facility to the customer zones and finally the number of sources allocated to each customer zones. The results of the numerical illustration of the three models show the impact of incorporating components of sustainability on the network configuration including location of facilities and associated allocation decisions. The Pareto frontier provides the decision-maker a portfolio of alternative optimal solutions to choose from when making the location decision. From a decision-maker’s perspective, these ample alternatives provide an in-depth understanding of the environmental and social impacts of supply distribution network which is essential for making informed decision. Generally, one would imagine only an increase in total cost or additional burden when incorporating environmental and social aspects of sustainability in the network design problem, instead we have illustrated that incorporation of sustainability components allows the decisionmakers to make informed decision by proving ample alternatives to choose from, which could actually benefit companies. Future work can focus on extension of the model to understand the impact of capacity of supply nodes and facilities and associated costs on the attainment of model objectives. Future studies can also explore the impact of having competitors and multiple products. Extension can also be explored in the field of network resilience and uncertainty.. 7. ACKNOWLEDGEMENT We would like to thank Professor Matthias Ehrgott for his comments and suggestions that greatly improved the manuscript. 990.
(17) Journal of the Eastern Asia Society for Transportation Studies, Vol.13, 2019. REFERENCES 1. Ahi, P. and Searcy, C. (2015) Assessing sustainability in the supply chain: A triple bottom line approach. Applied Mathematical Modelling, Vol. 39, pp. 2882-2896. 2. Babazadeh, R., Razmi, J., Pishvaee, M. S. and Rabbani, M. (2017) A sustainable secondgeneration biodiesel supply chain network design problem under risk. Omega, Vol. 66(B), pp. 258-277. 3. Bairamzadeh, S., Pishvaee, M. S. and Saidi-Mehrabad, M. (2015) Multiobjective Robust Possibilistic Programming Approach to Sustainable Bioethanol Supply Chain Design under Multiple Uncertainties. Ind. Eng. Chem. Res., Vol. 55, pp. 237−256. 4. Barbosa-Póvoa, A. P., da Silva, C., and Carvalho, A. (2018) Opportunities and challenges in sustainable supply chain: An operations research perspective. European Journal of Operational Research, Vol. 268, pp. 399-431. 5. Benjaafar, S., Li, Y., and Daskin, M. (2013) Carbon footprint and the management of supply chains: Insights from simple models. IEEE Transactions on Automation Science and Engineering, 10 (1), 99–116. 6. Boukherroub, T., Ruiz, A., Guinet, A., and Fondrevelle, J. (2015) An integrated approach for sustainable supply chain planning. Computers and Operations Research, 54, 180–194. 7. Chaabane, A., Ramudhin, A., and Paquet, M. (2012) Design of sustainable supply chains under the emission trading scheme. Int. J. of Production Economics, 135, 37–49. 8. Chaabanen, A., Ramudhin, A. Paquet, M. (2012) Design of sustainable supply chains under the emission trading scheme. Int. J. Production Economics, Vol. 135, pp. 37-49. 9. Chen, Z. and Svenja Andresen, S. (2014) A Multiobjective Optimization Model of roduction-Sourcing for Sustainable Supply Chain with Consideration of Social, Environmental, and Economic Factors. Mathematical Problems in Engineering, Vol. 2014, Article ID 616107, 11 pages. 10. Ehrgott, M. (2005) Multicriteria Optimization. Heidelberg: Springer Berlin. 11. Eskandarpour, M., Dejax, P., Miemczyk, J., and Peton, O. (2015) Sustainable supply chain network design: An optimization-oriented review. Omega, 54, 11–32. 12. Fahimnia, B. and Jabbarzadeh, A. (2016) Marrying supply chain sustainability and resilience: A match made in heaven. Transport Research Part E: Logistics and Transportation Review, 91, 306–324. 13. Lee, D-H., Dong, M., and Bian, W. (2010), “The design of sustainable logistics network under uncertainty”, Int. J. Production Economics, Vol. 128, pp. 159-166. 14. Mari, S. I., Lee, Y. H. and Memon, M. S. (2014) Sustainable and Resilient Supply Chain Network Design under Disruption Risks. Sustainability, Vol. 6, pp. 6666-6686. 15. Mavrotas G. (2009) Effective implementation of the ε-constraint method in multiobjective mathematical programming problems. Applied Mathematics and Computation, 213 (2), 455–465. 16. Motaa, B., Gomes, M. I., Carvalho, A. and Barbosa-Povoa, A. P. (2018) Sustainable supply chains: An integrated modeling approach under uncertainty. Omega, Vol. 77, pp. 32-57. 17. Nagurney, A. (2015) Design of sustainable supply chains for sustainable cities. Environment and Planning B: Planning and Design, Vol. 42, pp. 40–57. 991.
(18) Journal of the Eastern Asia Society for Transportation Studies, Vol.13, 2019. 18. Rajeeva, A., Patia, R. K., Padhia, S. S., and Govindan, K. (2017) Evolution of sustainability in supply chain management: A literature review. Journal of Cleaner Production, Vol. 162, pp. 299-314. 19. Santibañez-Aguilara, J. E., González-Camposb, J. B., Ponce-Ortegaa, J. M., SernaGonzáleza, M. and El-Halwagi, M. M. (2014) Optimal planning and site selection for distributed multi product bio refineries involving economic, environmental and social objectives. Journal of Cleaner Production, Vol. 65, pp. 270-294. 20. Tang, C. S. and Zhou, S. (2012) Research advances in environmentally and socially sustainable operations. European Journal of Operational Research, 223 (3), 585–594. 21. Terouhid, A. S., Ries, R., and Fard, M. M. (2012) Towards Sustainable Facility Location – A Literature Review. Journal of Sustainable Development, Vol. 5 (7). 22. Validi, S. Bhattacharya, A. and Byrne, P.J. (2014) A case analysis of a sustainable food supply chain distribution system—A multi-objective approach. Int. J. Production Economics, Vol. 152, pp. 71-87. 23. Varseia, M. and Polyakovskiy, S. (2017) Sustainable supply chain network design: A case of the wine industry in Australia. Omega, Vol. 66, pp. 236-247. 24. Wang, C., Hu, Z. Xie, M., and Bian, Y. (2018), “Sustainable facility location-allocation problem under uncertainty. Concurrency and Computation Practice and Experience, Vol. 31, e4521. 25. Williams, R. G. et al. (2017) Sensitivity of global warming to carbon emissions: Effects of heat and carbon uptake in a suite of earth system models. J. Climate, 30, 9343–9363. 26. Xifenga, T., Jib, Z. and Peng, X. (2013) A multi-objective optimization model for sustainable logistics facility location, Transportation Research Part D, Vol. 22, pp. 45-48.. 992.
(19)
図
+2
関連したドキュメント
In the previous section, we revisited the problem of the American put close to expiry and used an asymptotic expansion of the Black-Scholes-Merton PDE to find expressions for
The calibration problem for the Black-Scholes model was solved based on the S&P500 data, and the S&P 500 call and put option price data were interpreted in the framework
The (GA) performed just the random search ((GA)’s initial population giving the best solution), but even in this case it generated satisfactory results (the gap between the
The proposed model in this study builds upon recent developments of integrated supply chain design models that simultaneously consider location, inventory, and shipment decisions in
The excess travel cost dynamics serves as a more general framework than the rational behavior adjustment process for modeling the travelers’ dynamic route choice behavior in
Remember that the retailer’s optimal refund price in this scenario is zero, so when the upstream supplier does not buyback returns, the retailer’s optimal response is to choose not
In a previous paper [1] we have shown that the Steiner tree problem for 3 points with one point being constrained on a straight line, referred to as two-point-and-one-line Steiner
Based on the evolving model, we prove in mathematics that, even that the self-growth situation happened, the tra ffi c and transportation network owns the scale-free feature due to
