Public Health and Groundwater Quality
in Sri Lanka and Defluoridation of
Drinking Water
In relation to Chronic Kidney Disease of
unknown etiology
2018 March
Doctoral Dissertation
Public Health and Groundwater Quality in Sri
Lanka and Defluoridation of Drinking Water
In relation to Chronic Kidney Disease of
unknown etiology
Supervisor’s Name: Professor Tomonori Kawakami
Toyama Prefectural University
Department of Environmental Engineering
Faculty of Engineering
Student’s Name: H. M. Ayala Sunali Herath
Student No: 1577004
CONTENT
General Introduction ………. 1
CHAPTER 1 Potential Risk of Drinking Water to Human Health in Sri Lanka in Relation to Public Health, and Chronic Kidney Disease of unknown etiology (CKDu) 1.Introduction ………... 3
2.Materials and Methods ……… 5
3. Results and Discussion 3.1. pH ……….. 8 3.2. Fluoride ………... 10 3.3. Nitrate ……….. 12 3.4. Hardness ……….. 17 3.5. Metals 3.5.1. Aluminum ………. 20 3.5.2. Manganese ……… 24 3.5.3. Arsenic ………... 27 3.5.4. Cadmium ……….. 34 3.5.5. Lead ……….. 37 3.5.6. Chromium ………. 38 4. Conclusions ……….. 41 CHAPTER 2 Arsenic, Cadmium, Lead, and Chromium in Rice, Human Urine, and Pesticides in Groundwater, and Rice in Sri Lanka in Relation to Chronic Kidney Disease of unknown etiology (CKDu) 1.Introduction ………. 51
2.Materials and Methods ………. 51
3. Results and Discussion 3.1. Arsenic, Cadmium, Lead, and Chromium in Rice in Sri Lanka ………. 54
3.2. L-FABP, Arsenic, Cadmium, Lead, and Chromium in Human Urine in Sri Lanka ……… 56
3.4. Pesticides in Rice in Sri Lanka ……… 62
4. Conclusions ……… 62
CHAPTER 3 The Preparation of Chicken Bone Char (CBC), and Fluoride Removal from Sri Lankan Drinking Water by Larger Sized CBC – A Community Based CBC Filter 1.Introduction ………. 65
2. Materials and Methods 2.1. Preparation of CBC, and Selecting the Best Carbonizing Temperature for the Preparation of CBC ………... 66
2.2. Fluoride Removal from Sri Lankan Drinking Water by Larger Sized CBC ..… 68
3. Results and Discussion 3.1. Selecting the Best Carbonizing Temperature for the Preparation of CBC ……. 70
3.2. Fluoride Removal from Sri Lankan Drinking Water by Larger Sized CBC 3.2.1. Operation 1 ……… 73
3.2.2. Operation 2 ……… 80
4. Conclusions ………85
CHAPTER 4 Fluoride Removal by Finer Sized Chicken Bone Char (CBC), and Regeneration of CBC 1.Introduction ………. 89
2. Materials and Methods 2.1. Preparation of Different Particle Sizes of CBC ……… 90
2.2. Investigating the Effect of Particle Size of CBC on Fluoride Removal ………... 91
2.3. Fluoride Removal by Finer Sized CBC ……… 91
2.4. Regeneration of CBC, and Fluoride Removal ………. 94
2.4.1. Experiment 1………. 95
2.4.2. Experiment 2………. 97
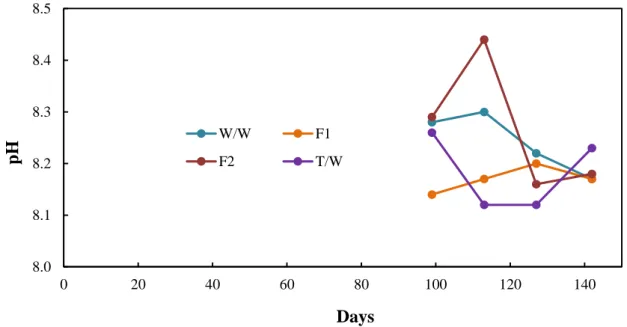
3. Results and Discussion 3.1. Investigating the Effect of Particle Size of CBC on Fluoride Removal ………. 99
3.2. Fluoride Removal by Finer Sized CBC ………. 101
3.3. Regeneration of CBC and Fluoride Removal 3.3.1. Experiment 1 ……….. 112
4. Conclusions ……….. 130
General Conclusions ……… 134
Publications ………... 136
Presentations in Academic Symposiums ……….. 137
GENERAL INTRODUCTION
Sri Lanka is an island located in the Indian Ocean just above the equator with a latitude, and longitude of 60-100 N, and 790-820 E, respectively. It covers an area of 65,610 km2. Sri Lanka is divided into two main climatic zones: The Dry Zone, and the Wet Zone, based on the amount of precipitation. Sri Lanka has a tropical climate: year-round warm weather, moderated by ocean winds, and a considerable amount of moisture, with an average annual temperature for the country as a whole range from 28ºC to 30ºC.
Groundwater is the main drinking water source of most areas in Sri Lanka. it was reported that the Sri Lankan people suffer from numerous health defects due to inadequate clean drinking water such as dental fluorosis, skeleton fluorosis, cholera, typhoid, hepatitis, and dysentery. Further, Chronic kidney disease of unknown etiology (CKDu) is an epidemic, one of the most serious health issues, recently been increasing in Sri Lanka. It is a multifactorial disease which affects severely for human health, and causes death for many people. It is believed that the hydrogeochemistry of the drinking water is the most severe factor adversely affects CKDu, as the disease is highly endemic. The water quality of Sri Lanka was investigated by analyzing pH, fluoride, nitrate, hardness, and metal concentrations in groundwater samples collected from all districts of Sri Lanka, in order to access the potential risk of groundwater against the public health, and the CKDu in Sri Lanka. Further metal contents in rice, and urine from people living in both CKDu-endemic, and non-endemic areas in Sri Lanka were analyzed to investigate the relationship between the prevalence of CKDu, and metals. In addition, pesticides in groundwater from CKDu-endemic areas, and pesticides in rice from both CKDu-endemic, and non-endemic areas were analyzed.
Dental fluorosis, and skeleton fluorosis are directly affect by the high concentration of fluoride. Further, fluoride supposed to be one of the suspicious causes for CKDu. Therefore, profound attention should be given to minimize the contamination of drinking water by fluoride in Sri Lankan groundwater. It is worth noting that the high concentration of fluoride in groundwater is not confined to Sri Lanka. Excess fluoride concentrations in groundwater have been reported in more than 20 developing, and developed countries including Sri Lanka. Groundwater is a main source of fluoride ingestion into the human body where people use groundwater for drinking, and cooking purposes. Several techniques are used all over the world in order to remove fluoride from contaminated water. Adsorption is a widely used technique to remove fluoride from contaminated water
due to cost-effectiveness, and easy operation. Among the adsorption techniques, adsorption of fluoride onto bone char is a highly effective, cost-effective, and enduring technology. Chicken bone char was investigated for fluoride removal from drinking water in this study.
The carbonizing temperature is the most important factor, when preparing chicken bone char, since it affects the efficacy of chicken bone char in removing fluoride from contaminated water. Different particle sizes of chicken bone char were investigated in relation to its adsorption capacity. The performance of larger sized chicken bone char was investigated using a community based chicken bone char filter, and the performance of finer sized chicken bone char was investigated using a laboratory scale chicken bone char filter, for defluoridation of drinking water.
The continuous usage of bone char in defluoridation causes the exhaustion of bone char media. The exhausted bone char media can either be replaced by newly processed bone char media or regenerated bone char media. Regeneration of exhausted bone char by heating is a new approach in fluoride removal from contaminated water. Heat treatment of chicken bone char was investigated as the regeneration technique because of ease operation, and cost effectiveness.
Defluoridation of drinking water is essential to avoid potential human health risks from water contaminated with fluoride. It is essential and one of the paramount environmental concerns in the world not only in Sri Lanka.
CHAPTER 1
Potential Risk of Drinking Water to Human Health in Sri Lanka in
Relation to Public Health, and Chronic Kidney Disease of unknown
etiology (CKDu)
1. Introduction
Fig. 1.1: Climatic zones of Sri Lanka
Sri Lanka is divided into two main climatic zones: The Dry Zone, and the Wet Zone, based on the amount of precipitation. Figure 1.1 shows the climatic zones of Sri Lanka. Groundwater is the main drinking water source of most areas in Sri Lanka (Dissanayake
2005), especially in the Dry Zone. Most residents obtain water for drinking, and cooking
purposes through dug wells, and tube wells (IIeperuma 1995). Numerous wells supply people with water, since surface water is difficult to obtain in most of the dry zone, even though artificial canals have been constructed by successive dynasties since ancient times. However, the water quality had not been investigated due to the civil war that lasted for more than 30 years, from 1983 to 2009. An atlas of groundwater quality published in
1985 is the latest report showing the water quality in the whole area of Sri Lanka
(Dissanayake and Weerasooriya 1985). Many residents suffer from health defects such
as dental fluorosis, skeleton fluorosis, cholera, typhoid, hepatitis, and dysentery due to the insufficient availability of clean drinking water (IIeperuma 1995; Lunge et al. 2011). Chronic kidney disease of unknown etiology (CKDu) has recently been increasing mainly in the Dry Zone of Sri Lanka (Jayasumana et al. 2015). It is a multi-factorial disease which affects severely for human health, and causes death for many people.
CKDu is one of the most serious health issues in Sri Lanka, as it has recently been increasing regularly in the North Central Province of the Dry Zone, which covers 16% (10472 km2) of the Sri Lankan landmass (Jayasumana et al. 2015). The North Central Province is inhabited by 6.2% of the Sri Lankan population; however, it has been reported that 73% of CKDu patients live in the North Central Province (Jayasumana et al. 2015). CKDu is an endemic disease that cannot be attributed to hypertension or diabetes
(Jayasumana et al. 2013). The disease was first recorded in the early 1990s. It is more
prevalent among males than females, with a ratio of 3:1, especially among males engaged in agriculture around the ages of 40–60 years (Nobel et al. 2014). Figure 1.2 shows the number of CKDu admissions as a percentage of total admissions at Anuradhapura hospital in the North Central Province. It is worth noting that the disease is not confined to Sri Lanka. Similar cases have been recorded in India, Nicaragua, Costa Rica, Central American states (Nobel et al. 2014), Uddanam, China, Serbia, Bulgaria, Romania, Croatia, and Bosnia.
Many hypotheses to explain CKDu have arisen, as follows: (1) high fluoride exposure through drinking water (Nanayakkara et al. 2012); (2) the use of aluminum containers for cooking (Jayasekara et al. 2013); (3) aflatoxins (Nobel et al. 2014); (4) ground water hardness (Jayasumana et al. 2014); (5) heavy metals contamination in rice, and/or drinking water (Redmon et al. 2014); (6) vanadium in drinking water;(7) lead, chromium, and vanadium in the soil (Jayawardana et al. 2014); (8) arsenic in drinking water
(Jayasumana et al. 2013); (9) toxic levels of cadmium in food, and drinking water
(Jayasumana et al. 2014); (10) various nucleotides; (11) uranium (Nobel et al. 2014); (12)
pesticides (WHO 2012);fertilizers (Jayasumana et al. 2015); (13) low water intake, and exposure to high temperatures, resulting in significant dehydration (Jayasumana et al.
2014); (14) climate, and hydrogeochemistry (Redmon et al. 2014); (15) soil geochemistry
(Jayawardana et al. 2014);(16) the usage of ayurvedic medicine; (17) selenium deficiency
conclusive evidence has not yet been obtained, as detailed investigation was hindered by the civil war that lasted 30 years, and the unavailability of analytical instruments in Sri Lanka.
Fig. 1.2: Number of CKDu admissions as a percentage of total admissions at Anuradhapura hospital in the North Central Province (Chandrajith et al. 2011)
It is believed that the hydrogeochemistry of drinking water is the most severe factor adversely affect CKDu in Sri Lanka. Further, it was reported that the Sri Lankan people suffer from numerous health defects due to inadequate clean drinking water. Therefore, in this research, our attention was focused on the groundwater quality of Sri Lanka in order to evaluate potential risk against the public health, and CKDu. Accordingly, this research focused on pH, fluoride, nitrate, hardness, and metal concentrations of well water in Sri Lanka.
2. Materials and Methods
Water samples were collected from both dug wells, and tube wells in all districts of Sri Lanka from 2010 to 2015 to determine the water quality. Figure 1.3 shows the districts of Sri Lanka, and Figure 1.4 shows the locations from which samples were collected for analysis. 1304 samples were collected for the analysis of pH, fluoride, nitrate, hardness, aluminum, and manganese. 1435 samples were collected for the analysis of arsenic, cadmium, lead, and chromium. Table 1.1, and Table 1.2 show the number of well water samples collected in each Sri Lankan district. The wells including dug wells, and tube wells were selected randomly, and the locations were identified by GPS. The depth of
0.0 0.5 1.0 1.5 2.0 2.5 1990 1995 2000 2005 2010 CKD admiss ion( % ) Year
wells was typically 5 m -10 m for dug wells, and sometimes more than 20 m for tube wells. Water samples were filtrated on site, using a membrane filter with a pore size of 0.45 µm to terminate bacterial activities which alter the water quality in samples. With this filtration, water quality was confirmed to be stabilized for more than 1 year at ambient temperature. The transportation of water samples from Sri Lanka to Japan took about 1-4 days after collection.
The pH value of well water was measured using a glass electrode method with a pH meter (Beckman Coulter, Inc., Model Ф260 and the STAR electrode 511070) after the samples were taken to Japan. The pH values indicated are the values after establishing the equilibrium between the solution and the atmosphere. Anions and cations were analyzed using ion chromatography (for anions: Dionex ICS-2000, separation column IonPac AS18, eluent KOH 23-40 mmol/l (gradient), suppressor ASRS 300 4mm; for cations: Dionex ICS-1500, separation column IonPac CS12, eluent methanesulfonic acid 30 mmol/l (isocratic), suppressor CSRS 500 4mm). The metal concentration of well water was analyzed by ICP-OES (Perkin Elmer Optima 5300) or ICP-MS (Agilent 7700). The data analysis, and graphing software, ORIGIN 9.1, was used to create the spatial distribution maps to represent the analyzed data. The MANDARA, and the QGIS software programs were used to create the location maps.
Fig. 1.4: Sampling locations in Sri Lanka
Table 1.1: Number of well water samples collected in each Sri Lankan district for the analysis of pH, fluoride, nitrate, hardness, aluminum, and manganese
District No. of samples District No. of samples
Ampara 66 Kurunegala 32 Anuradhapura 187 Mannar 32 Badulla 65 Matale 61 Batticaloa 30 Matara 75 Colombo 25 Moneragala 141 Galle 86 Mullaitivu 23 Gampaha 25 NuwaraEliya 8 Hambantota 142 Polonnaruwa 56 Jaffna 23 Puttalam 28 Kalutara 31 Ratnapura 30 Kandy 25 Trincomalee 28 Kegalle 30 Vavuniya 30 Kilinochchi 25 Total 1304
Table 1.2: Number of well water samples collected in each Sri Lankan district for the analysis of arsenic, cadmium, lead, and chromium
District No. of samples District No. of samples
Ampara 66 Kurunegala 32 Anuradhapura 228 Mannar 32 Badulla 65 Matale 151 Batticaloa 30 Matara 75 Colombo 25 Moneragala 141 Galle 86 Mullaitivu 23
Gampaha 25 Nuwara Eliya 8 Hambantota 142 Polonnaruwa 56 Jaffna 23 Puttalam 28 Kalutara 31 Ratnapura 30 Kandy 25 Trincomalee 28 Kegalle 30 Vavuniya 30 Kilinochchi 25 Total 1435
3. Results and Discussion 3.1. pH
The pH of land water usually ranges from 6.5 to 8.5, while the pH value in Sri Lankan well water ranged from 3.7 to 10.6. Figure 1.5 shows the frequency distribution of pH values in Sri Lankan well water. We found that 21.7% of well water contained a pH value lower than 7, and 78.2% of well water contained a pH value higher than 7. Figure 1.6 shows the spatial distribution of the pH of well water in Sri Lanka. It is obvious that most Sri Lankan well water has a basic condition, except for well water located in the Wet Zone. This is due to the dissolution of basic ions from the surface soil or underground soil to underground water, the source of well water. The number of well water with a pH value lower than 5 was 14, out of which 10 wells had a higher nitrate concentration than 10 mg/l. The lower pH could be attributed to the agricultural activity.
Fig. 1.5: Frequency distribution of pH values in Sri Lankan well water
Fig. 1.6: Spatial distribution of pH values in Sri Lankan well water
0 100 200 300 400 500 600 700 3.0-4.0 4.0-5.0 5.0-6.0 6.0-7.0 7.0-8.0 8.0-9.0 9.0-10.0 10.0-11.0 F re q u en cy pH pH
3.2. Fluoride
Fluoride is an essential element for human life. This element causes the mineralization processes of bones, and teeth, cementing crystals to provide more strength, and hardness
(Singh et al. 2001). An excess amount of fluoride intake causes human health hazards
such as dental fluorosis, skeleton fluorosis (Yadav et al. 2006), increased rates of urolithiasis (kidney stones), impaired thyroid function, and lower intelligence in children
(Loganathan et al. 2013). Fluoride is mainly ingested into the human body through
drinking water (Loganathan et al. 2013). The WHO guideline for fluoride in drinking water is less than 1.5 mg/l (WHO 2011), while the Sri Lankan standard for fluoride in drinking water is less than 1.0 mg/l (Sri Lankan Standard Institute 2013). This is because the amount of intake water is larger in Sri Lanka than that in the moderate countries due to the tropical climate.
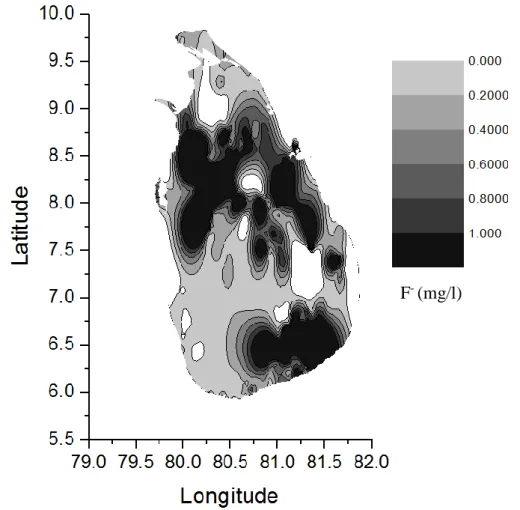
The maximum, and average fluoride concentrations in the well water of each district, and the standard deviation are summarized in Table 1.3. The highest concentration of fluoride, 7.0 mg/l, was recorded in the Anuradhapura District, followed by 6.8 mg/l in the Moneragala District. The samples from Anuradhapura, and Moneragala exceeded the average fluoride concentration of 1.0 mg/l. High values in the standard deviation represent the high variation of fluoride concentrations of each well, even among wells within the same district. The fluoride concentration of well water in Sri Lanka ranged from 0 to 7.0 mg/l. Eighty percent of wells contained a fluoride concentration of 0–1.0 mg/l, 10.1% of wells contained 1.0–1.5 mg/l of fluoride, and 9.9% contained a fluoride concentration of more than 1.5 mg/l. Figure 1.7 shows the frequency distribution of fluoride concentrations in Sri Lankan well water. Figure 1.8 shows the spatial distribution of fluoride in well water. High concentration of fluoride was found in the Dry Zone of Sri Lanka. Dental fluorosis, skeleton fluorosis, and CKDu are highly prevalent in the Dry Zone of Sri Lanka. Dental fluorosis, and skeleton fluorosis are directly affected by the high concentration of fluoride. 90% of 15 years old school children was reported to suffer from dental fluorosis in the Anuradhapura District belongs to the Dry Zone of Sri Lanka
(Tennakoon 2004). Further, fluoride was supposed to be a suspicious cause for CKDu
(Nanayakkara et al. 2012).
Table 1.3: Fluoride concentrations in the well water of each Sri Lankan district District Maximum Value (mg/l) Average Value (mg/l) Standard Deviation (mg/l) District Maximum Value (mg/l) Average Value (mg/l) Standard Deviation (mg/l) Ampara 5.8 0.80 1.00 Kurunegala 5.0 0.70 1.20 Anuradhapura 7.0 1.10 0.90 Mannar 1.2 0.40 0.40 Badulla 2.3 0.60 0.50 Matale 2.6 0.40 0.60 Batticaloa 0.7 0.20 0.20 Matara 0.6 0.10 0.10 Colombo 0.1 0.00 0.00 Moneragala 6.8 1.40 1.30 Galle 5.8 0.10 0.60 Mullaitivu 0.4 0.10 0.10 Gampaha 0.1 0.00 0.00 Nuwara Eliya 0.1 0.04 0.03 Hambantota 2.3 0.60 0.40 Polonnaruwa 3.4 0.80 0.70 Jaffna 1.3 0.20 0.20 Puttalam 2.2 0.30 0.40 Kalutara 0.7 0.10 0.10 Ratnapura 0.2 0.10 0.10 Kandy 0.4 0.20 0.10 Trincomalee 2.4 0.80 0.70 Kegalle 0.3 0.10 0.10 Vavuniya 3.1 0.80 0.60 Kilinochchi 1.3 0.20 0.30
Fig. 1.7: Frequency distribution of fluoride concentrations in Sri Lankan well water
0.0 0.2 0.4 0.6 0.8 1.0 1.2 0 1 2 3 4 5 6 7 8 9 Re lative c u m u lative f re q u en cy F-(mg/l)
Fig. 1.8: Spatial distribution of fluoride concentrations in Sri Lankan well water
3.3. Nitrate
The WHO guideline for nitrate in drinking water is 50 mg/l (WHO 2011). An excess amount of nitrate, more than 50 mg/l, causes blue baby syndrome in infants (Gutierrez et
al. 2014). Nitrate is reduced into nitrite in the stomach by nitrate-reducing bacteria. Nitrite
binds with hemoglobin to produce methemoglobin, which obstructs oxygen transportation; hence, the baby falls into cyanosis (Mary et al. 1951). A nitrate concentration of more than 50 mg/l in groundwater also causes health issues such as cancer (Smith and Kellman 2011), cardiac defects (Cedergren et al. 2002), acute and chronic neurotoxicity, lung damage, chemical burns, immunological abnormalities, adverse reproductive, and developmental effects (Weisenburger 1993), adverse pregnancy outcomes, diabetes, thyroid disorders (Ward 2011). Nitrate is usually detected
in water sources when groundwater is contaminated by nitrogenous fertilizer (Fan 2011)
or by septic tank effluents (Rios et al. 2013).
The Sri Lankan standard for nitrate in drinking water is less than 50 mg/l (Sri Lankan
Standard Institute 2013), and the nitrate concentrations in Sri Lankan well water ranged
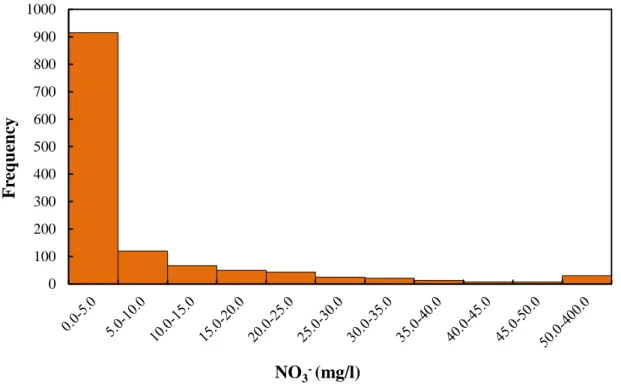
from 0 to 366 mg/l. Figure 1.9 shows the frequency distribution of nitrate concentrations in Sri Lankan well water. Nitrate concentrations higher than 50 mg/l were found in 2.2% of the sampled wells. The maximum value, the average value, and the standard deviation for nitrate concentrations in the well water of each district are shown in Table 1.4. Water in 13 out of 25 districts had a maximum nitrate concentration of more than 50 mg/l. The highest concentration of nitrate, 366 mg/l, was found in the Puttalam District. High concentrations of nitrate were also found in Mannar, Anuradhapura, Hambantota, Jaffna, Vavuniya. Figure 1.10 shows the spatial distribution of nitrate in Sri Lanka. The Puttalam, Jaffna, and Mannar Districts belong to the coastal zone of Sri Lanka, which consists of sandy soil (Survey Department 1967). Wells that showed a high concentration of nitrate in these areas were located on the soil type “sandy regosols on recent beach, and dune sands” (Survey Department 1967). Figure 1.11 shows the soil map of Sri Lanka (Based upon the maps of the Survey Department of Sri Lanka with the sanction of the Survey General). Agricultural activities on sandy soil may be a reason for the high contamination of nitrate in well water in the above districts, while the high concentration of nitrate found in Vavuniya could be from septic tank, since there are no dense agricultural activities in this area.
In a similar study done by C.B. Dissanayake, and S.V.R. Weerasooriya in 1985, the highest nitrate concentration in groundwater was recorded in Jaffna. This was due to the abundance of nitrogenous waste matter in the form of human excreta, synthetic and animal fertilizer reaching the shallow groundwater table (Dissanayake and Weerasooriya
1985).
In another detailed study about the groundwater quality in Jaffna performed by Gunasekeram in 1983 mentioned that 80 % of well waters were contaminated with fecal coliform, and he highlighted human excreta as the major factors responsible for the nitrate contamination in Jaffna. He also pointed out that excessive amount of urea was used on crop cultivations such as chili, onion, and further cattle manure was commonly used in cultivation purposes (Gunasekeram 1983). Sutharsiny et al. pointed out that there was a high risk of blue baby syndrome in Jaffna peninsula (Sutharsiny et al. 2014).
Fig. 1.9: Frequency distribution of nitrate concentrations in Sri Lankan well water
Table 1.4: Nitrate concentrations in the well water of each Sri Lankan district
District Maximum Value (mg/l) Average Value (mg/l) Standard Deviation (mg/l) District Maximum Value (mg/l) Average Value (mg/l) Standard Deviation (mg/l) Ampara 33 3 7 Kurunegala 22 2 5 Anuradhapura 131 6 15 Mannar 135 15 30 Badulla 47 4 8 Matale 53 8 13 Batticaloa 44 8 13 Matara 53 9 12 Colombo 37 13 10 Moneragala 82 4 10 Galle 37 8 8 Mullaitivu 51 12 15 Gampaha 58 18 14 Nuwara Eliya 10 5 4 Hambantota 128 2 13 Polonnaruwa 19 1 3 Jaffna 110 19 26 Puttalam 366 42 90 Kalutara 19 7 5 Ratnapura 28 11 9 Kandy 18 5 5 Trincomalee 79 7 16 Kegalle 35 5 8 Vavuniya 102 27 29 Kilinochchi 55 13 15 0 100 200 300 400 500 600 700 800 900 1000 F re q u en cy NO3-(mg/l)
Fig. 1.10: Spatial distribution of nitrate concentrations in Sri Lankan well water NO3- (mg/l)
Fig. 1.11: Soil map of Sri Lanka
*Based upon the maps of the Survey Department of Sri Lanka with the sanction of the Survey General
3.4. Hardness
Permanent hardness occurs due to the dissolution of magnesium, and calcium salts in water. Hardness causes scale on cooking utensils, which decreases the efficiency of heat transfer (Ras and Ghizellaoui 2012). It was reported that no relationship was found between water hardness, and occurrence of cardiovascular diseases, and cancers (Lou et
al. 2007), while another report mentioned that magnesium, and calcium ions, which cause
water hardness, were found to cause cardiovascular diseases and health defects in humans
(Lerga and O’Sullivan 2008). A study conducted in Osaka Prefecture, Japan, with 44
municipalities, concluded that water hardness may increase the risk of atopic dermatitis among elementary school children in Japan (Miyake et al. 2004). At the same time, hardness causes bad taste due to the bitterness that comes from magnesium (Hashimoto
et al. 1987). It has been believed that hardness does not directly affect human health
(Verissimo et al. 2007), however suspected the potential risk of CKDu by hardness. The
degree of hardness is categorized as shown in Table 1.5 (Verissimo et al. 2007). Ion concentrations of Ca, and Mg in mg/l are converted to express hardness as anequivalent of CaCO3 mg/l by using the following equation.
CaCO3 = (Ca/40.1+Mg/24.3) * 100 (mg/l)
Table 1.5: Categories of hardness
Category of Hardness Range of Value (CaCO3 mg/l)
Soft CaCO3< 60 mg/l
Moderately hard 60 mg/l<= CaCO3 < 120 mg/l Hard 120 mg/l<= CaCO3 < 180 mg/l
Very hard 180 mg/l<= CaCO3
Figure 1.12 shows the frequency distribution of hardness in Sri Lankan well water. According to the analysis, 26.9% of well water was soft, 15.0% was moderately hard, 15.8% was hard, and 42.2% was very hard. Generally, we can conclude that Sri Lankan well water is very hard. The water hardness in each Sri Lankan district is represented in Table 1.6. The highest recorded value of hardness in Sri Lanka was in the Hambantota District. High values were also recorded in Anuradhapura, and Jaffna. When we consider the maximum value of hardness, the well water was very hard in all but except 5 out of
25 districts. When we consider the average values of hardness, a hardness concentration below 60 mg/l was shown only in well water in Colombo, Galle, Gampaha, Kalutara, and Nuwara Eliya, which belong to the Wet Zone of Sri Lanka.
Figure 1.13 shows the spatial distribution of hardness of Sri Lankan well water. It is clear that districts in the Dry Zone had high concentrations of hardness, and districts in the Wet Zone had considerably lower hardness concentrations. In the Dry Zone, due to limited rainfall and high temperatures, excessive evaporation is taking place, and the accumulation of salts in the soil is occurring, leading to high hardness concentrations in groundwater. Since CKDu is highly prevalence in the Dry Zone of Sri Lanka, our result coincided with the research by Jayasumana et al. indicating that hardness was supposed to be one of the suspicious causes for CKDu(Jayasumana et al. 2014).
Fig. 1.12: Frequency distribution of hardness in Sri Lankan well water
0.00 0.05 0.10 0.15 0.20 0.25 0.30 0.35 0.40 0.45
Soft Moderately hard Hard Very hard
Re lative f re q u en cy Categories of Hardness
Table 1.6: Hardness concentrations in the well water of each Sri Lankan district District Maximum (CaCO3 mg/l) Average (CaCO3 mg/l) Standard Deviation (CaCO3 mg/l) District Maximum (CaCO3 mg/l) Average (CaCO3mg/l) Standard Deviation (CaCO3 mg/l) Ampara 362 135 78 Kurunegala 423 169 101 Anuradhapura 1373 283 158 Mannar 647 280 141 Badulla 495 140 107 Matale 494 120 96 Batticaloa 319 163 77 Matara 341 80 87 Colombo 132 31 31 Moneragala 891 244 159 Galle 232 34 37 Mullaitivu 619 172 140 Gampaha 110 20 24 Nuwara Eliya 149 36 50 Hambantota 1734 293 246 Polonnaruwa 980 231 192 Jaffna 1080 354 190 Puttalam 749 329 174 Kalutara 317 38 65 Ratnapura 174 63 52 Kandy 400 144 88 Trincomalee 581 254 137 Kegalle 166 69 51 Vavuniya 665 333 160 Kilinochchi 615 236 137
Fig. 1.13: Spatial distribution of hardness in Sri Lankan well water
3.5. Metals 3.5.1. Aluminum
Aluminum is the third most abundant element in the earth’s crust (Zawilla et al. 2014;
Gupta 2007). It is a light weight metal, and could be toxic to humans (Kumar and Gill
2014), causing various health defects or death, because it crosses the blood–brain barrier,
and the placental barrier and produces neurotoxicity, and development toxicity (Gupta
2007). Water contaminated with a high concentration of aluminum may cause cognitive
decline, and dementia. It also affects normal bone metabolism (Aslam et al. 2009), impairs mitochondrial bioenergetics, and may lead to the generation of oxidative stress
(Kumar and Gill 2014) as well as several brain diseases, including dialysis
encephalopathy, amyotrophic lateral sclerosis, Parkinson’s disease dementia, Alzheimer’s disease, and multiple sclerosis. It can also lead to cancerssuch as those of
the bladder, lung, kidney, pancreas, and brain, and it increases the risk of leukemia
(Crisponi et al. 2012). Other health defects resulting from exposure to aluminum include
microcytic anemia, metastatic extra skeletal calcification (Savory et al. 1985), and effects on the immune function of humans (Zhu et al. 2014).
The WHO guideline for aluminum in drinking water is 200 µg/l which sets considering the taste, odour, and appearance (WHO 2011). The Sri Lankan standard for aluminum is the same as the WHO guideline, and also sets considering the taste, odour, and appearance
(Sri Lankan Standard Institute 2013). Aluminum concentration in Sri Lankan well water
ranged from 0 to 1457 µg/l. We found that 2.3% of well water samples had an aluminum concentration of more than 200 µg/l. The maximum value, and the average value of aluminum concentration obtained from each district are summarized in Table 1.7. The maximum aluminum concentration value was found in Moneragala; Mannar, Matara, and Kilinochchi also had high values of aluminum. In all but 11 districts, the maximum aluminum concentration exceeded the Sri Lankan standard as well as WHO guideline of 200 µg/l. No district reported an average aluminum concentration of more than 200 µg/l.
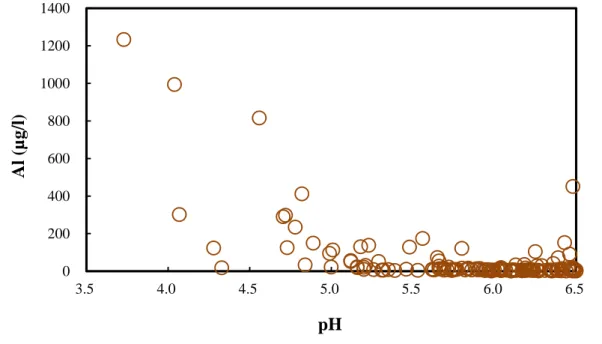
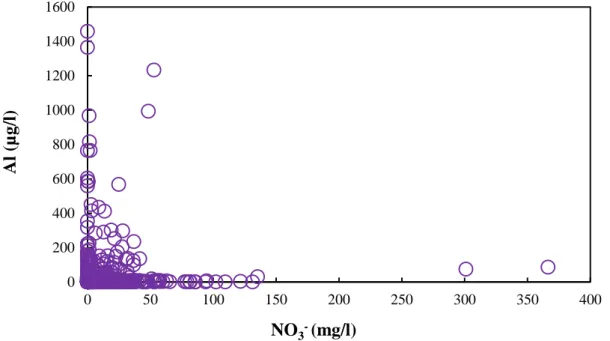
Figure 1.14 shows the spatial distribution of aluminum in well water. According to the graphical software although the spatial distribution map shows dense areas of high concentration of aluminum in the northern, and southern part of the Sri Lankan map, only few sampling locations are there with high concentration of aluminum. When comparing the pH values of well water having pH value of less than 6.0, and the aluminum concentrations of well water as indicated in Figure 1.15, it is clear that the aluminum concentration sharply decreased with increased pH. Further, the relationship between aluminum concentrations, and the nitrate concentrations in well water were studied since low pH accounted to high nitrate concentrations in well water. Figure 1.16 shows the relationship between aluminum concentrations, and the nitrate concentrations in Sri Lankan well water. There was no relationship between aluminum concentrations, and the nitrate concentrations in well water.
Table 1.7: Aluminum concentrations in the well water of each Sri Lankan district District Maximum Value (µg/l) Average Value (µg/l) District Maximum Value (µg/l) Average Value (µg/l) Ampara 765 48 Kurunegala 559 19 Anuradhapura 135 5 Mannar 1364 46 Badulla 117 7 Matale 89 5 Batticaloa 252 19 Matara 1233 43 Colombo 567 47 Moneragala 1457 25 Galle 815 43 Mullaitivu 284 39 Gampaha 151 34 Nuwara Eliya 275 58 Hambantota 604 10 Polonnaruwa 57 3 Jaffna 10 0 Puttalam 86 11 Kalutara 434 33 Ratnapura 297 17 Kandy 18 3 Trincomalee 25 3 Kegalle 84 7 Vavuniya 40 4 Kilinochchi 966 43
Fig. 1.14: Spatial distribution of aluminum concentrations in Sri Lankan well water
Fig. 1.15: Relationship between Al concentrations and pH in Sri Lankan well water
0 200 400 600 800 1000 1200 1400 3.5 4.0 4.5 5.0 5.5 6.0 6.5 Al (µg/ l) pH Al (µg/l)
Fig. 1.16: Relationship between Al concentrations and NO3- concentrations in Sri Lankan well water
3.5.2. Manganese
Manganese is an element essential to humans. Manganese is naturally ubiquitous in the environment, and can be found in many types of rocks, soil, water, air, and food (Rollin 2011). However, excessive exposure to manganese cause toxicity (Yazbeck 2011), and health defects. Toxic levels of manganese are experienced through occupational exposure, and through exposure to contaminated groundwater. Such exposure causes human health defects at the acute level, chronic level, and sub-clinical level (Hess et al. 2015). One of the harmful effects of manganese is neurotoxic damage (Viana et al. 2014), because the half-life of manganese in the human brain is longer than that in other organs; hence, manganese is selectively retained in the brain, and causes central nervous system disorders, myasthenia, and manganese-induced Parkinsonism. Manganese also causes breathing discomfort, coughing, psychiatric symptoms
(Yoon and Ahn 2014), and neuropsychiatric symptoms associated with the risk of alcohol-use
disorders (Sassine et al. 2002). It affects reproductive, cardiovascular, hematological, endocrine, and immunological systems (Lucchini et al. 2015), as well as neonatal birth weight, head, and chest circumferences (Tsai et al. 2015), and night blindness in exposed children (Hess
et al. 2015). 0 200 400 600 800 1000 1200 1400 1600 0 50 100 150 200 250 300 350 400 Al (µg/ l) NO3-(mg/l)
The Sri Lankan standard for manganese in drinking water is 100 µg/l (Sri Lankan Standard
Institute 2013). The WHO guideline for manganese in drinking water is 400 µg/l which was
set by considering taste, odour, and appearance (WHO 2011). The manganese concentration in Sri Lankan well water ranged from 0 to 9772 µg/l. Figure 1.17 shows the frequency distribution of manganese concentrations in Sri Lankan well water. We found that 14.1% of well water samples had manganese concentrations of more than 100 µg/l, and 3.6% of well water samples had manganese concentrations of more than 400 µg/l. The maximum, and average values obtained for manganese concentrations in each district are summarized in Table 1.8. A maximum manganese concentration value of 9772 µg/l was found in Polonnaruwa; manganese concentration values exceeding 1000 µg/l were recorded in Ampara, Kurunegala, Hambantota, Kandy, Matara, Anuradhapura, and Matale. The average manganese concentration values in samples from 5 districts exceeded the Sri Lankan standard of 100 µg/l, and those from 1 district exceeded the WHO standard of 400 µg/l.
Figure 1.18 shows the spatial distribution of manganese concentrations in well water. When we compared the analyzed manganese concentrations of well water with the Sri Lankan soil map (Figure 1.11), we could not identify any relationship between the manganese concentration, and the soil type.
Fig. 1.17: Frequency distribution of manganese concentrations in Sri Lankan well water
0.0 0.2 0.4 0.6 0.8 1.0 1.2 0 2000 4000 6000 8000 10000 12000 Re lative c u m u lative f re q u en cy Mn (µg/l)
Table 1.8: Manganese concentrations in the well water of each Sri Lankan district District Maximum Value (µg/l) Average Value (µg/l) District Maximum Value (µg/l) Average Value (µg/l) Ampara 6068 192 Kurunegala 2479 219 Anuradhapura 1532 37 Mannar 353 56 Badulla 858 68 Matale 1058 58 Batticaloa 94 8 Matara 1796 80 Colombo 394 61 Moneragala 803 46 Galle 366 39 Mullaitivu 484 69 Gampaha 285 45 Nuwara Eliya 601 96 Hambantota 2346 144 Polonnaruwa 9772 440 Jaffna 216 20 Puttalam 79 19 Kalutara 148 31 Ratnapura 385 69 Kandy 2018 170 Trincomalee 219 15 Kegalle 349 38 Vavuniya 599 34 Kilinochchi 489 58
Fig. 1.18: Spatial distribution of manganese concentrations in Sri Lankan well water
3.5.3. Arsenic
Arsenic ranks as the 20th most abundant trace element which presents only in minute amounts in the earth’s crust, 14th in sea water, and 12th in the human body (Singh et al.
2015). The primary source of arsenic in the environment is arsenic-enriched minerals
(Singh et al. 2015), and a frequent source of human exposure to inorganic arsenic is
through contaminated groundwater (Finley 2014). It has been reported that contamination of drinking water by arsenic has threaten to more than 150 million people all over the world (Singh et al. 2015).
Long-term exposure to arsenic causes various health effects on humans. Arsenic is a class 1 human carcinogen, which is identified as the second most important global health concern in groundwater contamination after the contamination by pathogenic organisms
(Chappells et al. 2015). In addition to cancer, arsenic causes birth-related risks such as lower birth weight, earlier delivery, smaller neonatal size in exposed mothers, and their fetuses (Bloom et al. 2014), and neural tube defects (Jin et al. 2013);italso causesdefects in cardiovascular, integumentary, digestive, endocrine, and pulmonary systems in humans (Finley 2014). The WHO deemed that the contamination of groundwater by arsenic in Bangladesh is “the largest mass poisoning of a population in history” where the arsenic concentration in groundwater was reported to be10–1000 µg/l (Singh et al. 2015).
According to Sri Lankan standards (Sri Lankan Standard Institute 2013), and World Health Organization (WHO) guidelines (WHO 2011), the maximum permissible level of arsenic in drinking water is 10 µg/l. Table 1.9 shows the arsenic concentration in the well water of each Sri Lankan district. The maximum, and average values, and the standard deviation of each district are given. Figure 1.19 shows the distribution of arsenic concentrations in Sri Lankan well water. The Mannar, Puttalam, Batticaloa, and Mullaitivu Districts reported maximum arsenic concentrations that are higher than the Sri Lankan standard, and the WHO guideline. Figures 1.20, 1.21, 1.22, and 1.23 respectively show the distribution of arsenic concentrations in Sri Lankan well water in Mullaitivu, Mannar, Puttalam, and Batticaloa Districts. Mannar District recorded the highest concentration, reaching 66 µg/l. These districts also exhibit high standard deviation values that show high variations in arsenic concentrations, even among wells within the same district. However, the average arsenic concentrations in all other districts were less than 10 µg/l.
As the incidence of CKDu has risen, it has been thought that arsenic is one cause of CKDu. Based on their analysis of 226 fertilizer samples collected from Padaviya, Medawachchiya, Mahawilachchiya, and Anuradhapura in the North Central Province of Sri Lanka, Jayasumana et al. (2015) found that phosphate fertilizers were a major source of inorganic arsenic in CKDu-endemic areas. Additionally, they reported that triple super phosphate contained the highest amounts of arsenic, and rock phosphate produced at Eppawala, a mining area in the North Central Province, contained the second highest levels of arsenic.
Jayasumana et al. (2013) reported that abnormal spotty pigmentation observed in the palms, and soles of CKDu patients in the Padavi Sri Pura Divisional Secretariat area of the Trincomalee District in the Eastern Province of Sri Lanka was due to chronic arsenic toxicity; thus, arsenic could be a cause of CKDu. Furthermore, the authors have reported
that pesticides, and fertilizers used excessively in paddy farming are the most likely sources of arsenic in the study area. On the contrary, we have detected in our study that there was no high concentration of arsenic in the well water of CKDu-prevalent districts. High concentrations of arsenic that exceeded the Sri Lankan standard, and WHO guideline were detected in well water in areas other than CKDu-endemic areas; Mannar, Puttalam, Batticaloa, and Mullaitivu. In addition, Wasana et al. (2012) assessed the water quality of 60 samples from areas with high, and low prevalences of CKDu in Sri Lanka, and reported that the arsenic level in the water was well below the WHO guideline of 10 µg/l. Water quality analysis of 234 different sources of water from CKDu-endemic, and non-endemic areas of Sri Lanka conducted by the World Health Organization demonstrated that arsenic concentrations were borderline in just four samples; 9.9 µg/l, 10.2 µg/l, 10.5 µg/l, and 13.4 µg/l, in the endemic area (WHO 2012). These results coincide with our research, which shows low concentrations of arsenic in well water.
When we consider the soil map of Sri Lanka that categorizes soil into 21 types (Figure 1.11), it is clear that all of the wells with arsenic concentrations higher than 10 µg/l were located on the soil type of “sandy regosols on recent beach, and dune sands” (Survey
Department 1967), indicating that the arsenic had a geological origin. In Sri Lanka,
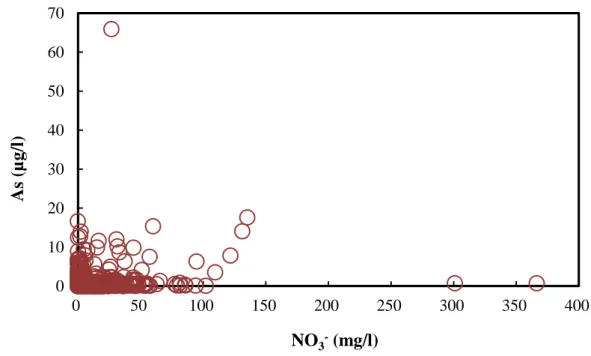
farmers use a lot of amount of fertilizer on the sandy soil due to low retention, causing nitrate contamination in well waters. Figure 1.24 shows the relationship between arsenic concentration, and nitrate concentration in Sri Lankan well water. It indicates that there is no relationship between them; hence, high concentration of arsenic did not come from nitrogenous fertilizer but from a geological reason.
Fortunately, no chronic diseases caused by arsenic have been reported in Sri Lanka so far, however; in several districts there are risks to occur adverse effects by arsenic in near future. Accordingly, we could conclude that arsenic in well water is not a cause of CKDu.
Table 1.9: Arsenic concentrations in the well water of each Sri Lankan district District Maximum Conc. (µg/l) Average Conc. (µg/l) Standard Deviation (µg/l) District Maximum Conc. (µg/l) Average Conc. (µg/l) Standard Deviation (µg/l) Ampara 2 1 0.5 Kurunegala 1 0 0.1 Anuradhapura 3 0 0.4 Mannar 66 7 11.7 Badulla 1 0 0.3 Matale 2 0 0.3 Batticaloa 14 3 3.2 Matara 4 0 0.6 Colombo 0 0 0.1 Moneragala 2 0 0.4 Galle 0 0 0.1 Mullaitivu 13 3 3.7 Gampaha 0 0 0.1 Nuwara Eliya 0 0 0.0 Hambantota 3 1 0.6 Polonnaruwa 3 0 0.5 Jaffna 6 2 1.7 Puttalam 15 4 4.1 Kalutara 3 0 0.6 Ratnapura 0 0 0.1 Kandy 0 0 0.1 Trincomalee 9 1 1.7 Kegalle 0 0 0.1 Vavuniya 2 1 0.6 Kilinochchi 2 1 0.6
Fig. 1.19: Distribution of arsenic concentrations in Sri Lankan well water X<10
10≦X<50 50≦X As (µg/l)
Fig.1.20: Distribution of arsenic concentrations in well water in Mullaitivu District in Sri Lanka
Fig.1.21: Distribution of arsenic concentrations in well water in Mannar district in Sri Lanka
Fig.1.22: Distribution of arsenic concentrations in well water in Puttalam district in Sri Lanka
Fig.1.23: Distribution of arsenic concentrations in well water in Batticaloa district in Sri Lanka
Fig. 1.24: Relationship between arsenic concentration and nitrate concentration in Sri Lankan well water
3.5.4. Cadmium
Cadmium is a non-nutritive (Roberts 2014), toxic, heavy metal (Averbeck and Bertin
2006) which occurs naturally in earth’s crust and oceans. Collectively it is added to soil
through natural sources as well as anthropogenic sources. As natural sources we can define forest fire, volcanic eruption, weathering of cadmium-containing phosphate rocks, soil erosion, and air pollution. As anthropogenic sources mining, and smelting of zinc-bearing ores, fossil fuel combustion, fertilizers derived from phosphate rocks, waste incineration, sewage sludge, irrigation waters can be defined (Roberts 2014). Cadmium can be easily contaminated groundwater (Rehman et al. 2015), and air (Averbeck and
Bertin 2006). Smoking is also a possible source of cadmium exposure since tobacco
leaves naturally accumulate high levels of cadmium (Roberts 2014). Toman, and his researchers reported that some dairy, and meat products are also acting as sources of cadmium (Toman et al. 2005). International Agency for Research on Cancer has listed cadmium as a Group 1 human carcinogen, and World Health Organization for smoke delivery reporting and recommended for regulatory policy in a subsequent report has selected cadmium as a priority toxicant (Piade et al. 2015). In the aquatic system it is one of the most abundant toxins (Tawwab and Wafeek 2014).
0 10 20 30 40 50 60 70 0 50 100 150 200 250 300 350 400 As ( µ g/l ) NO3-(mg/l)
The Sri Lankan standard for cadmium in drinking water is 3 µg/l (Sri Lankan Standard
Institute 2013), which is similar to the WHO guideline for cadmium in drinking water
(WHO 2011). Cadmium causes adverse health effects in humans due to its long half-life
of 15–20 years in the human body (Averbeck and Bertin 2006), and its rapid uptake and accumulation through food chains. Cadmium poisoning’s adverse effect on human health, itai-itai disease, was first reported in Japan (Roberts 2014) in 1912 (Liu et al. 2015) in subsistence farmers who had grown rice with water contaminated by mining waste. The disease resulted in the softening of bones, and kidney failure (Roberts 2014). Mainly cadmium causes negative health effects on kidneys, and bones. It also responsible for human cancers in lungs, pancreas, breast, prostate, endometrium, urinary bladder (Piade
et al. 2015), testes (Averbeck and Bertin 2006), adverse effects on hemoglobin (Chen et
al. 2015), obstructive airway disease, emphysema, irreversible renal failure,
immune-suppression in chronic exposure, diabetic, deregulated blood pressure, DNA damage
(Averbeck and Bertin 2006), pulmonary, and cardiovascular defects (Roberts 2014).
Researches up to date investigated that cadmium is one of the causes for CKDu (WHO
2012).
Table 1.10 shows the concentrations of cadmium in the well water of each district in Sri Lanka as the maximum value, the average value, and the standard deviation. No district exceeded the 3 µg/l cadmium concentration in well water; even the highest concentration recorded from the Moneragala District was 0.5 µg/l, well below the Sri Lankan standard, and the WHO guideline. Therefore, according to the analytical results of 1435 well water samples, there is no relationship between cadmium contamination in water, and CKDu.
Table 1.10: Cadmium concentrations in the well water of each Sri Lankan district District Maximum Conc. (µg/l) Average Conc. (µg/l) Standard Deviation (µg/l) District Maximum Conc. (µg/l) Average Conc. (µg/l) Standard Deviation (µg/l) Ampara 0.1 0.01 0.02 Kurunegala 0.0 0.00 0.00 Anuradhapura 0.2 0.01 0.03 Mannar 0.1 0.02 0.07 Badulla 0.1 0.01 0.02 Matale 0.3 0.02 0.04 Batticaloa 0.2 0.01 0.03 Matara 0.1 0.01 0.01 Colombo 0.0 0.00 0.00 Moneragala 0.5 0.01 0.04 Galle 0.2 0.01 0.02 Mullaitivu 0.3 0.02 0.07 Gampaha 0.0 0.01 0.00 Nuwara Eliya 0.0 0.00 0.00 Hambantota 0.1 0.01 0.01 Polonnaruwa 0.0 0.01 0.01 Jaffna 0.1 0.02 0.04 Puttalam 0.0 0.00 0.00 Kalutara 0.0 0.00 0.00 Ratnapura 0.1 0.00 0.02 Kandy 0.0 0.00 0.00 Trincomalee 0.0 0.00 0.01 Kegalle 0.0 0.00 0.00 Vavuniya 0.1 0.01 0.01 Kilinochchi 0.1 0.01 0.02
A study conducted by Jayatilake et al. (2013), based on water samples collected from CKDu-endemic, and non-endemic areas in Sri Lanka, concluded that drinking water has not been contaminated by cadmium that causes CKDu. Wasana et al. (2012) reported that the cadmium level in drinking water was well below the WHO guideline of 3 µg/l, based on the water quality assessment of areas of high, and low prevalence of CKDu in Sri Lanka (Wasana et al. 2012). In a study carried out by Chandrajith et al. 2011, drinking water samples collected from both CKDu-endemic, and non-endemic regions of the north central province of Sri Lanka had very low levels of cadmium, well below the WHO guideline of 3 µg/l (Chandrajith et al. 2011). The WHO final report stated that cadmium concentrations in drinking water sources used by CKDu patients in Sri Lanka were within the normal range (WHO 2012). All findings support our conclusion that cadmium in drinking water should not be a cause of CKDu.
3.5.5. Lead
The Sri Lankan standard for lead in drinking water is 10 µg/l (Sri Lankan Standard
Institute 2013),which is similar to the WHO guideline for lead in drinking water (WHO
2011). The maximum, and average concentrations of lead in the well water of each district
in Sri Lanka are shown in Table 1.11. The Galle District showed an extremely high maximum concentration of lead in well water of 288 µg/l. All other districts reported maximum concentrations of lead below the Sri Lankan standard of 10 µg/l. No district exceeded the average lead concentration in well water than the Sri Lankan standard.
Lead is suspected to be one cause of CKDu, since lead damages the human kidney, immune system, circulatory system, and neurons, and causes joint diseases (Siraj and
Kitte 2013), and also adversely effect on hemoglobin (Chen et al. 2015). It is a
commutative poison, and human carcinogen. Low level exposure to lead leads to increase the blood pressure, reduce intelligence quotient in children and cause for attention disorders. High level exposure to lead leads to irreversible brain damage. (Siraj and Kitte
2013). However, our results indicate that lead is not a cause of CKDu. The analysis of the
WHO final report, which stated that lead concentrations in drinking water sources used by CKDu patients in Sri Lanka were within the normal range (WHO 2012), coincides with our analysis.
Table 1.11: Lead concentrations in the well water of each Sri Lankan district District Maximum Conc. (µg/l) Average Conc. (µg/l) District Maximum Conc. (µg/l) Average Conc. (µg/l) Ampara 1.2 0.1 Kurunegala 0.1 0.0 Anuradhapura 4.6 0.1 Mannar 0.2 0.0 Badulla 0.9 0.1 Matale 2.8 0.1 Batticaloa 0.1 0.0 Matara 2.2 0.1 Colombo 3.3 0.3 Moneragala 4.3 0.1 Galle 288.0 3.8(0.5)* Mullaitivu 3.9 0.3 Gampaha 0.7 0.2 Nuwara Eliya 3.0 0.5 Hambantota 0.3 0.0 Polonnaruwa 0.1 0.0 Jaffna 0.0 0.0 Puttalam 3.6 0.3 Kalutara 1.0 0.1 Ratnapura 2.6 0.2 Kandy 0.0 0.0 Trincomalee 0.1 0.0 Kegalle 0.0 0.0 Vavuniya 1.3 0.3 Kilinochchi 0.6 0.1
*The average concentration for lead in the Galle District decreases from 3.8 µg/l to 0.5 µg/l when a single data with an extremely high concentration of 288 µg/l is eliminated.
3.5.6. Chromium
Chromium is listed as one of the 129 priority pollutants by the US Environmental Protection Agency (USEPA), and also it has listed among the 25 hazardous substances. In industrialized areas chromium is a common groundwater, and soil contaminant and in hazardous waste sites it is the second most abundant inorganic groundwater contaminant. Chromium is hard (Sueker 2005),highly toxic (Mohan and Pittman Jr 2006), steel-grey metallic element (Sueker 2005) persists for long period of time (Choppala et al. 2013). Chromium can be found in air, water, and soil (Shanker and Venkateswarlu 2011). Chromium release in to water by electroplating industries, leather tanning industries, steel works, refractories, pigments, timber processing companies, and oxidative dyeing (Matos
et al. 2009).
The Sri Lankan standard for chromium in drinking water is 50 µg/l (Sri Lankan
as the Sri Lankan standard of 50 µg/l (WHO 2011). Chromium affects human health in many ways, such as kidney, and liver damage, skin rashes, respiratory defects, weakened immune systems, alteration of genetic materials (Shanker and Venkateswarlu 2011) lung cancer (Rafael et al. 2007), and death (Shanker and Venkateswarlu 2011). Table 1.12 shows the maximum, and average chromium concentrations in well water of each Sri Lankan district. It is obvious that no district has recorded maximum or average chromium concentrations above the Sri Lankan standard, and the WHO guideline. When we consider the average chromium concentration of each district, all districts showed average concentrations of 0 µg/l or 1 µg/l. Therefore, it is clear that Sri Lankan well water has not been contaminated with chromium, and that chromium is unlikely to be a cause of CKDu.
Table 1.12: Chromium concentrations in the well water of each Sri Lankan district
District Maximum Conc. (µg/l) Average Conc. (µg/l) District Maximum Conc. (µg/l) Average Conc. (µg/l) Ampara 14 1 Kurunegala 3 0 Anuradhapura 3 1 Mannar 3 1 Badulla 2 0 Matale 3 0 Batticaloa 1 0 Matara 1 0 Colombo 0 0 Moneragala 6 0 Galle 6 0 Mullaitivu 2 1 Gampaha 0 0 Nuwara Eliya 0 0 Hambantota 2 0 Polonnaruwa 1 0 Jaffna 2 0 Puttalam 2 1 Kalutara 1 0 Ratnapura 4 1 Kandy 0 0 Trincomalee 0 0 Kegalle 3 0 Vavuniya 6 1 Kilinochchi 2 1
Table 1.13 summarized the percentage of wells with fluoride, nitrate, arsenic, aluminum, manganese concentrations relating to WHO guidelines for each district in Sri Lanka. It represented the percentages of parameters which did not fulfill the WHO guidelines in each district. Kegalle, and Kilinochchi Districts recorded that all the well waters in the area have fulfilled the WHO guidelines for fluoride, nitrate, arsenic, aluminum, and manganese.
Table 1.13: Percentage of wells with fluoride, nitrate, arsenic, aluminum, and manganese concentrations relating to WHO guidelines for each district in Sri Lanka
District
Percentage of wells did not fulfill the WHO guidelines NO. of parameters
did not fulfill the
WHO guideline Fluoride Nitrate Arsenic Aluminum Manganese
Ampara 6.1 0.0 0.0 9.1 10.6 3 Anuradhapura 23.5 1.7 0.0 0.0 1.3 3 Badulla 6.2 0.0 0.0 0.0 1.5 2 Batticalo 0.0 0.0 3.3 3.3 0.0 3 Colombo 0.0 0.0 0.0 4.0 0.0 1 Galle 0.0 0.0 0.0 5.8 0.0 1 Gampaha 0.0 8.0 0.0 0.0 0.0 1 Hambantota 2.8 1.4 0.0 1.4 9.2 4 Jaffna 0.0 8.7 0.0 0.0 0.0 1 Kalutara 0.0 0.0 0.0 6.5 0.0 1 Kandy 0.0 0.0 0.0 0.0 8.0 1 Kegalle 0.0 0.0 0.0 0.0 0.0 0 Kilinochchi 0.0 0.0 0.0 0.0 0.0 0 Kurunegala 9.4 0.0 0.0 3.1 9.4 3 Mannar 0.0 9.4 18.8 3.1 0.0 3 Matale 8.2 1.6 0.0 0.0 3.3 3 Matara 0.0 1.3 0.0 4.0 2.7 3 Moneragala 31.9 1.4 0.0 2.8 2.1 4 Mullaitivu 0.0 4.4 8.7 4.4 4.4 4 NuwaraEliya 0.0 0.0 0.0 14.3 14.3 2 Polonnaruwa 17.9 0.0 0.0 0.0 14.3 2 Puttalam 3.6 17.9 7.4 0.0 0.0 3 Ratnapura 0.0 0.0 0.0 3.3 0.0 1 Trincomalee 14.3 3.6 0.0 0.0 0.0 2 Vavuniya 10.0 17.9 0.0 0.0 4.0 3
From this study we have identified that most of the areas contained higher concentration of fluoride, hardness and few areas contained higher concentration of arsenic in Sri Lanka.
4. Conclusions
The well water quality of Sri Lanka was analyzed using 1304, and 1435 water samples collected from wells in all districts of Sri Lanka from 2010 to 2015. Spatial distribution maps were created for the pH, fluoride, nitrate, hardness, aluminum, and manganese concentrations to interpret the analyzed results. According to the analysis, it is clear that Sri Lankan well water was contaminated with fluoride, nitrate, aluminum, arsenic and manganese, and also it contained extremely high hardness. 78.2% of wells contained a pH value higher than 7, indicating that most of the Sri Lankan well water has a basic condition. 20% of the wells were recorded to have fluoride concentrations of more than 1.0 mg/l, although the Sri Lankan standard for fluoride in drinking water is 1.0 mg/l. The Moneragala, and Anuradhapura Districts had the highest recorded average concentrations of fluoride. We found that 2.2% of wells had nitrate concentrations of more than 50 mg/l, exceeding the Sri Lankan standard for nitrate in drinking water. Sri Lankan well water had high hardness. We found that 42.2% of well water was very hard which showed the hardness concentration more than 180 CaCO3 mg/l.
We found that 2.3% of well water samples had aluminum concentrations of more than 200 µg/l exceeding the Sri Lankan standard. Five districts were exceeded the average concentration of manganese than Sri Lankan standard of 100 µg/l with the highest value as 440 µg/l in Polonnaruwa. No district recorded maximum, and average values of cadmium, and chromium concentrations above the Sri Lankan standard or the WHO guideline. Lead concentrations in well water were also recorded as being below the Sri Lankan standard, and the WHO guideline, with the exception of one sample. The well water arsenic in the Mannar, Puttalam, Batticaloa, and Mullaitivu Districts had concentrations that were above the Sri Lankan standard, and the WHO guideline of 10 µg/l.
Thus it is obvious that Sri Lankan well water needs treatment for fluoride, nitrate, aluminum, manganese, arsenic, and hardness for drinking purpose. Profound attention should be given to minimize the contamination of drinking water by fluoride because dental fluorosis, and skeleton fluorosis have been prevalent in Sri Lanka. In addition, it is
supposed to bea suspicious causefor CKDu which was highly prevalent in the Dry Zone of Sri Lanka. Although four districts recorded higher arsenic concentrations, these areas have not yet been identified as CKDu-prevalent areas. So far prominent health hazardous were not reported due to the excess amount of nitrate, aluminum, manganese, and arsenic in Sri Lanka. It is obvious that there is a potential risk to human health since some of the well water exceeded the WHO guidelines.
References
Aslam, K., Davis, A.P., Milic, D.R. & Chettle. (2009) Noninvasive Measurement of Aluminum in Human Bone: Preliminary Human Study and Improved System Performance. Journal of Inorganic Biochemistry, 103:1585-1590.
Averbeck, D. & Bertin, G. (2006) Cadmium: cellular effects, modifications of biomolecules, modulation of DNA repair and genotoxic consequences (a review). Biochimie, 88, 1549-1559.
Bloom, M., Surdu, S., Neamtiu, I.A. & Gurzau, E.S. (2014) Maternal Arsenic Exposure and Birth Outcomes: A Comprehensive Review of the Epidemiologic Literature Focused on Drinking Water. International Journal of Hygiene and Environmental Health, 217, 709-719.
Cedergren, M.I., Selbing, A.J., Lofman, O. & Kallen, B.A.J. (2002) Chlorination Byproducts and Nitrate in Drinking Water and Risk for Congenital Cardiac Defects. Environmental Research, 89 (2), 124-130.
Chandrajith, R., Nanayakkara, S., Itai, K., Aturaliya, T. N. C., Dissanayake, C. B., Abeysekera, T., Harada, K., Watanabe, T. & Koizumi, A. (2011) Chronic kidney diseases of uncertain etiology (CKDue) in Sri Lanka: geographic distribution and environmental implications. Environ Geochem Health, 33, 267-278.
Chappells, H., Campbell, N., Drage, J., Fernandez, C.V., Parker, L. & Dummer, T.J.B. (2015) Understanding the Translation of Scientific Knowledge about Arsenic Risk Exposure among Private Well Water users in Nova Scotia. Science of the Total Environment, 505, 1259-1273.
Chen, X., Zhou, H., Li, X., Wang, Z., Zhu, G. & Jin, T. (2015) Effects of lead and cadmium co-exposure on hemoglobin in a Chinese population. Environmental Toxicology and Pharmacology, 39 (2), 758-763.
Choppala, G., Bolan, N. & Park, J.H. (2013) Chapter Two – Chromium Contamination and its Risk Management in Complex Environmental Settings. Advance in Agronomy, 120, 129-172.
Crisponi, G., Nurchi, V.M., Bertolasi, V., Remelli, M. & Faa, G. (2012) Chelating Agents for Human Diseases Related to Aluminum Overload. Coordination Chemistry Reviews, 256, 89-104.
Dissanayake, C.B. (2005) Water quality in the dry zone of Sri Lanka –Some interesting health aspects. J. Natn.Sci.Foundation in Sri Lanka, 33 (3), 161-168.
Dissanayake, C.B. & Weerasooriya, S.V.R. (1985) The Hydrogeochemical Atlas of Sri Lanka. Natural Resources Energy and Science Authority, Sri Lanka, 1-106.
Fan, A.M. (2011) Nitrate and Nitrite in Drinking Water: A toxicological review. Oakland, CA: California Environmental Protection Agency, USA, 137-145.
Finley, E.J.M. (2014) Arsenic. Encyclopedia of the Neurological Sciences (Second Edition), eds. Aminoff, M.J. & Daroff, R.B. Waltham, MA: Academic Press, 272-274.
Gunasekeram, T. (1983) Groundwater contamination and case studies in Jaffna Peninsula, Sri Lanka. Paper presented at the IGS-WRB Workshop, Colombo, Sri Lanka.
Gupta, R.C. (2007) Aluminum. Veterinary Toxicology Basic and Clinical Principles, 413-417.
Gutiérrez, A.J., Rubio, C., Caballero, J.M. & Hardisson, A. (2014) Nitrites. Encyclopedia of Toxicology (Third Edition), ed. Wexler, P. Boston: Elsevier, 532-535.
Hashimoto, S., Fujita, M., Furukawa, K. & Minami, J.I. (1987) Indices of Drinking Water Concerned with Taste and Health. Journal of Fermentation Technology, 65 (2), 185-192.
Hess, C.A., Smith, M.J., Trueman, C. & Schutkowski, H. (2015) Longitudinal and Contemporaneous Manganese Exposure in Apartheid-Era South Africa: Implication for the Past and Future. International Journal of Paleopathology, 8, 1-9.
IIeperuma, O.A. (1995) Environmental Pollution and the Future Mankind. Peradeniya: Peradeniya Science publication (No.1), 30-33.
Jayasekara J. M. K. B., Dissanayake D. M., Adhikari S. B. & Bandara P. (2013) Geographical distribution of chronic kidney disease of unknown origin in North Central Region of Sri Lanka. Ceylon Medical Journal, 58, 6-10.
Jayasumana, C., Fonseka, S., Fernando, A., Jayalath, K., Amarasinghe, M., Siribaddana, S., Gunatilake, S. & Paranagama, P. (2015) Phosphate fertilizer is a main source of arsenic in areas affected with chronic kidney disease of unknown etiology in Sri Lanka. SpringerPlus, 4.
Jayasumana, C., Gunatilake, S. & Senanayake, P. (2014) Glyphosate, Hard Water and Nephrotoxic Metals: Are They the Culprits Behind the Epidemic of Chronic Kidney Disease of Unknown Etiology in Sri Lanka?. International Journal of Environmental Research and Public Health, 11, 2125-2147.
Jayasumana, M. A. C. S., Paranagama, P. A., Amarasinghe, M. D., Wijewardane, K. M. R. C., Dahanayake, K. S., Fonseka, S. I., Rajakaruna, K. D. L. M. P., Mahamithawa, A. M. P., Samarasinghe, U. D. & Senanayake, V. K. (2013) Possible link of Chronic arsenic toxicity with Chronic Kidney Disease of unknown etiology in Sri Lanka. Journal of Natural Science Research, 3 (1), 64-73.
Jayawardana, D. T., Pitawala, H. M. T. G. A. & Ishiga, H. (2014) Assessment of soil geochemistry around some selected agricultural sites of Sri Lanka. Environ Earth Sci, 71, 4097-4106.
Jin, L., Zhang, L., Li, Z., Liu, J., Ye, R. & Ren, A. (2013) Placental Concentrations of Mercury, Cadmium and the Risk of Neural Tube Defects in a Chinese Population. Reproductive Toxicology, 35, 25-31.
Kumar, V. & K.D. Gill. (2014) Oxidative Stress and Mitochondrial Dysfunction in Aluminum Neurotoxicity and its Amelioration: A review. Neuro Toxicology, 41, 154-166.
Lerga, T.M., & O’Sullivan, C.K. (2008) Rapid Determination of Total Hardness in Water using Fluorescent Molecular Aptamer Beacon. Analytica Chimica Acta., 610, 105-111.