On the Fine Structure of the Bottom
Layer of the Atmosphere
onthe Water
Surface
at Nagase
dam
Hisashi
Ueta
Ph:ysteal Laboratory,
Faculりof
Literature
and
Science
Abstract 。
Some
features
of the
fine structure
of the
bottom
layer
of the atmosphere
on
the water
surface
at
Nagase
dam,
Kochi
prefecture,
in summer,
are made
clear by the analysis of the records
of fluctuations
of short
period
of wind
and
temperature。
The
minimum
temperature
appears
at
the height
of 30cm
and
strong
inversion
of temperature
appears
in the night.
and
weak
inversion
appears
in the daytime.
Cross-correlation
functions
of the
fluctu゛itionsof the temperatures
at two
heights
are
examined
and
they
are conspicuously
affected by
stability. Autocorrelation
of the fluctuations
of vertical component
of wind
velocity w'
and
of along・
wind
component
of wind
velocity
≪' and
cross-correlation
of y and
w'
are examined.
Austausch
coefEcient
and
eddy
diffusivity
for heat
and
amount
of evaporation
are
evalりated.
1.
Introduction
Mi crometeorologi cal study in the bottom layer in the atmosphere
on the water surface of
a lake of a dam
is important
to know
the amoiint of evaporation from
the water surface
and meteorological relation between
the water surface and the surrounding atmosphere. As
the bottom layer on the water surface is affected by the water having a large heat capacity
and by the land surrounding
the lake, it has a considerably different structure from the
bottom layer on the 日atland and some
studies have been devoted to the problem。
The
present study is attempted to make
clear the fine structure of the bottom layer in
the atmosphere
on the water surface at a dam
with the data gained by a few observations
carried out for this purpose by
the method
which
the author has used
in the previous
study".
This method
is based on the analysis of the records of fluctuationsof short period
of the wind
and
temperature gained
by using
a hot wire anemometer and
thermocouple
thermometers.
2.
Method
of
Observation
The
instruments
used
in the study are those which
have
been
used
in the previous
paper"
and
the outline of them
is expressed
here.
A hot-wire
anemometer
of thermocouple
type is used
as a total air-flow meter.
Its
hot-wire
is
stretched horizontally
on top of a
wind
vane
making
the wind
blow
normally
across
the wire
and
a total air-flow
is measured
as a thermo- current
in a thermocouple
attached
to the hot-wire.
Another
Biram・type
anemometer
is also used
to measure
the
mean
wind
velocity.
The
inclination
angle
(9') of air-flow is measured
by
two hot-wire
systems
of Wheatstone
bridge
type,
\vhich show
different electric current
for different inclination
of a wind.
Then
278
高知大学学術研究報告 第21巻 自然科学 第15号
u°V.
COS 9°and
w=v.
sin ?. ,
To
measure
the fluctuations of miχing ratio, SheppaΓd and Elneser's"
circuit・is employed.
To
measure
the fluctuations of temperature,
several thermocouples
of copper
and constantan
4
wires
are employed.
The
mean
miχing ratios (r)
at the
two
points
of
vertical
distance
∠1z are
measured
successively
by
Assman゛s
aspiration
psychrometer.
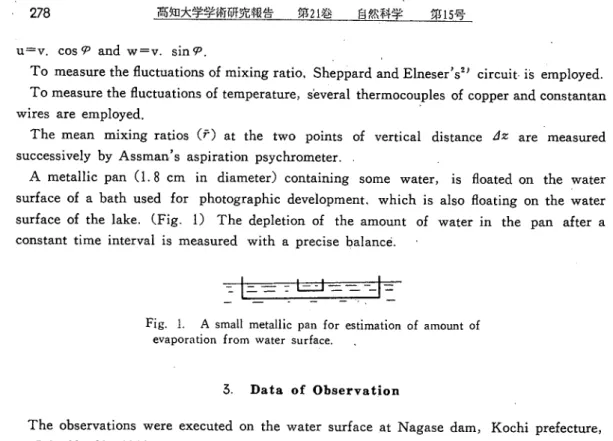
A metallic
pan
(1.8
cm
in
diameter)
containing
some
water,
is
floated on
the
water
surface
of a bath
used
for photographic
development.
which
is also floating on the water
surface
of the lake.
(Fig.
1)
The
depletion
of
the amount
of water
in
the
pan
after a
constant
time interval is measured
with a precise balance.
-一一一一-一一一一
一一一一 一一一一
- - - - - ・ 一
Fig. 1.
A small metallic pan for estimation of amount
of
evaporation from
water surface. 、
3.
Data
of Observation
The
observations
were
eχecuted on
the water
surface
at Nagase
dam,
Kochi
prefecture,
on Jul.
28, 29, 1964.
Durng
the observing
period
S-wi!id surpassed
and its running
distance
over
the water
surface
was
ca.
500 m and it
may
be thought
that the
surface
was
wide
and
homogeneous.
The
point
of observation
is selected in shallow
water
ca.
3 m
off the
shore
and a pole is erected
in the water
and
thermojunctions
are fixed on it at the heights
of 30, 75, 145,
220 cm respectively
above
the water
surface.
Hot-wire
to measure
wind
velocity and
wind
inclination.
and a thermojunction
to measure
miχing-ratio are fixed at
the level of 120 cm.
CFig. 2) The
outputs
of the circuit of the above
meteorological
elements
Fig.
2.
The
view
of observation
site.
are photographically
recorded
by
means
of two
sets of ・Takasu's
six points
simultaneous
self-recorder.
The
constants
of the recorder are
as follows ; preiod
of the free oscillation
of each
galvanometer
is 0. 5 sec. Time
scale of
the record
is ca. 0.2 cm
per second
and
the time
interval needed
for one rotation
of the recording
drum
is ca.
2 minutes. 。
The
record
is divided into
120 subintervals
and
the mean
values
of the elements
v,9’and
on the Water
SurfaceCH. UeTa) 279
‘the wind
u=v.
COS V, ■w=v. sin 'P for each interval and the mean
values of these elements
for 120 seconds u,iv, T are calculated. The
fluctuationsof the elements
at every second
are gained as u' =u―u,
for example.
The
vertical eddy
nuχ for heat (H),
Austausch
coefficient{At)
and
eddy diffusivity(Kx)
for heat can be calculated by
the formulae
of
一
石=C≫pu.’ T’
μ匹
λ=一一- 7 ∂?/∂z
Kr=一
-tがyr´
9T/9z
where
C。= 0.24
cal. g ̄!. deg"^
is specific heat
of
the air at constant
pressure
and
p=
0. 00129
g/cm≫ is density
of the air. The
mean
values of these elements
for each
subinterval
0rone
second
are listed in table 6 about
l7 h 00 m
on
Jul.
28,
as
an
example.
By
the
same
way
as above,
vertical eddy
flux (q).Austausch
coefficient (Ar)
and eddy
diffusivity
(Kr)for water
vapor
were
gained
by the formulae
- 一一
q=
piv' r' ム=−{だjご一 drぶシ
for only
one
case
at 16 h
00 m
on Jul.
2 9 and
the values
are
data
are listed as appendix.
4.
Result
of
Observation
listed
in
table 4.
The
other
(i)
Vertical
distribution of temperature
In
the
daytime,
air temperature
rises to ca.
31°C and
the difference between
the
tern-perature
of
the upper
layer
and
that of
the lower
layer in
the bottom
of the atmosphere
under
2 m
height
touching
the water
surface,
is very
small
1 to 2°C at most.
The
tern-perature
of
the water
stirface is kept
between
28°C and
29.5°C,
and
it is less
than
or
nearly
equal
to the air temperature.
Vertical temperature
profiles of the air and temperature
of the water
surface is illustrated in Fig.
3. In
the
night,
the
air temperature
is higher
than
the water
temperatiire.
This
is because
it is more
difficult for the water
of the lake,
which
has
been
warmed
by
solar radiation
in the daytime,
to be cooled
than
the air. The
temperature
at 30 cm
height
above
the water
surface is the
lowest
and
the temperatures
are higher
above
the height.
The
temperatures
at 30 cm
height
begins
to fall down
from
evening
to the next
early morning
and it seems
that the temperatures
in the higher
levels
are
pulled down
by
the temperature
at 30 cm
height.
It seems
that the temperature
of the
water
does
not fall so much
and it keeps
26 to
28°C because
of a large
heat
capacity
of
water
and
that
the
air cooled
by
the
surrounding
surface
of the
earth
advects
to the
warmer
water
surface.
(ii)
Appearance
of extreme
temperature
From
the simultaneous
records
of air temperature
gained
at several different heights,
it
is found
that there
are following
three
cases in appearance
of extreme
temperatures。
1
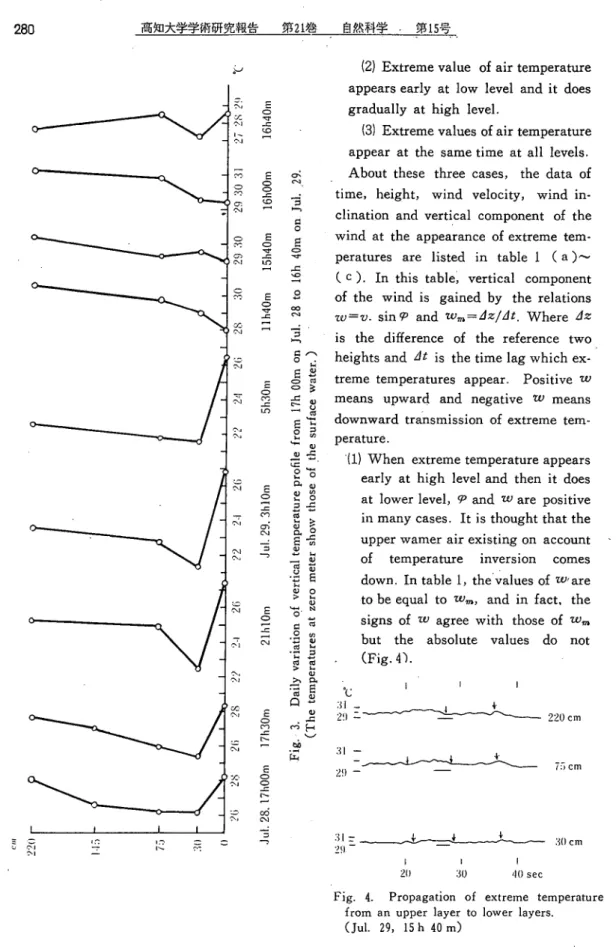
(1)
Extreme
value
of air temperature
appears
early at high
level and it does
gradually
280
I l l : > 一 一 C ` , │ つ x l に I ・ 一高知大学学術研究報告 第21巻 自然科学 第15号
E ︵ ︶ W 9 t ’i t i l > i Z L Z . 6 2 ' [ ” f a o ^ 0 ! ' M 9 T E o 0 4 9 1 l U Q t ' H S I u : O f : a z o s : 6 2 O f : f z ヴ 、 j ' N lぶmi
E o m £ 6 z -│ ” r ' . ) Z \ ' Z 7 . / . ' ■u - 1 -0 ︵ ■ ︵ . s ^ u f t z i v :ぶUI12
1 二 l 心 - 一 一-E︵︶ワ一に Eo︵︶’一に必?一コ﹃
S S 3 卜 ¬ { " j a j E M a D B j j n s a q j l o a s o q } a \ 0 u s J 3 ) 3 U i 0 J 3 Z } E s a j n j B j g d m a j a i i T ︶ U O U I Q Q m i l U O J X 9 I U 0 j d 3 j n j 8 J 3 d U I 9 } 1 1 3 D T J J 3 A J O U O I J E U E A X ] I B Q ' g ' S l j ;(2)Extreme
value
of air temperature
appears early at low
level and it does
gradually at high
level.
(3)Extreme
values of air temperature
appear at the same
time
at a11 levels.
About these
three
cases,
the data
of
time,
height,
wind
velocity,
wind
in-clination
and
vertical component
of the
wind
at the appearance
of extreme
tem-peratures
are listed
in
table 1 (a)∼
Cc).
In this table, vertical component
of the
wind
is gained
by
the relations
でv^v. sin V and
w771=∠lzZ∠dt.
Where∠1z
is the
difference of
the reference
two
heights and
/It is the time lag which
eχ-treme
temperatures
appear. Positive
u/
means
upwarc!
and
negative
w means
downward
transmission
of extreme
tern-perature.
(1) When
extreme
temperature
appears
early
at high
level and
then it does
at
lower
level, ・P and ■u)are positive
in
many
cases. It is thought
that the
upper
wamer
air existing on account
of temperatui・e inversion comes
down.
In table 1,the values of w・are
to be equal
to w^.
and in fact. the
signs
of 7cagree
with
those
of wm
but the absolute values do not
.
(Fig.4\
'℃ | | |
冽_ ふ
29ニ 土 220
cm
31−
− _1_-_4 £
29
-− -− / ; ) c m:j(l cm
29, ̄
- 20 :30 '10
sec
Fig. 4.
Propagation
of extreme
temperature
from an upper layer t0lower layers.
(Jul. 29, 15 h 40m)
i on the Water
Surface(H. UETa)
281
Table
1. ( a )
Propagation of eχtreme temperature from an upper layer to lower layers.
appearanceof extremetemperature
Wind
Vel.
(crn.sec ̄1)
W°V.
sin (p
(ern.SeC ̄1)
<p
(degree)
てtノ97S
(Crn.SeC ̄1)
Date
Time
Heig旨)
Jul.
28
17h
00m
45 sec.
48
220
30
200
−34
−10
−63
Jul.
29
3 10
72
73
220
30
230
0
0
-190
Juレ29
15 40
23
24
75
30
140
1 ・ ・
−13
−5
−45
27
28
220
30
260
−10
−2
−190
36
37.5
220
30
300
−36
−7
-126
73
75
220
30
170
0
0
−95
84
85
75
30
220
−20
−5
−45
Jul.
29
16 00
17
18
75
350
−11
−2
−45
Table
1. ( b )
Propagation
of eχtreme temperature from a lower layer to upper layers.
appearanceof extremetemperature
Wind
Vel.
(cΓΥ1.see ̄1)
W°V.
sin (p
(Cln.SeC ̄1)
yフ
(degree)
■^■m.
(Cm.Se(71)
Date
Time
Height
(cm)
Jul.
29
3`h10m
I seC.
10
30
220
210
19
5
63
56
58
30
220
220
0
0
95
Jul. 29
16 00
97
100
30
80
40
30
63
Table
1. ( c )
Extreme・temperatures
appear at the same
time at all levels
appearanceof extremetemperature
べA^ind Vei.
(cm.
sec)
W°V. sin CO
(cm.
sec"')
yフ
(degree)
Zむ971
(Crn.SeC ̄1)
Date
Time
Heightcm)
Jul. 28
17h
00m
14 see.
37
一
一
’ 250
120
−23
−31
−5
−15
一
一
Jul.
29
16 00
45
89
一
一
O 、
150
0
−18
0
−7
一
一
282 高知大学学術研究報告 第21巻 自然科学 第15号
(2)
When
eχtreme temperature
appears
early
at low
level and
it does later at higher
level,
?> and 7むare positive. It is
thought
that
bubbling
warm
air masses
rise
apart
from
the lowest
level on
the warm
water
surface
to the upper
level. In
this case,
signs
of 7むgenerally
agree
with
those
of u7771but the abusolute
values
do not.
(3)
When
extreme
temperatures
appear
at the same
time
at a11 levels. the signs of w
are indefinite. It may
be that the observing
points
at the different two
heights
enter into
the same
air mass
at the same
time
by
advection.
oas ︵︶コ
o i l ○ ○ I ― ) つ e n つ C 心○
ト
○ 〈 こ 〉 つ I J 7 S マ ・ O C り ○ C M ○ → ・ i n r u o m o o M i l l ^ ^ u i b q -s s b S b w j o j u a u o a r a o o i e o u j s a j o u o i l B n p n n p u B6N4
9 ■ d z 8 . 9 7 . ・ ^ 6 1 ' 8 3 9 3 B I j n S J 3 4 E A \ S m 9 A 0 q e 3 3 S / U J 0 a i n i j C j i o o t s a p u i M j o Q u i a j r u B j a d r a a j s n o 3 U B ︸ U B ; s u i / ( q u i a T d o s j 。 ︵ J 9 -S U笛呂 弓
ど
Q
つ 7 り 0 1 ' -O S -o ^ -︵ ︶ ︷ l o o ︷ 宛泌
e S t J C M2ぷ
ぱ り 卜Q
⊂ い っ ぐ りon the Water SurfaceCH. tjeta)
285
に l ヽ旨−
∼−
( D こ C り踊
︵︶ .yV\
01
。JrQ
(iii) Isopleths
The
isopleths shown
in Fig. 5 (a)∼(
e ), may
be taken up
as a representation of the
thermal structure of the reference layer. As the temperature of 26.8°C of the surface water
is larger than the air temperature
of 23°Con Jul. 29, 3h
10 m, convection takes place in
the lowest layer under 30 cm height by heating from the wamer
water surface but it does
not arrive at the upper layer. because the upper inversion layer suppress the convection.
The
intervals between
the successive cold (orwarm)
masses
are not definite, but the
O . J S 一 心 ・ C N i r - i ︵ ︶ コ 一 一 -W Φ -C ・ ご り こ ; : 心 こ い こ こ
○
に
○ マ j こ 7 t じ 0 1 ・ 0 7 -m r u o u i 0 1 U T J ︸ B a o B i j n s j 3 } b a i a i p 9 A 0 q E ヽ o i u o q E i t o n u d u b m g i d o s j(q︶ s -3!^
C7.
()[
284 高知大学学術研究報告 第21巻 自然科学 第!5号
predominance
of the intervals
of about
8
seconds
can be roughly
recognized
by inspection
(Fig.
5 C C)).
Similar
isopleths
appear
at'1 7h
00 mしand
21h 10 m、 but
the
difference
between
the
water
temperature
and
the air temperature
is smaller
than
that at
3 h 10 m
and
the
turbulence
hy
convection
diminishes
尽nd longer
period
of 10
to 12 seconds
of
alternation
of warm
and
cold
air masses
appears
at 30 cm
height
and
the period
at 145 cm
level is ca. 30 seconds
at 17 h. The
vertical temperature
profile、 at 15 h
40 m
on Jul.
29、
shows
weak
inversion
and
the alternation
of warm
and
cold、air
masses
takes
place
at the
。。ポ已
S C つ C I . r ご マ こ ら へ lΞ ゜
≧
つ →C
CM
C ) C y う○
寸
ブレ
)o?z
E0
M . f ︰ M η N∼l︷..NM/v1ど∼’/‘
ンー一‘.NNトχ/いン\ノ”
Q Q の ( ⊃ つ r 一 i.S.︻nf uo ui QT
up jE 33EiJns J9JEA\ am aAOQEヽm. uoUBnpng pxre majdosj
︵)5
08
Oi
09
(︶に 三ヽOK
07.
︵Q︶〃
o[
. l 皿 こ ○ 7 りof the Atmosphere
on the Water SurfaceCH.リETA) 285
り り ㎝.52
-pf uo rag^ qgi JB goejjns jajBAv 34; aAoqeヽm u0ijBnjonu puB majdosj
OG
08
OZ
09
O'J
01'
Of:
OZ ︵︶一
period
of ca. 60 seconds
a‘ndpredominance
of downward
motion
during
the warming
stage
and
upward
motion
during
the cooling
stage
can
be recognized
at the level of 220 cm.
(iv)
Correlation
functions
of fluctuations
of temperature
at various^ heights
From
the
temperature
fluctuations T' 220、7≒5、T勺o at
the levels
of 220、75、30
cm
respectively above
the
water surface、cross・correlations
RTu
between
T≒2o and T≒5
as
well
as RTl
between
7‰5 and
^■'30 are calculated.
(Only
at 17 h
00 m
on Jul.
28、RTu
Q⊂)O
QI口 t
ポ
ロ
Q
⊂ ) こ ・ つ呂 邱 o ヨ
|
≧
つ っ っ こ C 、 1 7 ヽ つ 寸 E C 、 、 l 1 ` 1 ¶ Q へ 1 じ t 卜 ヽ286
01'
09
U8
。。♂y
高知大学学術研究報告 第21巻 自然科学 第15号
1匹
ぱ ) e ヽ こ φ つ こ J h t t p : / / w w w . . . ( ︶ 一 一 こ ︵ 二 つ Sつ
父
一 一 1 ∼ 一 一 ・ 二-こ 1 、 ・ 一 一 マ こ 7 で -り 、 l . { . 7 " r n f u o u i 0 0 i l Q T ︸ e a o E j j n s J 9 J b a \ a m s a 0 1 ヽ a i u o U B n j o n u d u e m a i d o s j ( 3 ︶ S -S l J ( ︶ 一 ’・C C C -C C C) 〃 ら
c`l αl マ こ cc 三 Eぷ5・
I I I I T Qり、│
μ
is correlation between 7‰o and
T'i45.) (Table
2.)
In weak
stable layer、correlation of T'
at high and low levels is large and it indicates
that the temperature fluctuations at high
and low levels have
considerably close relation.
For example、 both RTl
and RTu
are 0.5 t0 0.8 at 17 h 00 m
on Jul. 28 and at 15h 40 m
and 16h 00 m
on Jul. 29、and RTu
is 0.8 at 21h 10 m
on Jul. 28.
When
there is a temperature inversion、 cross-correlation is▽ery small in the air under
the top of the inversion layer and in the weak
stablelayer above it RTu
shows large value.
287
Table
2.
Cross-corre】ation
of fluctuations of temperatures
at various
heights.
RTl;
Tり5 and
Tり0.
RTu;
rり2o
and
Tり5.
Jul. 28
17h
00m
21 10
0.53
−0.02
0.65
0.82
Jul. 29
3 10
15 40
16 00
-0.34
0.79
0.68
0.17
0.86
0.60
juaiomgoo uoijBiaiJOQ
1 . 0 0 . 8 0 . 6 0 。 4 0 . 2 0−0.2
−0.4
5 10 15 20 。25 30 ●
35 刳l ・15
Time-lag
(sec)
Fig.
6 (a)く Autocorrelation
of fluctuation
of vertical component
of wind
velocity 7む万´万(○)a万nd
along-wind
component
≪' (□)
and
cross・correlation (●)of
u' and
w'
at a height
of 120 cm
at 17h
00m
on
Jul.
28, 1964.
Sampling・duration
120 sec. ; Mean
wind
speed ・=
234 cm/sec.
j u s i o m g o o u o U B p j J O Q ] . ( 1 0 . 8 ( ) . ( i 0 . 4 0 . 2 0 0 . 2
−0
4Time-Lag(sec)
Fig. 6 (b).
Autocorrelation of fluctuation of w´ and
u' and cross-correlation of u' and 7c/
288
jugiomaos noijuiaiaOQ
1 .0 0 . 8 0 . G 0 0 . , 1 1 0 。 2 0−0
−0
2 . ' I高知大学学術研究報告 第21巻 自然科学 第15号
5 ’10 15 20 25 :如 35 ●10 j15
Time-Lag(sec)
Fig. 6 (c).
Autocorrelation of fluctuation of 7t/ 卯dがand
cross-correlationof ii' and 7cバ
at 3h 10m on Jul. 29 ; Mean
wind
speed t,=195cm/sec.
5 U 3 t O I J 1 9 0 3 U O U B r S J J O Q | . 0 0 . 8 0 . 6 0 . ・ 1 0 。 2 0 - 0 . 2 − 0 。 1 − 0 。 6 5 1 0
15
20。,25
Time・Lag
(sec;
3 035
4 045
Fig.
6
(d).
Autocorrelation
of
fluctuation
of
zv' and u' and
cross-correlation
of
v!
and
http:
//www.h.com.on.Jul.
29 ;
Mean
wind
speed
1^=253
cm/sec.
Fine Structure of the Bottom Layer of the Atmosphere
on the Water SurfaceCH. ueta) 289
1 . 00.8
6 4 ? 一 0 J 0 0 0 J U 3 I D I J J 3 0 3 U O p e p i J O Q 0 . 2 0 . 4 5 1 0 1 5 2 025
3 035
4 0弱
Time-Lag
(sec)
Fig. 6 (e).
Autocorre】ation of fluctuation of 7y and
u' 池d
cross-correlationof y
and zむ
at 16h 00m on Jul. 29 ; Mean
wind
speed t;= 233 cm/sec.
For example、the
air above
the level of 75 cm
and
the
air under
it shows
undoubtedly
individual
temperature
fluctuations at 21 h 10 m
on Jul.
28.
At
3h 10 m
on
Tul. 29、inversion
is the largest
until
the height
of 220 cm
and
in this
strong
stable layer
both
RTl
and
RTu
are very
small
and it seems
that there is no relation
between
the upper
and
the lower
layer.
(v)
Evaporation
from
the water
surface
Vapor
tension
becomes
largest
from
13 h t0 15 h and
relative humidity
shows
maχimum
value・of
90%from
l h t0 4 h.
Daily
variations
of them
are illustrated in Fig.
7.
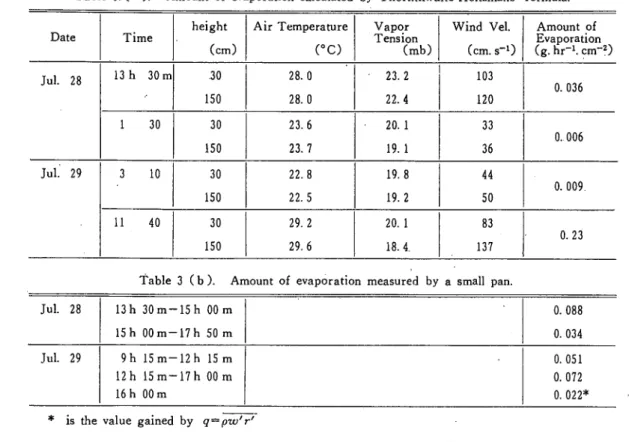
The
amount
of evaporation
is calculated
by
the
next
two
ways.
The
one is by
the
evaporating
formula
of Thornthwaite-Holtzman
(9ぶ)、and the other is by a small evaporating
pan
(go').
Relative humidity
mnl・Hk
り I I O S ソ ー 2 1V:ipc>i-tension
%00 90
−
0 0 a ; i -6 0U 2 ●1 6 8 10 1】2 M 16
hr
290
高知大学学術研究報告 第21巻 自然科学 第15号
Thornthwaite- Holtzman' s formula
is as follows : ・
ρ尺2ヽけ1−r2)(フ■J2-V,)
’ qtK ― Un
z2/21`)2
where K is Karman!s constant. Mean
wind velocities フノland tノ2and relative humidities FI、
F2at the heights of z1=30 cm、2:.= 150 cm
are measured
and r is calculated‘by the
following relations:
7-= 0.622×
こ
£
×100=F
ε
ターε
where
^ is vapor tension. E is saturated vapor tension. F is relative humidity.
The
amount
of water diminished by evaporation
from
the small evaporating pan during
two or three hours is measured
and reduced to time mean value. Another way
of measuring
-evaporation from
the relation q= pwり'' was tried but it failed to measure r and only one
case succeeded and is listed in table 3 (b)
as a reference. The
results show
that Qtn are
Table
3.( a ).
Amount
of evaporation calculated by Thornthwaite-Holtzmans'
formula.
Date
Time
height
(cm)
Air Temperature
(゜C)
どL
(mb)
Wind Vel.
Ccm.
s-i)
Amount of
詐ヅホ)
Jul. 28
13h 30m
、30
150
28.0
28.0
■
23.2
22.4
103
120
0.036
1 30
30
150
23.6
23.7
20.1
19.1
33
36
0.006
Jul. 29
3 10
30
150
22.8
22.5
19.8
19.2
44
50
0. 009.
11 40
30
150
29.2
29.6
20.1
18.4.
83
137
・ 0.23
Table
3 ( b ).
Amount
of evaporation measured
by a small pan.
Jul. 28
13h
30m-15h
00m
15h
00m-17h
50 m
0.088
0.034
Jul. 29
9h
15m-12h
15m
12h
15m-17h
00m
16h
00m
0.051
0.072
0. 022*
- * is the value gained by
q°p-m’が
small
values
of 0.006
to‘0.009 g. cm'^'hour"' in
the night
and large
values
of 0.05
to 0.23
g.cm ̄2hour
^in the daytime.
Agreements
of these
calculatec! results Qth. with
the observed
values
9o gained
by a small evaporating
pan
are not su伍cient. (Tabl
3(a))
In the method
of evaporating
pan、
turbulence
may
be produced
by the
brim
of the pan
and
heat
may
be
absorbed
by
the vessel、and
so
the amount
of evaporation
9omay
differ from
true value
on the Water
Surface(H. ueta) 291
by the
pw'T'
-∠1t/4z
the water surface.
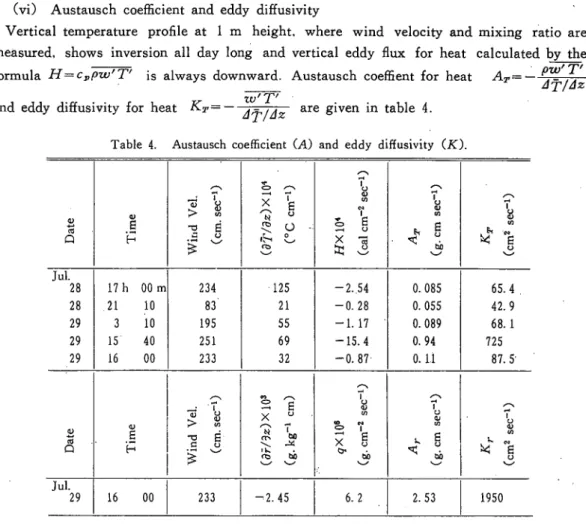
(vi) Austausch
coefficientand eddy diffusivity
Vertical temperature
profile at l m
height、 where
wind
velocity and mixing
ratio are
measured、shows
inversion all day long
and vertical eddy 丑uχfor heat calculated
-formula
J-T=らpuノhttp://www.downward.
Austausch
coe伍ent
for
heat Ar=-and
eddy
diffusivity for heat K7=
ぷyブ
-/Iz
are given in table 4.
Table 4.
Austausch coefficient(A)
and eddy
diffusivity
(尺)
|
Q
l
回
バ
ド
−͡
→ .4
い
レ`
で
い
い
7
1
.々5
、j
て
ぴ3
々l
心
Jul.
28
28
29
29
29
17h
00m
21 10
3 10
15 40
16 00
234
83
195
251
233
・125
21
55
69
32
-2.54
−0.28
-1.17
-15.4
-0.87・
0.085
0.055
0.089
0.94
0. U
65.4
42.9
68.1
725
87.5・
卜
Q
《U
E
H
バ
1
1’
ド
柚
きj
口
り` &
W
で
ぺ
ら
か・i
. |
Q
Q
ぴ)
Ji
Q
W
Jul.
29
16 00
233
-2.45
6.2
2.53
1950
The
order
of the vertical eddy
flux heat
(H)
is 10−3 to 10−5 cal. cm"^
sec
^ and minimum
value
appears
at 21 h and
maximum
value
of i5;4 cal.,cm ̄2 sec"' does
at 15 h 40
m.
Consequently,
At
and
尺T at 15 h 40 m
show
remarkably
large
values.
In
general.
K.T is
order
of 102 to 103 c
「sec"^. 。ヽ
(vii)
Correlation
function
of fluctuations of wind
velocities。
Autocorrelation
functions of time-series Rt。and Ru
for
fluctuation
of vertical wind
component
゛´ and
for that of along-wind
component
u' and
cross-correlation
Rtゐ旬ofが
and
■w' are illustrated in Fig. 6 (a)∼(e)。 ’
The
values of 1/?r/1/昌ラ'2
and intentity of turbulence
along-wind
(ソぷT/y)and vertical
(1/昌ワフIV)
are calculated
and
they
are listed in table 5. The
values
of 1/m'2/Vw'2
are
1.5 t0 4.4
and
they
show
that
the turbulence
at the height
of l meter
above
the water
surface
is not‘isotropic'。
’ln the‘night,
the values
of 沢。:;keep
O。1 t0 0. 4 and
the life time
of
eddies (7い(at
which
Ri。= 0) are 33 t0 43 seconds.
The
value
of To is ca.
16 seconds
and
that of゛沢wis
larger
than
that of Ru.
In the daytime,
Tq
of R,6 is almost
the same
as that of K。and
292
一 一