Theoretical Study on the Structure and Dynamics of Hydrogen Hydrates
著者 ユダ アーマン
著者別表示 Yudha Arman journal or
publication title
博士論文要旨Abstract 学位授与番号 13301甲第4812号
学位名 博士(理学)
学位授与年月日 2018‑09‑26
URL http://hdl.handle.net/2297/00053021
Creative Commons : 表示 ‑ 非営利 ‑ 改変禁止 http://creativecommons.org/licenses/by‑nc‑nd/3.0/deed.ja
DISSERTATION ABSTRACT
Theoretical Study on the Structure and Dynamics of Hydrogen Hydrates
Graduate School of
Natural Science & Technology Kanazawa University
Division of Mathematical and Physical Sciences
Student ID Number: 1524012015 Name: Yudha Arman
Chief Advisor: Shinichi MIURA, Prof.
Date of Submission: June 28
th, 2018
Abstract
Molecular dynamics study of hydrogen hydrates C
1and C
2known as filled ice II and Ic, respectively, have been performed.
The structure of this two hydrates is closely similar to the respective ice structure encapsulating hydrogen molecule in a lattice site constructed by the framework of hydrogen-bonded water molecules. The hydrates were calculated under temperature condition controlled at 291 K. The pressure of 1 GPa for C
1and 4 GPa for C
2was carried out adopting the experimental arrangement where the fast diffusion of hydrogen molecules was observed; here, the H
2:H
2O stoichiometry of 1:6 was used for C
1and 1:1 for C
2. There are two calculation setups have been carried out, namely full occupation and one vacancy setup, to demonstrate the ideally synthesized and the occupation’s defect hydrates, respectively. Longtime simulation has been done to study the diffusion process; here, 100 ns for full occupation and 50 ns for one vacancy setup. In the calculation, many inter-site translations were observed only in the one vacancy setup of both hydrates.
This behavior indicates the necessity of occupation’s defect to facilitate the diffusion. The calculated hydrogen molecule
diffusion coefficient are found to be in good agreement with the experimental results confirming the highly anisotropic
diffusion for hydrate C
1while isotropic for C
2.
1 Introduction
Clathrate hydrate is a crystalline ice material constructed from frozen water molecules accommodating guest molecules. The arrangements assembling cage-like framework in which light noble gaseous or liquid can be encapsulated [1, 2]. The guest molecules which have substantial hydrophobic moiety trapped inside these polyhedral cavities through single and multiple occupations per cage. The encapsulation performed without having the chemical mixture, preventing the host to collapse when positive external pressure is applied [3].
Guest in the gas phase is kept inside cages only by physical bonds. These guest encapsulations have made the resulted structure in a broaden phase-space stability compared to the respective metastable empty structure.
These encapsulations were also preventing the cages not to rupture to the typical ice crystal structure or liquid water. This behavior, in the view of the statistical study of several clathrate hydrate systems, were correlated with the van der Waals volume and dipole moment of gaseous species [4]. The guest molecules along with hydrogen-water atom released during melting. A recent study discovered the potential of clathrate hydrate as the solution of CO
2removal [5] and hydrogen storage materials [6–10]. Theoretical and experimental study of hydrogen hydrate revealed the ability of hydrogen to form clathrate hydrate through single and multiple occupancies [11, 12].
There have been several observations noticing advantages from hydrogen hydrate. Clean by-products have resulted from the energy harnessing; here, only water and a small concentration of promoters produced. During harnessing, the hydrogen guest is released from the framework through the pressure reduction and small tem- perature adjustment. This energy carrier stays in its molecular form inside the cage. Several published data showed that hydrogen hydrate can be synthesized in the moderate temperature and condition with the need of low promoters concentration; substances such as THF [13, 14], Acetone [15] with low concentration were used to improve operating conditions. These reveal potential features on having hydrogen storage economically with less energy effort in controlling synthesize process. There also numerous hydrogen hydrate having higher hydrogen content per unit mass and volume [6, 7, 16, 17] discovered.
Hydrogen gas can also be found encapsulated in the cage-like water framework without the need of promoters to support. For instance, high amount of hydrogen gas can be stored in lattice sites of ice II and Ic, with H
2: H
2O stoichiometry is 1:6 and 1:1, respectively [17]. Instead of clathrate hydrate, these two known as filled ices of C
1and C
2, respectively. The inclusion stabilizes the ice structure in an extended range of pressure and temperature compared to the unfilled composition [18–22]. Hydrate C
1is firmly having ice II structure while hydrate C
2shows cubic ice framework. Not only hydrogen, other light noble gas molecules [23, 24] can also be occupied. However, the high-pressure condition is needed when synthesizing the materials since interaction energy between guest and surrounding host molecules shows repulsive character due to small cage size. The guests themselves are needed to stabilize the host-framework structure. The high ratio between host-guest is a necessity to avoid cage rupture when highly needed pressure is applied to the system.
The crystal structure of hydrogen hydrate C
1is known to be rhombohedral in the R ¯ 3 space group. Under
2.1 GPa and 295(3) K, this hydrate was reported to have a hexagonal unit cell containing 36 water molecules
[17]. The full arrangement consists of the hexagonal array of hydrogen-bonded water molecules lies on the
surface known as the basal plane. The planes are piled along the optical c axis to form hexagonal columns in a
similar way as the ice II. On the other hand, under 3.1 GPa of pressure, hydrogen hydrate C
2was reported to
have a cubic crystal structure [17]. The arrangement of water molecules gives eight faces forming diamond-like
crystal structures. Surfaces containing hexagonal shaped of hydrogen-bonded water molecules are formed by
stacking (111) faces in a disordered way along (110) direction. This (111) plane is similar to the unoccupied
cubic ice structure and perfectly coherent to the basal plane of hexagonal ice [25]. The hydrate was able to store
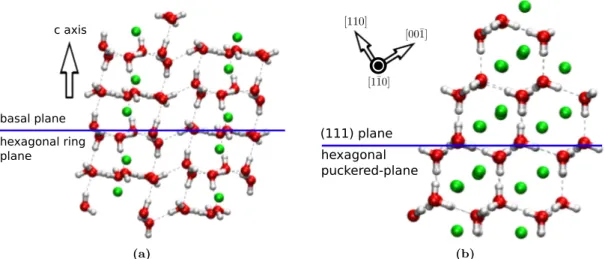
basal plane hexagonal ring plane
c axis
(a)
hexagonal puckered-plane (111) plane
(b)
Fig. 1. Molecule model for (a) C
1, and (b) C
2system. Green spheres describe hydrogen guest.
maximum 10 %wt H
2capacity equivalent to 1:1 molar ratio between hydrogen and host water framework. The stoichiometry gives C
2characterized as a hydrogen-rich material compound, therefore suitable for hydrogen storage.
Fast diffusion of hydrogen guest molecules has been reported in these dense hydrates under highly compressed condition [26, 27]. The observed rapid hydrogen molecules inter-site translation showed less affected by the pressure. Moreover, concerning the diffusion trajectory, anisotropic is suggested in hydrate C
1while isotropic is for hydrate C
2. This suggestion was governed from more to the structural arrangement’s consideration rather than theoretically observed. The details mechanism could be crucial in designing better hydrogen storage in these filled ices. There could be a factor to drive these guests diffusion among lattice sites.
In the development of hydrogen storage, numerous study gives evidence on the importance of structural size in the intra-site dynamics [28]. Moreover, in the specific system such as filled ices, the small size of lattice site give high repulsion characteristic shown by the guest [22]. Therefore, high pressure is needed to keep the confinement. As a consequence of the pressurization, more dynamic is expected to be observed since the density of guest molecule is denser compared to its condensed state. Imperfect confinement structure also influenced the mobility of the confined species. Inter-site translation is observed in clathrate hydrate by this kind of water vacancy [29, 30]. With the defect, free energy of cage boundary is lowering to allow the guest to diffuse.
2 Computational Details
A molecular dynamics (MD) calculations of hydrogen hydrate C
2and C
1systems by using LAMMPS molecular dynamics package [31] has been carried out. The system’s pressure was 4 GPa for C
2and 1 GPa for the C
1. Meanwhile, the temperature for all simulated system was controlled to be 291 K. These thermodynamic conditions were derived from experimental conditions where fast diffusion of H
2molecules was found [26, 27].
The NPT condition was applied by the LAMMPS standard procedure [32–37]. Subsequently, the desired temperature and pressure were controlled by implementing a chain of 4 thermostats coupled to the system particles, while the other four to the barostat variables.
To model the intermolecular interaction, Lennard-Jones (LJ) and the Coulomb potential,
φ = X
i,j
"
4ε
ij( σ
ijr
ij 12− σ
ijr
ij 6)
+ q
iq
je
2r
ij#
, (1)
ii
Table 1: The potential parameter for water and hydrogen guest molecules used in MD simulation. For H
2guest molecule, both LJ and charge site are located at the center of mass. Meanwhile, TIP4P/Ice water model used oxygen atom’s position as LJ calculation point. A negative charge is placed at point M, located between the center of H-H and oxygen.
Model Site q(|e|)
σ(˚A)
ε(kcal/mol)H
2[39] Center 0.0 2.96 0.067962
TIP4P/Ice [40] H 0.5897
O 3.1668 0.21084
M -1.1794
were used; long-range Coulomb interaction was evaluated by using a particle-particle particle-mesh Ewald method [38] with tail correction on LJ pair potential. To describe the guest molecules, one site H
2model [39] was chosen with TIP4P/Ice [40] to specify the water-water interaction. SHAKE algorithm [41] was used to handle rigid water molecules. All of the potential parameters are listed in Table. 1. The parameter of intermolecular interaction between water and hydrogen guest molecules was given by using Lorentz-Berthelot combination rules [42, 43].
MD calculations was performed in several stages. Firstly, guest molecules were inserted into the lattice site of ice structure to subsequently entering energy minimization step. All of the chosen ice configurations satisfy Bernal-Fowler [44] rules on 3 × 3 × 3 unit cells, containing 216 water molecules for C
2while 324 for C
1[45]. Two different setups for every filled ice system, namely full occupation and one vacancy implemented with periodic boundary conditions were simulated. For the maximumly occupied system, the ratio between water and guest molecules for C
2was 1:1 while 6:1 for C
1. For comparison, one vacancy was prepared by letting a single lattice site unoccupied. Secondly, all minimum energy configurations were equilibrated for 50 ps.
During the equilibration process, energy conservation and controlled thermodynamic conditions were carefully observed. Finally, long MD calculation of 100 ns was performed for full occupation setup, while 50 ns for the one vacancy; long time simulation run was needed to study the diffusion process in C
2and C
1systems. In the equilibrium and production run, thermostat and barostat were implemented with 0.1 ps and 1.0 ps of relaxation time, respectively. Time step of 1 fs is used for the production run of all simulated systems. A van der Waals cut off radius of 10.0 ˚ A was used in all simulated systems and stages.
3 Results and Discussion
The first discussion is for the molecular dynamics results on full occupation systems. Eventually, no inter-site movement during the time on neither hydrate C
1nor C
2; here, full occupation describes the ideally synthesize hydrogen hydrate.
Next, hydrogen molecules diffusion occured in the one vacancy system is presented. The lattice site is supposed to be engaged by one hydrogen molecule; here, the empty site is regarded to be vacancy or occupation defect. During 50 ns of simulation, many inter-site jumping events were observed for the hydrogen molecules.
The inter-site hopping schemes are noticeable in hydrate C
1and C
2, involving only hydrogen molecule next to vacancy site. The vacancy thus essential to facilitate the diffusion process.
The mean square displacement of a tagged hydrogen guest molecule is calculated as a function of time t, h|∆r(t)|
2i. The mean square displacement is linked with the diffusion coefficient D by
h|∆r(t)|
2i = 6Dt , (2)
110.8ps 111.0ps 110.9ps
(a)
42.3493ns
24.8748ns
36.2858ns 24.875ns
36.286ns 24.8749ns
36.2859ns
42.3492ns
42.3491ns
(b)
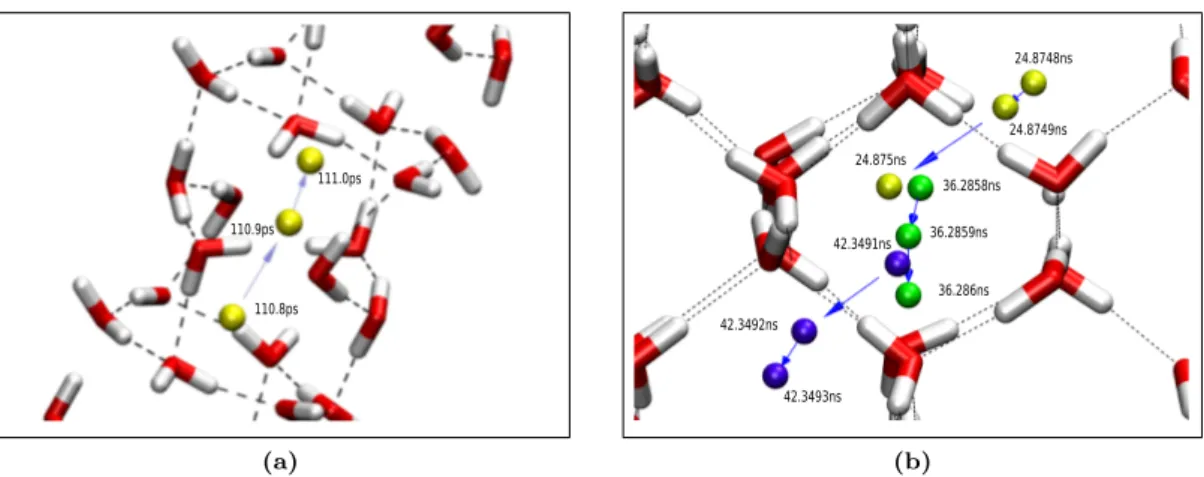
Fig. 2. Diffusion mechanism of a tagged hydrogen molecule in (a) hydrate C
1viewed along ice II basal plane and (b) hydrate C
2drawn parallel to (110) plane of ice Ic. Dashed black lines indicate hydrogen bonds while blue arrows show the direction of movement along the trajectory. Colored spheres (green, blue and yellow) are for hydrogen molecules. In both figures, similar color is used to represent the same hopping scheme in
successive time. In the case of hydrate C
1, yellow spheres indicate the hydrogen movement along the crystallographic c axis. In hydrate C
2, inter-site diffusion mechanism parallel to the (0¯ 11) plane is shown by the yellow and blue spheres, while for the plane of (011) is represented by the green.
in a long time regime. In the case of the C
1structure, hydrogen molecules are anisotropically coordinated by other hydrogen molecules. The molecules are found to move only along the crystallographic c axis. Eventually, the inter-site diffusion of the hydrogen molecules can be seen only in a specific column where the vacancy is setup initially. To take account of this hydrogen molecules, the mean square displacement was calculated for the hydrogen molecules in the specific column. The hydrogen molecules are tetrahedrally coordinated by other hydrogen molecules in hydrate C
2. The molecules are supposed to move along the direction of the coordinated molecules. Under this circumstances, hydrogen molecules would travel along the tetrahedral direction on inter- site translation. Therefore, all of hydrogen molecules movements are considered to contribute to the diffusion process. The results are presented in Table. 2. The diffusion coefficients for the hydrate C
1and C
2are found to be in good agreement with the experimental results [26, 27]; here, the fast diffusion of hydrogen molecules is reproduced by our simulations.
The guest jumping among lattice sites are occurred sequentially. In more details, these inter-site movements are presented in Fig. 2. Time evolution of one tagged hydrogen molecule on each filled ice system is selected to demonstrate details of the inter-site movement. In the case of the hydrate C
1, the inter-site translation only occurred along the crystallographic c axis; an example of this anisotropic hydrogen diffusion is depicted in Fig. 2 (a). The figure shows the time evolution of a tagged hydrogen molecule from 110.8 ps to 111.0 ps pictured along the basal plane of ice II structure. Shown by yellow spheres, the movement of a tagged hydrogen molecule between lattice sites took 200 fs to complete. Distance covered from this early stage is 2.55 ˚ A while the second is 1.49 ˚ A. Inter-site movement is observed only when the adjacent lattice site is unoccupied.
Table 2: Diffusion coefficient of hydrogen molecules (D) in units of cm
2s
−1. C
1and C
2are for filled ice II and Ic, respectively.
System D Exp.
C
13.9×10
−81.3×10
−8[26]
C
25.2×10
−9' 10
−9[27]
iv
5 10 15 20
0 5 10 5.0 15 20
(a)
5 10 15 20
0 5 10 5.0 15 20
(b)
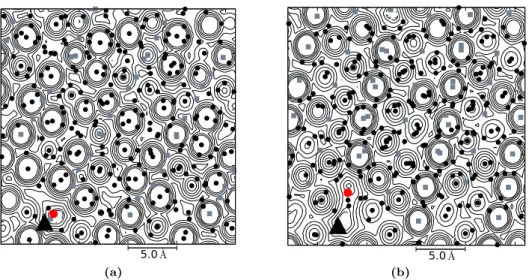
Fig. 3. Potential energy contour of one vacancy C
1system, snapshots are drawn at 0.36619 ns on the surface parallel to (a) basal and (b) optical plane. On the basal plane, ten contour lines are used with the lowest represent energy value 1 kcal/mol and the highest is 2.6 × 10
5kcal/mol. Meanwhile, there are 14 contour lines used on the optical plane; here, the lowest energy line represents 6.25 ×10
−3kcal/mol. Projected hydrogen molecules and oxygens of water molecules are represented by gray rectangles and black spheres, respectively.
The tagged hydrogen molecule to perform inter-site translation is represented by a black triangle while the vacancy is denoted by red sphere.
In the case of the hydrate C
2system, the evolution of a tagged hydrogen molecule from 24.8748 ns to 42.3493 ns is depicted in Fig. 2 (b). All of the molecules are viewed on the hexagonal puckered-plane of the cubic ice structure. Three different sphere colors are used to describe the trajectory taken by the guest molecule on performing inter-site movement at a consecutive time. The yellow and the blue spheres show the jumping parallel to the (111) plane observed at 24.8748 ns and 42.3491 ns, respectively. The green particles are used to demonstrate the movement along the normal of (111) plane at 36.2858 ns. All of the inter-site translation took 200 fs in average to complete with distinctive covered distance throughout stages in the period. In the meantime, the hydrogen molecule oscillates inside its new lattice site during the time interval between the observed jumping process.
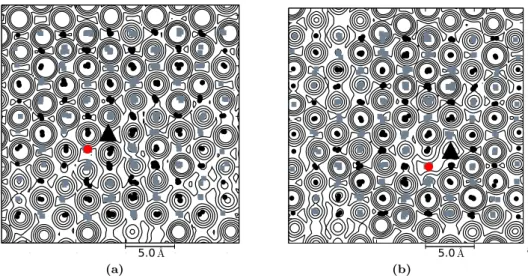
A potential field map of pair interaction between a tagged H
2molecule and its surrounding water molecules is presented. The calculation was performed by using a system snapshot at a consecutive time before a jumping process is observed. The calculation adopted a similar method developed in Ref. [46]. The map calculation is as follows. Firstly, a snapshot of filled ice system is selected. Then, the projection surface is calculated concerning the hexagonal-puckered plane of ice structure. The surface is then divided into small rectangular spaces of 0.1
˚ A. Subsequently, the tagged molecule is moved to the grid on the projection surface and calculate the total potential energy. Finally, the energy values are contoured with the interval defined by a × 4
nwhere a is the starting value of potential energy, and n is the number of the contour line. The results are presented in Figs. 3 and 4. It can be seen from the figure that the occupied lattice site positions are surrounded by the energy barrier, which inhibit the tagged molecule to cross the energy barriers. The similar pattern is observed on all calculated planes. Relatively wide-flat-area that covers tagged hydrogen guest location is found. This low potential field area encompasses the surface where empty lattice site coordinate is located. To connect this feature with the inter-site translation, we observed the path followed by the tagged molecule in the next consecutive time-frame.
It is found that the diffusing molecule moves across this low potential field area. However, the feature only
noticeable when the trajectory is located on the plane. Slightly different pattern occurred in the basal surface
0 5 10 15 20
-10 -5 0 5.0 5 10
(a)
0 5 10 15 20
5 10 15 5.0 20 25
(b)