Hydrostatic pressure effects on the optical transitions in free‑standing porous silicon film
journal or
publication title
Applied Physics Letters
volume 63
number 3
page range 346‑348
year 1993‑07‑19
その他の言語のタイ トル
自立ポーラスシリコン膜の光学遷移における静水圧 効果
URL http://hdl.handle.net/2298/9650
doi: 10.1063/1.110038
Reprinted from
iedPhv
Volume 63 19 July 1993 Number 3
Hydrostatic pressure effects on the optical transitions in the free-standing porous silicon film
NorioOokubo
NEC Fundamental Research Laboratories, Miyukigaoka 34, Tsukuba, Ibaraki 305, Japan
: YasuhiroMatsudaandNoritakaKuroda
Institutefor Materials Research, Tohoku University, 2-1-1 Katahira, Aoba-ku, Sendai 980, Japan (Received 23 December 1992; accepted for publication 2 May 1993)
. pp. 346^348
a publication of the American Institute of Physics
Hydrostatic pressure effects on the optical transitions in the free-standing porous silicon film
Norio Ookubo
NEC Fundamental Research Laboratories, Miyukigaoka 34, Tsukuba, Ibaraki 305, Japan Yasuhiro Matsuda and Noritaka Kuroda
Institute for Materials Research, Tohoku University, 2-1-1 Katahira, Aoba-ku, Sendai 980, Japan (Received 23 December 1992; accepted for publication 2 May 1993)
Optical absorption and photoluminescence spectra in the range 1.2-2.2 eV have been measured in free-standing films of porous Si under hydrostatic pressures up to 6.4 GPa at room temperature. The absorption rises nearly exponentially in the low energy region. Under pressure, the whole spectrum shifts toward lower energies with a pressure coefficient of about —90 meV/GPa. The photoluminescence spectrum also exhibits a redshift of about —40 meV/GPa.
These results are interpreted by analogy with the pressure-induced shrinkage of the optical energy gap seen in amorphous chalcogenide semiconductors.
Porous silicon prepared by anodization in HF solution shows an intense and wide photoluminescence (PL) band in the visible region at room temperature. Various states have been proposed as the origin of this band, i.e.,
nanometer-scale Si crystallites,1"* Si-H2-related materi als,5'6 molecules like siloxene7'8 or amorphous struc tures.9"13 Electron microscope observation of nanocrystal- lites suggests quantum confinement effects.1'3 Molecular
materials like siloxene closely resemble porous Si in the PL
spectrum.7'8 The amorphous structure is inferred for the
oxidized porous Si, in which the intensity and the decay
time of PL are greatly enhanced by the oxidation.4'9"12'14
Recently, the behavior of the PL .spectrum under hy drostatic pressure has been studied empirically. According
to Zhou etal15 and Zhao etaL,16 the PL peak shifts to
ward higher energies at a rate of 40-90 meV/GPa with increasing pressure from 1 atm to about 2 GPa, and then turns to shift toward lower energies as pressure increases
above about 2 GPa. Camassel et al,xl on the other hand,
have claimed that the spectrum exhibits a redshift at a rate of -10 to —30 meV/GPa even in the range 0-1 GPa. All of the authors consider their results favorable to the quan tum confinement effect. It is apparent, however, that fur ther study of the pressure dependence of the optical prop erties is needed to clarify the origin of the PL band.
In this letter, we report experimental results on the effects of hydrostatic pressure on the absorption and PL spectra of free-standing porous Si film. The />-type Si sub strate (boron doped, 10 ft cm) is anodically etched in HF solution (HF:H2O:CyH5OH= 1:4:1) under a current den
sity of 20 mA/cm2 for 20 min (sample A) or 110 min
(sample B). The porous Si layer thus produced is isolated from the substrate electrochemically by raising the current
density to 0.5 A/cm2. The thicknesses of samples A and B
are 19.1 and 93.7 /xm, respectively. Both samples are oxi dized for 48 h in ambient air under illumination by a tung sten lamp.
The samples are cut into pieces with a typical size of
150X ISO fim2. They are usable without further processing, such as lapping. The absorption and PL spectra are mea sured with a microscope-spectrometer system equipped
with a metal-gasketed diamond anvil cell. A fluorocarbon fluid (Sumitomo 3M Fluorinert FC40) is used as the pres sure medium. The 488 nm line of an Ar-ion laser is used for exciting the luminescence, while a tungsten-halogen lamp is used as the light source for the absorption mea surement. The luminescent and transmitted light fluxes are collected with an optical microscope, and are fed into a polychromator through an optical fiber cable. The dis persed light is detected by a CCD camera (Photometries PM 512). The sample is exposed to the laser beam of a power of about 10 mW for 5-20 s to take the PL spectrum under a given pressure. The sensitivity of the polychromator-camera system is calibrated by measuring PL of which the spectrum shape is already known. The pressure in the diamond anvil cell is obtained from the wavelength shifts of the R lines of a small ruby crystal.
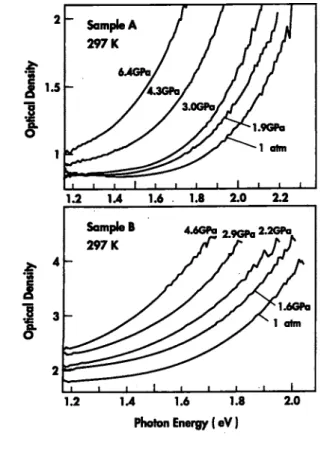
Figure 1 shows the absorption spectra of samples A and B at various pressures up to 6.4 GPa. Under atmo spheric pressure, the spectrum consists of an exponential tail, i.e., Urbach tail and an appreciable background de pending on the sample. The reciprocal of the Urbach slope is 0.23 and 0.30 eV for samples A and B, respectively, at 1 atm. The Urbach tail shifts toward lower energies with increasing pressure. The reciprocal of the Urbach slope appears to increase at a rate of about 0.01 eV/GPa for both samples. Figure 2 shows the photon energies at the optical density of 1.7 for sample A and 3.0 for sample B as a function of pressure. The overall shift of the Urbach tail can be described by a pressure coefficient of about —100 meV/GPa for both samples, though the coefficient seems to change with pressure in the 0-2 GPa region. On reduc ing the pressure, the absorption tail shifts back toward higher energies with hysteresis, as indicated in Fig. 2. If the pressure is completely released, the spectrum still lies on the lower energy side of the initial spectrum. The pressure coefficient is about —80 meV/GPa in this reverse process.
Figure 3 shows the PL spectrum under various pres sures. We note that the intensity is reduced strongly by application of pressure, and is almost quenched under pres sures above 4 GPa. If pressure is reduced to 1 atm, the intensity returns to about a quarter of the initial value. At
346 Appl. Phys. Lett 63 (3), 19 July 1993 0003-6951 /93/63(3)/346/3/$6.00 © 1993 American Institute of Physics 346
1.2 1.4 1.6 1.8 Photon Energy (eV)
FIG. 1. Optical density spectra at various pressures for samples A and B.
any stage of this experiment, the line shape of the PL spec trum can be described well by a Gaussian function and a weak background. The peak position is plotted in Fig. 2 along with the results of the absorption measurements. It is uncertain from the present data whether the PL spectrum obeys a redshift or a blueshift under low pressures. It is evident, however, that the PL spectrum shifts toward lower energies under pressures above 2 GPa. The pressure coefficient is estimated to be from —30 to —40 meV/GPa.
2 4 6
Pressure (GPa)
FIG. 2. Photon energies yielding certain optical densities (1.7 for sample A and 3.0 for B) under pressure. The pressure-increasing and pressure- decreasing runs are indicated by the symbols O and Q» respectively. The photon energies yielding the PL spectrum peak at various pressures are also shown by the symbol ■.
1.4 1.6 1.8 2.0 2.2 Photon Energy (eV)
FIG. 3. PL spectra under various pressures. The solid curves are the experimental PL spectra and the dotted curves are Gaussian curves fitted to the experimental spectra. Numbers indicated are the magnification factors for the vertical scale.
On reducing the pressure, the peak position exhibits an appreciable hysteresis. This hysteresis is unlikely to be in duced by the laser beam irradiation, because the fatigue caused by laser irradiation alone is negligible for the oxi dized sample of porous Si. As mentioned later, the hyster esis in the PL spectrum and the absorption spectrum could reflect the pressure-induced plastic deformation of the po rous structure.
Tables I and II compare the pressure coefficients of absorption and PL bands, respectively, in various mated-
als.18"23
As has been argued by Camassel et al.,17 the molecular
materials are unlikely to be the origin since their absorp tion bands should have positive pressure coefficients. It is also true for the interband absorption of nanocrystallites if a simple "particle in a box" model is concerned. However, each nanocrystallite would have an absorption spectrum dependent on its size, shape, and chemical modifications by hydrogen and/or oxygen. A random distribution of such nanocrystallites might give rise to an exponential absorp tion tail which shows a large negative pressure coefficient.
Another possible origin for the absorption tail of po rous Si is the amorphous structure incorporating oxygen and/or hydrogen. Amorphous semiconductors usually ex hibit the Urbach tail, which shifts with a negative pressure coefficient. The Urbach slope is reduced by pressure be cause of the increased band tailing.21 In fact, the present
TABLE I. Pressure coefficients (dE/dP) of absorption for various materials.
Material Porous Si Crystalline Si
(indirect) Crystalline Si
(direct) a-Si:H a-GeS2
dE/dP (meV/GPa) -80 to -100 -14
52 -10 -100
Energy gap (eV) -2.4
1.1 3.4 -1.2 -3.1
Reference This work
18 19 20 23
347 Appl. Phys. Lett., Vol. 63, No. 3,19 July 1993 Ookubo, Matsuda, and Kuroda 347
TABLE II. Pressure coefficients (dE/dP) of photoluminescence for var ious materials.
Material Porous Si Porous Si Porous Si
<z-Si:H
dE/dP (meV/GPa) -30 to -50 -10 to -30 40 to 90 -18 to -19
Pressure range
(GPa) 2 to 4 1>
2>
8>
Peak
energy (eV) -1.77 -1.75 -1.85 -1.3
Reference This work
17 15 22
experiment shows that the Urbach slope of porous Si is appreciably reduced by pressure. A typical amorphous ma
terial a-Si:H has a pressure coefficient of the Urbach tail20 appreciably smaller in magnitude than that observed in porous Si. The large pressure sensitivity reminds us of
amorphous arsenic and chalcogenide semiconductors23
which have a pressure coefficient of the order of —100 meV/GPa, comparable to the present observation in po rous Si. The uppermost valence band of those amorphous materials is composed of lone-pair nonbonding/? orbitals of chalcogenide atoms. These nonbonding orbitals overlap randomly to form the tail states. Compression enhances the overlap between the nonbonding orbitals so that the uppermost valence band is broadened and the energy gap is reduced.23 If the lone-pair electrons of O atoms in porous Si form the uppermost valence band, as is predicted theo retically for Kautsky-type siloxene crystal,24 the present result can be understood in the same way as in the case of amorphous chalcogenide semiconductors.
The amorphous structure in porous. Si contains many vacant sites which may work as barriers to prevent elec trons from transferring between lattices.4'8 In that case, many localized states with various spatial extensions25"27
will appear near the band edges. The vacancies can easily be compressed so that the degree of the overlap between the localized states might sensitively increase with pres sure. The enhanced tunneling rate broadens the relevant electronic bands, contributing also to the reduction of the optical energy gap.
The PL spectrum of porous Si responds to pressure by a large decrease in the intensity. This phenomenon may partly come from an increase in the nonradiative recombi nation rate. The pressure-induced plastic deformation of the porous structure, which is evidenced by the hysteresis seen in both the absorption and PL bands, is likely to serve to produce nonradiative recombination centers, e.g., Si dangling bonds. Further, a possible enhancement of the tunneling rate due to the increase in the overlap between localized states could promote the nonradiative recombi nation, since the more widely an electron or hole spreads, the more rapidly it would be captured by a nonradiative center. Meanwhile, the pressure coefficient of the shift of the PL band is relatively small. In general, the PL charac
teristics depend on the relaxation process of the photoex- cited electrons and holes, on their population in the radi ative states, and on the recombination processes. Very little is known about the effect of pressure on these factors, so it is difficult at present to pursue why the pressure coefficient differs between the PL and the absorption bands.
The authors (N.O.) appreciate the useful discussions with Professor H. Kamimura, Professor S. Onari, Dr. A.
Oshiyama, Dr. Y. Miyamoto, Dr.Y. Mochizuki,and Dr. Y.
Ochiai, and the valuable support of Dr. R. Lang and Dr.
M. Igarashi. Professor Y. Nishina is also acknowledged for his encouragement in the present work.
*L. T. Canham, Appl. Phys. Lett. 57, 1046 (1990).
2V. Lehman and U. Goesele, Appl. Phys. Lett 58, 856 (1991).
3A. G. Cullis and L. T. Canham, Nature 353, 335 (1991).
4J. C. Vial, A. Bsiesy, F. Gaspard, R. Herino, M. Ligeon, F. Muller, R.
Romestain, and R. M. Macfarlane, Phys. Rev. B 45, 14 171 (1992).
5C. Tsai, K.-H. Li, D. S. Kinsoky, R.-Z. Qian, T.-C. Hsu, J. T. Irby, S.
K. Banerjee, A. F. Tasch, J. C. Campbell, B. K. Hance, and J. White, Appl. Phys. Lett. 60, 1700 (1992).
6S. M. Pokes, J. A. Freitas, Jr., and P. C. Searson, Appl. Phys. Lett. 60, 3295 (1992).
7M. S. Brandt, H. D. Fuchs, M. Stutzmann, J. Weber, and M. Cardona, Solid State Commun. 81, 307 (1992).
8 P. Deak, M. Rosebauer, M. Stutzmann, J. Weber, and M. S. Brandt, Phys. Rev. Lett. 69, 2531 (1992).
9R. P. Vasquez, R. W. Fathauer, T. George, A. Ksendzov, A. Lin, and T. L. Lin, Appl. Phys. Lett 60, 1004 (1992).
10J. C. Tsang, M. A. Tishler, and R. T. Collins, Appl. Phys. Lett. 60,2279 (1992).
11T. George, M. S. Anderson, W. T. Pike, T. L. Lin, R. W. Fathauer, K.
H. Jung, and D. L. Kwong, Appl. Phys. Lett. 60, 2359 (1992).
12 N. Noguchi, I. Suemune, M. Yamanishi, G. C. Hua, and N. Otsuka, Jpn. J. Appl. Phys. 31, L490 (1992).
13 J. M. Perrez, J. Villalobos, P. MacNeill, J. Prasad, R. Cheek, J. Kelber, J. P. Estera, P. D. Stevens, and R. Glosser, Appl. Phys. Lett. 61, 563 (1992).
I4N. Ookubo, H. Ono, Y. Ochiai, Y. Mochizuki, and S. Matsui, Appl.
Phys. Lett. 61, 940(1992).
15 W. Zhou, M. Dutta, H. Shen, J. F. Harvey, R. A. Lux, C. H. Perry, R.
Tsu, N. M. Kalkhoran, and F. Namovar, Appl. Phys. Lett. 61, 1435 (1992).
I6X. S. Zhao, P. D. Persans, J. Schroeder, and Y. J. Wu, Materials Re search Society Fall Meeting, Abstracts, 1992, p. 216.
17 J. Camassel, E. Massone, L. Lyapin, J. Allegre, P. Vicente, A.
Foucaran, A. Raymond, and J. L. Robert, Proceedings of the Interna tional Conference on Physics Semiconductors Conference, Beijing, China, 10-14 August 1992 (unpublished).
18 B. Welber, C. K. Kim, M. Cardona, and S. Rodriguez, Solid State Commun. 17, 1021 (1975).
19R. Zallen and W. Paul, Phys. Rev. 155, 703 (1967).
20B. Welber and M. H. Brodsky, Phys. Rev. B 16, 3660 (1977).
21E. A. Davis, Proceedings ofthe 5th International Conference High Pres sure in Semiconductor Physics, Kyoto, Japan [J. Appl. Phys. 32, Suppl.
32-1, 178 (1993)].
22V" A. Wilkinson, D. J. Dunstan, P. G. LeComber, and R. A. G. Gibson, Philos. Mag. Lett. 59, 37 (1989).
23 S. Onari, T. Inokuma, H. Kataura, and T. And, Phys. Rev. B 35, 4373 (1987).
24K. Takeda and K. Shiraishi, Solid State Commun. 85, 301 (1993).
25S. Kirkpatrick and T. Eggarter, Phys. Rev. B 6, 3598 (1972).
26Y. Shapier, A. Aharony, and A. B. Harris, Phys. Rev. Lett. 49, 486 (1982).
27K. C. Chang and T. Odagaki, Phys. Rev. B 35, 2598 (1987).
348 Appl. Phys. Lett., Vol. 63, No. 3, 19 July 1993 Ookubo, Matsuda, and Kuroda 348