Development of Method to Estimate Fuel Consumption Reduction Based on Time Sharing of Driving Modes
- Case of Promotion of Hybrid Cars in Bangkok -
(走行モードの時間割合に基づく燃料消費削減量推定方法の開発
‐バンコクにおけるハイブリッドカー普及の例‐)
January 2017
Transportation Engineering and Socio-Technology Major Graduate School of Science and Technology
Doctoral Course Nihon University
Napon Srisakda
i
DEVELOPMENT OF METHOD TO ESTIMATE FUEL CONSUMPTION REDUCTION BASED ON TIME SHARING OF DRIVING MODES
- CASE OF PROMOTION OF HYBRID CARS IN BANGKOK -
by
Napon Srisakda
A dissertation submitted in partial fulfillment of the requirements for the degree of Doctor of Engineering
Examination Committee: Professor Dr. Atsushi Fukuda (Chairman) Nihon University, Japan
Professor Dr. Sumio Shimokawa Nihon University, Japan
Associate Professor Dr. Tetsuhiro Ishizaka Nihon University, Japan
Associate Professor Dr. Sorawit Narupiti Chulalongkorn University, Thailand
Department of Transportation Engineering and Socio-Technology Graduate School of Science and Technology
Nihon University Japan
January 2017
ii
iii
ACKNOWLEDGEMENTS
This dissertation could not be completed successfully without many suggestions and incredible supports from many people. I would like to thank and dedicate a part of the success to all of them.
First of all, I would like to express my profound gratitude to my supervisor, Prof.
Dr. Atsushi Fukuda, for his valuable advice and encouragement throughout my study at Nihon University. I deeply appreciate his enduring supervision, kindly provision, the unlimited support and all the valuable time and efforts contributed for my accomplishment. His guidance and recommendations are precious in my future professional life.
Second of all, I would like to express my sincere gratitude to my examination committee members, Prof. Dr. Sumio Shimokawa, Assoc. Prof. Dr. Tetsuhiro Ishizaka, and Assoc. Prof. Dr. Sorawit Narupiti for their valuable comments and recommendations.
I also would like to extend my appreciation to other faculty members of department of Transportation Engineering and Socio-Technology for their valuable comments during my defense preparation. Their suggestions are highly appreciated.
I also would like to use this opportunity to thank Dr. Tuenjai Fukuda for invaluable guidance about studying Ph. D. and Asst. Prof. Joseph Falout for his precious time to assist in my English study.
My sincere appreciation is also extended to all Japanese language teachers and staffs at Japanese Language Programs of Nihon University. All of what I learned from them is very essential to my life and study in Japan.
Special thanks are conveyed to all members of Transportation System Laboratory, especially to Dr. Sathita, Dr. Ikeshita, Mr. Sorlaxin, Mr. Kikuchi, Mr.
Higashiyama, Ms. Hatakeyama, Ms. Fukumuro, Mr. Khamphan, Mr. Aoyagi, Mr.
Minegishi, Ms. Kawaguchi, and other members, for their incessant support in various matters during my stay at Nihon University.
Last but not least, I would like to express my deepest appreciate to my beloved parents, my older sisters, and many who are my inspiration. Without their constant support, and concernedness made for the accomplishment in my life, I would not have come this far. I am forever indebted to them. This dissertation is dedicated to them.
iv
v ABSTRACT
Estimation of fuel consumption reduction in road transport sector is important to mitigate greenhouse gas (GHG) emission. Especially in developing cities which suffer from traffic congestion, the policies in road transport sector such as promoting environmentally friendly cars, alleviating traffic congestion, etc., are expected to reduce fuel consumption significantly. In order to estimate an impact on fuel consumption reduction by these policies in a city, driving state of vehicles influencing fuel consumption should be considered. However, estimation of fuel consumption is not easy due to fluctuation and unstableness of driving state in various conditions.
Recently, probe data, installed into many vehicles by Global Positioning System (GPS) devices, have been used as one of ways to reveal driving state, widely and dynamically changed in an urban area. If driving states of a vehicle can be represented by separating into driving modes travelled including stopping, accelerating, cruising, and decelerating modes, it is possible to estimate fuel consumption by considering actual driving states of a vehicle. Thus, in this study, the proportion of accumulated time in each driving mode is defined as “Time Sharing of Driving Modes” and estimate fuel consumption by applying these modes.
However, basic driving modes including stopping, accelerating, cruising, and decelerating are insufficient to explain the impacts of fuel consumption reduction by promoting environmentally friendly cars. Thus, crawling mode that occurs frequently during congestion period is not clearly evaluated on the basic four driving modes. The characteristics of fuel consumption in this driving state are considered to be significantly different from the stopped state, the cruising state and the acceleration mode. Therefore in this study, estimation method of the fuel consumption reduction reflecting the actual traffic condition was proposed by defining the crawling mode as another driving modes and adding to the determination of the time sharing of driving modes. In addition, it is possible to evaluate the policies, in which fuel consumption is changed significantly by driving modes, such as promoting environmentally friendly cars.
By the conceptual idea already explained, the specific objectives are to develop method to estimate fuel consumption of vehicle by using time sharing of driving modes with crawling as an additional mode. In order to examine the applicability of the proposed method in this study, promotion of hybrid cars which is expected to reduce fuel consumption significantly, in the Bangkok Metropolitan Area (BMR) in Thailand, where traffic congestion is quite serious and probe data are being collected and provided, was
vi selected as the case study.
The dissertation consists of seven chapters as follows.
Chapter 1, Introduction, presents background, problems, and objectives of the dissertation.
Chapter 2, Literature Review, presents overview of estimation of fuel consumption in road transport sector, and previous studies including estimation of fuel consumption using driving modes and fuel consumption reduction by promoting hybrid cars. Among of these studies, they considered only few test vehicles in the fields without sufficient data reflecting driving states of all roadways. There were using vehicle kilometer traveled (VKT) to estimate fuel consumption; however, VKT cannot determine and well reflect driving states although it can cover all roadways in the urban area. Some studies used probe data for estimation of fuel consumption to study the impact on promoting hybrid cars or other environmentally friendly cars, but probe data were used only as test vehicles, which could not sufficiently cover all vehicles and were used for identifying only traffic conditions. Regarding crawling of vehicles, there were some studies similar to this behavior of vehicles, called stop-and-go that lead to sharp increase or decrease in acceleration. However, probe data cannot provide more details of speed data to indicate stop-and-go, because vehicles in this situation will stop and move immediately. On the other hand, crawling of vehicles can explain traffic congestion and can define as another driving mode better than using stop-and-go, because it can explain traffic congestion although speed data obtained from probe data are rough. Thus, it is expected that crawling mode can contribute to capture traffic congestion instead of using stop-and-go. In addition, no previous studies defined about crawling behavior for estimation of fuel consumption.
Chapter 3, Research methodology, describes how to define driving modes for time sharing calculation and explains data collection. Four basic driving modes including stopping, accelerating, cruising, and decelerating can be defined by using speed data and its transition in every 5 seconds. Additional driving mode (crawling) can be observed by speed profiles that fluctuation of speed data are approximately between 1 to 10 km/h. For data collection in this study, two main data were collected: probe data and fuel consumption data. Probe data were obtained from the operation of 10,000 taxis in BMR to calculate time sharing of driving modes in each speed range. Data were divided into the inner and the outer area of BMR in 30 days for different days of week (weekdays and weekends), periods (morning peak, off peak, and evening peak), and road categories (highways, arterials, and minor roads). Fuel consumption data were obtained from field
vii
test of one conventional gasoline car and one hybrid car to determine fuel consumption in each driving modes and speed range. After that, two main data were used to estimate fuel consumption in BMR both in ordinary case and hybrid cars replacement case. Two cases were compared each other for estimating fuel consumption reduction. Finally, the results of estimation of fuel consumption reduction were examined for reliability confirmation.
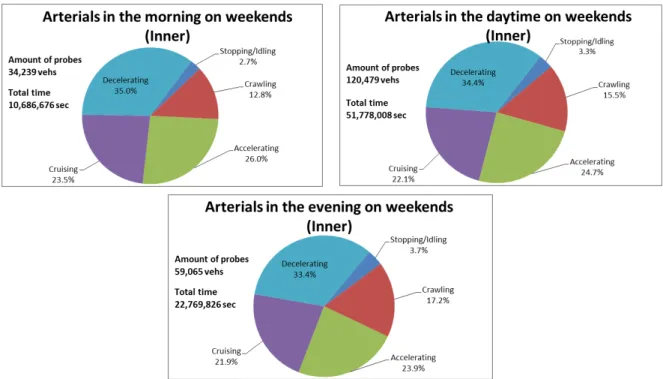
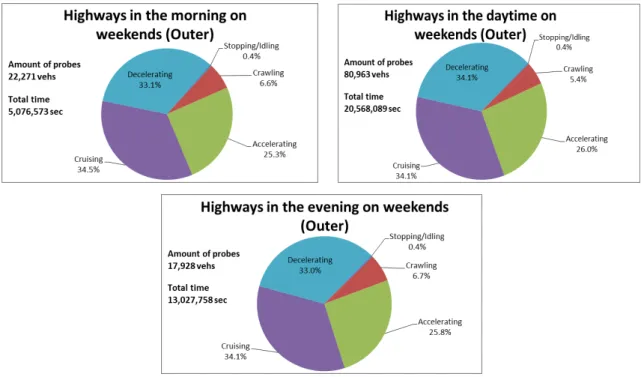
Chapter 4, Estimation of time sharing of driving modes, represents the determination of time sharing of driving modes based on probe data. The results of them in all conditions indicate that decelerating mode spends the greatest time percentage in most cases (25-35%), while cruising mode is the second (20-30%), and the third is accelerating. Although time percentages of crawling mode are less than first three driving modes, crawling mode can indicate traffic congestion that is readily seen by increased time percentages of crawling mode (5-25%). If only stopping mode is considered, traffic congestion impact would not be clearly seen. Stopping and crawling percentages in the inner areas are greater than in the outer areas in all cases, and high percentages of them are readily seen only on minor roads in the inner area. In addition, time sharing of driving mode from probe data can be proved that it is reliable when compared to observe data obtained from video detection. Thus, time sharing of driving modes including four basic driving modes and additional driving mode (crawling) based on probe data can be used for estimation of fuel consumption.
Chapter 5, Measurement of fuel consumption by field test, shows the results of fuel consumption collected by one hybrid car and one conventional gasoline car. Two cars were operated together along the same selected roadways in the inner area of BMR for different days of week, periods, and road categories. Fuel consumption were calculated in the unit of cubic centimeters per second (cc/sec) both conventional gasoline car and hybrid car in each driving mode and speed range. In addition, time frequency during gasoline engine operated and off-operated can be also indicated. Time frequency during off-operated can be detected in hybrid car and there is also no fuel consumption because hybrid system is operated by electricity. When fuel consumption reduction in each driving mode both with and without considering crawling mode are compared, the fuel consumption in accelerating mode in with case is higher than in without case. The reason of difference is because slow acceleration is removed from original acceleration mode.
Moreover, crawling mode can provide much difference results of fuel consumption in conventional gasoline car. Thus, fuel consumption on crawling mode can be significantly reduced if hybrid car replace conventional gasoline car.
Chapter 6, Estimation of fuel consumption reduction by promoting hybrid cars, estimates fuel consumption reduction by two defined scenarios in this study are (1) All
viii
probe cars (10,000 taxis) are replaced by hybrid cars and (2) Private cars in BMR are replaced by hybrid cars. For the first scenario, fuel consumption rates in the unit of cubic centimeters per vehicle per kilometer (cc/veh/km) and reduction percentages are summarized. From area and days of week results, the highest consumption rate is in the inner area on weekdays in without HV case. When road category is considered, the highest consumption rate is on arterials on weekdays. Regarding reduction percentages, fuel consumption reductions are clearly observed in the inner area on weekdays on arterials. For the second scenario, the aim of this scenario is to estimate fuel consumption for studying reduction impacts if amount of hybrid cars increase from the present year to 15 years later by the policy that “hybrid car sales will be 25 % in 2030 of private cars.”
Fuel consumption can be estiamatd by proposed equations applied from vehicle kilometer traveled (VKT) by using time sharing of driving modes, amount of detected probe cars, and average speed from probe data. As a results, with hybrid car replacement case can reduce fuel consumption by the highest redution percentages in 2026 equal to 474 kiloton of oil equivalent (ktoe), as calculated to 4.47% in comparison with all vehicles in BMR and 8.52% in comparison with only private cars.
For examination of reliability of estimation, fuel consumption rate and its reduction estimated by probe data is compared with the actual fuel consumption measured by field test and observed fuel consumption in transport sector during 2011 to 2015 obtained from energy policy of and planning office, Ministry of energy of Thailand (EPPO). The examinations found that percentage difference between estimation and observation in base year in 2011 is the highest different, accounted to 25%. After that, percentage differences can decrease until in the year of 2015, accounted for 13%. That means it can be proved that estimation of fuel consumption by proposed equations can be used for estimation of fuel consumption reduction by promoting hybrid cars. Regarding fuel consumption reduction, different percentages in most conditions are not very different from each other. That means the examination of estimation of fuel consumption reductions from probe data are confirmed in its reliability.
Chapter 7, Conclusions, addresses conclusion including the main contributions of the dissertation. In this dissertation, development of estimation of fuel consumption reduction in this dissertation based on time sharing of driving modes has the great advantage for the future policy implementation to reduce fuel consumption in road transport sector, and can be applied in other cities if probe data are available. Moreover, proposed additional driving mode (crawling) can provide the different results between with and without considering it by indicating traffic congestion and estimating fuel consumption in conventional gasoline car on accelerating mode. Thus, fuel consumption on crawling mode can be reduced if hybrid car replace conventional gasoline car.
ix
TABLE OF CONTENTS
Chapter Title Page
Title Page i
Acknowledgements
Abstract iii
Table of Contents ix v
List of Tables xi
List of Figures xiii
1
2
3
4
INTRODUCTION 1
1.1 Background 1
1.2 Statement of Problem 2
1.3 Purpose and Objectives 2
1.4 Scope of Study 3
1.5 Dissertation Outline 3
LITERATURE REVIEWS 7
2.1 Estimation of Fuel Consumption in Road Transport Sector 7 2.1.1 Situations of fuel consumption in road transport sector 7
2.1.2 Estimation of fuel consumption 8
2.2 Previous Study on Estimation of Fuel Consumption Using Driving
Modes 11
2.3 Impacts of Promoting Hybrid Cars 14
2.3.1 Hybrid cars 14
2.3.2 Previous study on impact of promoting hybrid cars 17
2.4 Crawling Behavior of Vehicles 18
2.5 Concluding Remarks 19
RESEARCH METHODOLOGY 25
3.1 Methodological Process 25
3.2 Time Sharing of Driving Modes for Estimation of Fuel Consumption 27
3.3 Case Study 28
3.4 Data Collection of Driving Modes and Fuel Consumption 30
3.5 Concluding Remarks 31
ESTIMATION OF TIME SHARING OF DRIVING MODES 35
4.1 Definition of Driving Modes 35
4.1.1 Four basic driving modes 35
4.1.2 Additional driving modes (crawling) 35 4.2 Estimation of Time Sharing of Driving Modes based on Probe Data 37 4.3 Results of Time Sharing of Driving Modes based on Probe Data 38 4.3.1 Time sharing of driving modes on weekdays 38 4.3.2 Time sharing of driving mode diagrams on weekends 41
4.3.3 Driving mode percentages 46
4.4 Impact of Considering Crawling Mode in Driving Modes 51 4.5 Examination of Reliability of Time Sharing of Driving Modes 52
4.6 Concluding Remarks 53
x 5
6
7
MEASUREMENT OF FUEL CONSUMPTION BY FIELD TEST 55
5.1 Field Test 55
5.2 Analysis of Data Measured by Field Test 58
5.2.1 Driving comparison between conventional and hybrid cars 58 5.2.2 Driving comparison between field test data and probe data 61 5.3 Results of Measurement of Fuel Consumption by Categories 66 5.4 Verification of Fuel Consumption Measured by Field Test 73 5.5 Difference of Estimation of Fuel Consumption between With and
Without Considering Crawling Mode 75
5.6 Concluding Remarks 77
ESTIMATION OF FUEL CONSUMPTION REDUCTION BY
PROMOTING HYBRID CARS 79
6.1 Scenarios for Estimation of Fuel Consumption Reduction by
Promoting Hybrid Cars 79
6.1.1 The first scenario 79
6.1.2 The second scenario 79
6.2 Estimation of Fuel Consumption Reduction in Case of Replacing All
Probe Cars by Hybrid Cars 80
6.3 Estimation of Fuel Consumption Reduction in Case of Replacing
Private Cars in BMR by Hybrid Cars 82
6.3.1 Necessary data for estimation of fuel consumption reduction
by promoting hybrid cars 82
6.3.2 Results 91
6.4 Verification of Reliability of Estimation of Fuel Consumption
and Its Reduction 96
6.5 Concluding Remarks 98
CONCLUSIONS 103
7.1 Conclusions 103
7.2 Recommendations 105
xi
LIST OF TABLES
Table Title Page
4.1 Summary of time sharing of driving modes on weekdays 49 4.2 Summary of time sharing of driving modes on weekends 50 4.3 Time percentage of stopping and crawling modes between field observation and
probe data in each traffic cycle time 52
5.1 Properties of two cars for field test 55
5.2 Comparison of speed and acceleration between conventional car (CON) and
hybrid car (HV) on weekdays 58
5.3 Comparison of average speed between probe data and field test data 62 5.4 Comparison of stopping mode between probe data and field test 63 5.5 Comparison of crawling mode between probe data and field test 63 5.6 Comparison of accelerating mode between probe data and field test 63 5.7 Comparison of cruising mode between probe data and field test 64 5.8 Comparison of decelerating mode between probe data and field test 64 5.9 Fuel consumption (cc/sec) and time frequency (sec) in each condition 67 5.10 Fuel consumption rates (cc/veh/sec) between estimation from probe data and
actual measurement by field test on weekdays 73
5.11 Fuel consumption rates (cc/veh/sec) between estimation from probe data and
actual measurement by field test on weekends 74
5.12 Fuel consumption with and without considering crawling in conventional
gasoline car 76
5.13 Fuel consumption with and without considering crawling in hybrid car 76 6.1 Share of HV for private cars for vehicle sales in EEDP scenario (%) 80
6.2 Cumulative percentage of ADT in each period 84
6.3 Fuel share percentage of vehicle stock in 1997 in each vehicle type and
vehicle sales during 1997 to 2008 88
6.4 Fuel economy of vehicles by fuel types 89
6.5 Share of HV sales for private cars from proposed policy 94 6.6 Fuel consumption between estimation and observation from DEDE [13] 97 6.7 Fuel consumption rates (cc/veh/km) of conventional and hybrid cars
and their reductions between probe taxis and field test 98
xii
xiii
LIST OF FIGURES
Figure Title Page
1.1 Structure of dissertation 4
2.1 The mechanism of hybrid car 15
2.2 Series and parallel hybrid system 16
3.1 Methodological process 25
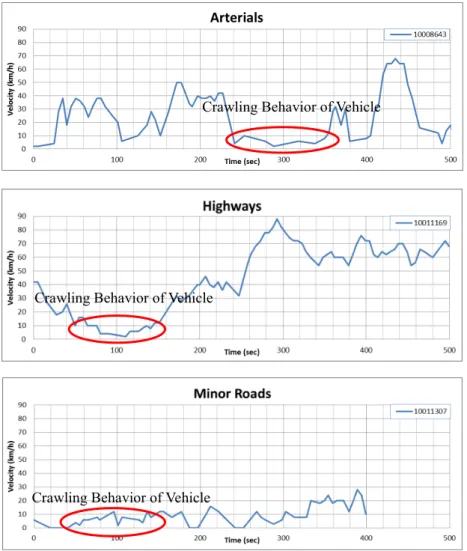
3.2 Speed profiles showing four basic driving modes 27 3.3 Examples of speed profiles obtained from probe data reflecting
crawling behavior 28
3.4 Study area for case study 29
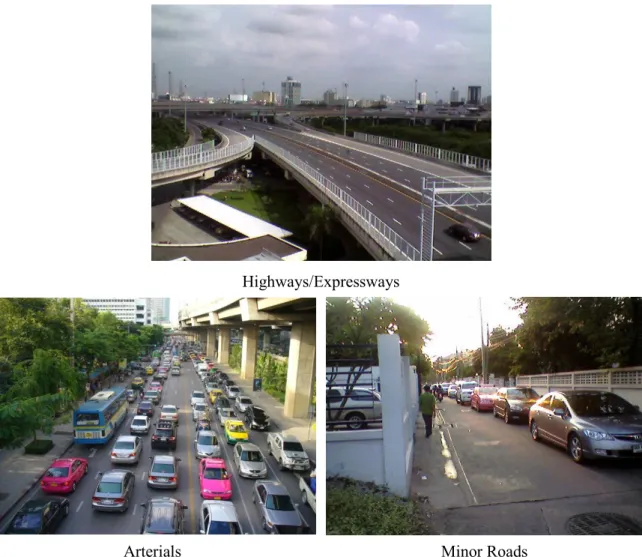
3.5 Examples of three road categories 30
3.6 Steps for collecting fuel consumption 31
4.1 Methodology and the algorithm for identifying crawling mode 36 4.2 The algorithm for identifying 4 basic driving modes 37
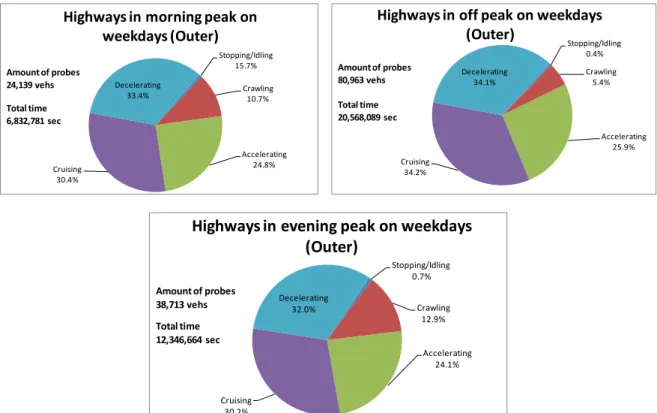
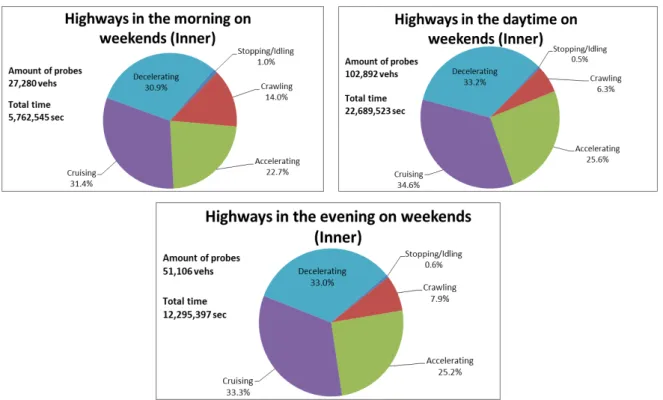
4.3 Characterization of probe data 37
4.4 Time sharing of driving modes on highways on weekdays in inner area 38 4.5 Time sharing of driving modes on arterials on weekdays in inner area 39 4.6 Time sharing of driving modes on minor roads on weekdays in inner area 39 4.7 Time sharing of driving modes on highways on weekdays in outer area 40 4.8 Time sharing of driving modes on arterials on weekdays in outer area 40 4.9 Time sharing of driving modes on minor roads on weekdays in outer area 41 4.10 Time sharing of driving modes on highways on weekends in inner area 41 4.11 Time sharing of driving modes on arterials on weekends in inner area 42 4.12 Time sharing of driving mode on minor roads on weekends in inner area 42 4.13 Time sharing of driving modes on highways on weekends in outer area 43 4.14 Time sharing of driving modes on arterials on weekends in outer area 43 4.15 Time sharing of driving modes on minor roads on weekends in outer area 44 4.16 Time percentages of driving modes on arterials on weekdays 45 4.17 Driving mode percentages in each period and days of week on highways 46 4.18 Driving mode percentages in each period and days of week on arterials 47 4.19 Driving mode percentages in each period and days of week on minor roads 47 4.20 Stopping and crawling percentages in each condition 51
5.1 Two cars for field test 55
5.2 Two routes for field test 57
5.3 Comparison of speed profiles between conventional and hybrid cars 59 5.4 Comparison of instantaneous fuel consumption between conventional and
hybrid cars 60
xiv
5.5 Comparison of revolution of engine between conventional and hybrid cars 61 5.6 Speed distributions between probe data and field test on highways 64 5.7 Speed distributions between probe data and field test on arterials 65 5.8 Speed distributions between probe data and field test on minor roads 65 5.9 Fuel consumption between conventional and hybrid cars in each condition 66 5.10 Comparison of fuel consumption rates between actual measurement and
estimation of probe data 74
5.11 Total fuel consumption between with and without considering crawling mode 75 6.1 Results of fuel consumption rates and reduction percentages
in each consideration 81
6.2 Road network data together with link traffic volume 83 6.3 Hourly percentages of ADT on weekdays and weekends 83 6.4 Number of all types registered vehicles in BMR during 2004 to 2016 and
the trend of growth rate 85
6.5 Number of registered vehicles and percentage of vehicle share by vehicle
type form DLT [9] 86
6.6 Total daily traffic volume during 2011 to 2031 91 6.7 VKT from probe data compared with previous research [6] during 2011 to 2031 92 6.8 Percentage share of vehicle type during 2016 to 2031 93 6.9 Percentage share of fuel during 2016 to 2031 in private cars
in case of without HV 94
6.10 Percentage share of fuel during 2016 to 2031 in private cars
in case of with HV 95
6.11 Fuel consumption and its reductions both in comparison of all vehicles
in BMR (above) and only private cars (below) 96
1
CHAPTER 1 INTRODUCTION
1.1 Background
Estimation of fuel consumption in road transport sector is important to evaluate policies for mitigation of fuel consumption and greenhouse gas (GHG) emission.
However, because fluctuation and unstableness of driving patterns depends on traffic conditions, fuel consumption is difficult to estimate. Especially in traffic congestion, as indicated by low average speed and non-smooth traffic flow, fuel consumption increases and its estimation is extremely difficult [1, 2, 3].
Floating car data or probe data are one of the real-world data that can reflect driving patterns, because they are a source of high quality actual data and are available in the implementation of Intelligent Transportation Systems (ITS) [4]. Benefits of probe data are not only for being a raw data to determine congestion measures, safety measures, traffic control management, and logistics, but they are also for indicating driving patterns based on their speed and time stamped data. Thus, floating car data or probe data, well reflecting traffic conditions, can be used as data for estimation of fuel consumption.
Fuel consumption cannot be measured directly from probe cars because it is not practical to install fuel consumption measurement devices on all probe cars. In addition, devices for fuel consumption measurement require high time resolution (Less than 1 second interval), but data from probe cars cannot be obtained at this high time resolution.
Thus, the method to estimate fuel consumption reduction based on probe data should be proposed.
Speed data obtained from probe data can explain driving patterns based on speed profiles, because they can differentiate driving modes of actual travel indicating stopping, accelerating, cruising, and decelerating driving periods. In this study, the proportion of accumulated time in each driving mode is applied and defined as “Time Sharing of Driving Modes.” Implementing time sharing of driving modes gives clearer explanation of driving patterns than only interpretation of average speed or acceleration data.
Therefore, time sharing of driving modes based on probe data is one of applicable methodology for development of estimation of fuel consumption.
Crawling is a behavior of vehicles in traffic stream, which is the transition
2
driving state between stopping/idling and full moving of vehicle occurring in congestion periods. Crawling behavior is very common, especially during peak hours on weekdays.
Since crawling of vehicles can reflect traffic congestion not only vehicle stopping, estimation method of the fuel consumption reduction reflecting the actual traffic condition is proposed by defining the crawling mode as another driving modes and adding to the determination of the time sharing of driving modes.
1.2 Statement of Problem
Because of fluctuation and unstableness of driving conditions, fuel consumption in real-world is not easy to estimate. To estimate fuel consumption of a vehicle, a set of data representing actual driving condition is required. Probe data, installed into many vehicles, are one of the real-world data, which can provide vehicle location, speed, direction, and time stamp, and can reflect driving patterns in actual traffic conditions.
According to crawling behavior of vehicles, which is the transition state between stopping/idling and full moving of vehicle, occurs frequently during traffic congestion;
however, no previous studies have considered about this behavior and include it for estimation of fuel consumption. Although there were studies about how to define the threshold speed for vehicle crawling [5, 6], crawling behavior of vehicles in different study sites and traffic conditions is probably different. These studies did not focus on congestion periods and different conditions (such as sub-area, days of week, or road category), and have not yet been analyzed to study the impacts on estimation of fuel consumption.
1.3 Purpose and Objectives
The aim of this dissertation is to propose a development method to estimate fuel consumption and exemplify the use of the method in a case of a promotion of more environmentally friendly cars. The specific objectives are as follows.
To propose crawling mode as an additional driving mode
To determine time sharing of driving modes collected from probe data in various traffic conditions for estimation of fuel consumption
To study the impact of fuel consumption reduction by promoting environmentally friendly cars
3 1.4 Scope of Study
This dissertation proposes a development method to estimate fuel consumption based on time sharing of driving modes collected from probe data. Moreover, the estimation method is demonstrated in the case of promoting one type of environmentally friendly cars; hybrid cars in a developing city. Bangkok Metropolitan and Region area (BMR), Thailand, was selected as case study to test the estimation of fuel consumption considering vehicle crawling.
Probe data were collected from 10,000 taxis operated on roads in BMR and were analyzed in various conditions including sub-areas, days of week, periods, and road categories. Driving modes were classified to 5 modes including stopping, accelerating, cruising, decelerating, and an additional driving mode (crawling).
Impact on promoting hybrid cars can be estimated by comparison between ordinary case (without hybrid cars) and hybrid cars replacement case (with hybrid cars) in study area. Moreover, the results of estimation of fuel consumption were verified with actual fuel consumption collected by observation in field test for reliability confirmation.
1.5 Dissertation Outline
This dissertation consists of seven chapters as shown in Figure 1.1. Chapter 1 introduces the background, statement of problems, objectives, and scope of this study.
Chapter 2 explains the literature review about the overview and previous studies of estimation of fuel consumption, the impacts of promoting hybrid cars and the overview of crawling behavior of vehicles. In addition, it summarizes all existing studies and points out the research gaps of existing studies. Chapter 3 describes the process of research methodology and explains the method for how to collect data. Chapter 4 determines the results of time sharing of driving modes collected from probe data in various traffic and driving conditions and also verifies these results by observed data. Chapter 5 explains descriptive data analysis of hybrid car and conventional gasoline car by field test in each condition, and indicates the results of fuel consumptions received from them. Chapter 6 determines the results of estimation of fuel consumption based on probe data, the impacts of promoting hybrid cars, and the reliability of estimation of fuel consumption and its reduction. Finally, Chapter 7 gives the conclusions and recommendations.
4
Chapter 1: Introduction
Background and Objectives
Chapter 2: Literature Reviews
Overview and Previous Studies, and Research Gaps
Chapter 3: Research Methodology
Methodology Process and Data Collection
Chapter 4: Estimation of Time Sharing of Driving Modes
Initial Data for Estimation
Chapter 5: Measurement of Fuel Consumption by Field Test
Initial Data for Estimation
Chapter 6: Estimation of Fuel Consumption Reduction by Promoting Hybrid Cars
Results of Estimations in each Scenario
Chapter 7: Conclusions Figure 1.1 Structure of dissertation
5
REFERENCES
1. Zhang, K. et al. (2011). Vehicle Emissions in Congestion: Comparison of Work Zone, Rush Hour and Free-Flow Conditions. Atmospheric Environment, vol. 45, pp.1929-1939.
2. Choudhary, A. and Gokhale, S. (2016). Urban Real-World Driving Traffic Emissions during Interruption and Congestion. Transportation Research Part D, vol.43, pp.59-70.
3. Barth, M. and Boriboonsomsin, K. (2008). Real-World CO2 Impacts of Traffic Congestion. Journal of the Transportation Research Board, no.2058.
4. Leduc, G. (2008). Road Traffic Data: Collection Methods and Applications. Seville, Joint Research Centre - Institute for Prospective Technological Studies, European Commission.
5. Ko, J.H. et al. (2008). Measuring Control Delay Using Second-By-Second GPS Speed Data. Journal of Transportation Engineering, vol.8, no.134.
6. Mousa, R.M. (2002). Analysis and Modeling of Measured Delays at Isolated Signalized Intersections. Journal of Transportation Engineering, vol.4, no.128, pp.347-354.
6
7
CHAPTER 2
LITERATURE REVIEWS
2.1 Estimation of Fuel Consumption in Road Transport Sector 2.1.1 Situations of fuel consumption in road transport sector
Globally, the transport sector has contributed to one-third of overall energy consumption and is the second largest energy consuming sector after the industrial sector.
In 2009, it accounted for 29% of total energy consumption [1].
Many countries report fuel consumption in transport sector. For example, in Japan, fuel consumption in transport sector is the third largest energy consuming sector after industrial sector and residential and commercial sector that account for 24.4% and 24.6% in 1996 and 2010, respectively [2]. In European countries, transport sector can account for around a third of all energy consumption [3]. In United States, the transport sector is the second largest energy consuming sector after the industrial sector, accounting for 29% of the total energy consumption in 2009 [1].
In developing countries, like Thailand, the transport sector consumes a plenty of energy every year, in which this sector shares more than 35% of total energy consumption [1] and the consumption has increased with 4.4% average annual growth rate from 11,368 kiloton of oil equivalent (ktoe) in 1990 to 23,097 ktoe in 2008. Within this sector, approximately 75.7% of the energy is used in road transportation [4].
By comparing of fuel consumption between developed and developing countries, it was found that transport sector in developing countries proportionally consumes more energy than those in developed countries. Partly this may be due to condition of traffic (congestion) and less quality of combustion of vehicles. Thus, energy consumption in transport sector in developing countries must be concerned for environmental problems in the world.
Most of energy used in transport sector is fossil fuels [1]. The share of fossil consumption increases from 50% in 2002 to 53% in 2007 and is forecasted to reach 61%
in 2035. Especially in gasoline, many developing countries still use this kind of fossil energy as the main source of fuel for vehicles. For example, it has been reported that in China nearly 50% of total Chinese gasoline consumption was in transport sector.
8
Moreover, fossil fuel represents 98%, 97% and 97% of total transport fuel consumption in China in 2000, 2005 and 2010, respectively. In 2008, the transport sector of USA was responsible for 70% of fossil consumption and 28% of total greenhouse gas emissions [5].
High fossil consumption emits high Green house gas (GHG) in which CO2 is the most essential part of it. CO2 emission from fossil fuel combustion in transport sector has received much attention [6]. Therefore, if fuel consumption can be reduced in road transport sector, CO2 emission that is the main cause of global warming or climate change can be mitigated.
For mitigating fuel consumption, there are many countermeasures for low-carbon emission in transport sector, which can be divided into 4 categories by Dalkmann and Brannigan [7]. They consist of (1) decreasing travel demand, especially private transport mode, by travel demand management (TDM); AVOID, (2) shifting to environmentally friendly transport modes such as public or non-motorized transportation modes; SHIFT, (3) improving the energy efficiency by inventing vehicle technology;
IMPROVE, and (4) increasing bio-fuels usage by blending them with fossil fuel such as gasoline or biodiesel promotion; SWITCH-FUEL.
The aims of IMPROVE countermeasures is to improve energy efficiency of automobiles in which environmentally friendly cars are examples of improving energy efficiency for reducing fossil fuel consumption. In this study, hybrid cars which is one type of environmentally friendly cars, is focused for studying the impact on fuel consumption reduction because this vehicle has been brought to the auto market in Thailand recently and it is still questionable how much driver can save their money in different driving modes as well as traffic conditions by introducing hybrid car.
Meanwhile, although electric vehicles have been used or promoted in Thailand, they have been implemented only in restricted area, especially in universities, not for commercials due to insufficient electricity charge stations covered all area of a city in Thailand [8]. In addition, they can operate only in low speed range.
2.1.2 Estimation of fuel consumption
Fuel consumption is one of activity rates for estimation of GHG emission [9].
Activity rate in road transport sector can be fuel consumed (volume of fuel; liters or cubic centimeters), or distance traveled (vehicle kilometer or mile traveled; VKT or VMT). The International Energy Agency (IEA) Mobility Model (MoMo) [10] proposed basic equation in order to estimate energy consumption and GHG emissions as shown in
9 Equation 2.1.
𝐺 = 𝑃
𝑖 𝑗 𝑖,𝑗𝑈
𝑖,𝑗𝐶
𝑖,𝑗𝐸
𝑖,𝑗 (2.1)Where G = The total energy demand (or GHG emissions) from road
transport sector (calorific value used; MJ or weight of GHG; kg of CO2)
Pi,j = The number of vehicles interested for vehicle type i which use fuel type j (vehicles)
Ui,j = The travel distance of vehicle type i for fuel type j (kilometers) Ci,j = The energy (or fuel consumption) per distance
Ei,j = The specific energy content of fuel or emission factor of vehicle type i for fuel type j (MJ/liters or kg of CO2/liters)
Equation (2.1) is total energy demand or GHG emission in macro scale depending on number of vehicles interested and their running distances. For reflecting traffic data of all traffic system, traveled distance of vehicles (vehicle kilometer or mile traveled; VKT or VMT) was the initial data for estimation of fuel consumption or GHG emission. VKT or VMT can be calculated by two ways. The first is odometer reading of each vehicle that can obtain distance directly. Another one is traffic volume in each road section that VKT or VMT can be calculated by traffic volume multiplied by distance in each road section. There is a lot of literature using VKT or VMT in order to estimate fuel consumption or GHG emission as follows;
Pongthanausawan [11] forecasted fuel consumption and CO2 emission of road transport in Thailand from 2008 to the year 2030, and also access the potential and impacts of possible alternative fuels and high energy efficient vehicle technologies in road transport sector to reduce end-use energy demand and life cycle CO2 emission. This study also used VKT from surveyed data.
Fukuda et al. [12] used surveyed VKT collected in a developing city, Khon Kaen, Thailand, by odometer reading of random vehicles in order to estimate CO2 emission by dividing vehicle and engine types. Collected VKT was obtained as average annual VKT.
Then, it was multiplied by number of register vehicles in this city, fuel usage share, and divided by average fuel efficiency to obtain fuel consumption of each fuel type. Finally, CO2 emission could be estimated by the multiplying between fuel consumption and emission factor.
10
Chang et al. [13] and Li et al. [14] applied International vehicle emission (IVE) to estimate real-time traffic CO2 emission in Beijing, China. VKT was collected from road detectors and it was used as a multiplier together with emission factor of each vehicle type and several factors (such as vehicle type percentage, driving mode percentage, speed correlation factor etc.).
Wang et al. [15] displayed a scenario analysis to estimate CO2 reduction in China by developing strategies consisting of vehicle technology improvement, introducing BRT, and fuel switching. VKT were used as a multiplier to estimate CO2 emission and to be also the results of its future prediction based on GDP, growth rates, and elastic factor of amount of vehicles.
Chollacoop et al. [16] estimated the impacts of fuel consumption by the policy of promoting biofuel on road transportation in Thailand. They used bottom down energy demand model to estimate its impacts based on number of vehicles, and VKT collected in this country. Also, this study forecasted the future impacts from 2010 to 2034 by using Long-range energy alternative planning system (LEAP) model that number of vehicles and VKT could be projected based on socio-economic data such as GDP or population.
Nakamichi et al. [17] conducted OD trips from interview survey data and ran them into Micro simulation model in order to estimate CO2 emission for freight transport in Khon Kaen, Thailand. This study estimated the impacts of CO2 emission by the scenarios of transport oriented (EV) pick up promotion in 2050. VKT could be obtained from OD, which is calculated from simulation model and the initial data for receiving traffic volume. Then, traffic volume was multiplied by distance in each road section to obtain VKT.
From literature, VKT or VMT can be used to estimate fuel consumption and CO2
emissionby the principle that more distance traveled of vehicles increases, fuel consumption and CO2 emission also increase. However, VKT or VMT cannot determine and well reflect driving pattern, which affect fuel consumption and CO2 emission directly.
As a result, estimation of fuel consumption reduction of hybrid cars or other environmentally friendly cars by using VKT or VMT is not sufficient for accurate estimation.
Thus, estimation of fuel consumption in this study is focused in micro scale in which much or less fuel consumption depends on the factors of weight and load of vehicles, fuel types, engine efficiency, age of engine, as well as driving patterns [18]. For driving patterns in each vehicle, much or less fuel consumption depends on speed,
11
acceleration, and amount of stops affecting revolution per minute (rpm) of engine. If rpm of the engine increases, fuel consumption as well as GHG emission increases.
2.2 Previous Study on Estimation of Fuel Consumption Using Driving Modes According to driving pattern study for finding the impacts on fuel consumption or GHG emissions, engine dynamometer test from laboratory is original and the most simple method because it can well reflect driving activities such as different rolling situations or driving modes in on-road vehicle trips. Trips data can be defined as the standard test cycles that can provide a highly reliable baseline for comparative testing [19] such as New European Drive Cycles (Emission Test Cycles for the Certification of light duty in Europe) or US Federal Test Procedure-75 (Test Procedure for Highway and Non-road Engines). However, these standard drive cycles cannot well reflect how good representations of vehicles under real driving situations are [20, 21]. For involving this problem, real-world fuel consumption and GHG emissions are more suitable for making estimations them instead of using a dynamometer.
Probe data are one of the real-world data, as they can provide location, speed, direction, and time stamp on whole road sections in the urban area, and can reflect driving patterns that locally fluctuate depending on traffic conditions. Thus, probe data are more sufficient and appropriate for estimation of fuel consumption. In addition, they are an alternative source of high quality data and have importance in development of Intelligent Transportation Systems (ITS). They use the principle of floating car data (FCD) to collect real-time traffic data by locating the vehicle via mobile phones or GPS over the entire road network. They are performed as the sample of fixed locations by means of electronic transponders (tags) that are read as the vehicles pass the sensors [22].
Benefits of probe data are not only for being a raw data to determine congestion measures, safety measures, traffic control management, and logistics, but they are also for indicating driving patterns based on their speed and time stamped data. Moreover, probe data can be used as an alternative method for estimation of fuel consumption depended on driving patterns or modes.
The previous research regarding estimation of fuel consumption using driving modes as follows;
Initial models for estimation of fuel consumption
The initial step for estimation of fuel consumption in road transport sector is
12
direct measuring by test vehicles. For the most obvious examples, Rakha and Ding [23]
and Rakha et al. [24, 25] applied micro scale models, Virginia Tech (VT), to predict fuel consumption and GHG emission rates based on instantaneous speed and acceleration reflecting driving pattern in each vehicle and fuel type.
Rakha and Ding [23] proposed VT-MESO model framework for modal model for fuel consumption and GHG emission rate estimation. This model was based on 3 parameters including average speed, number of stops per distance, and average stop duration for synthetic driving cycle construction for each road section. Then, the model was validated against VT-Micro that is the original models.
Rakha et al. [24] applied a framework for developing and expanding VT-Micro for estimating hot stabilized fuel consumption and GHG emission for 60 light duty vehicle types and also trucks, not only 9 vehicle types as the original models.
Rakha et al. [25] studied the impacts of stops based on VT models determined fuel consumption and GHG emission rate varied by acceleration curves. Vehicle stops could be identified by deceleration and acceleration, before and after stopping at an intersection.
Apart from VT-Models, Smit et al. [26] applied average speed received in each road section to develop speed distributions in order to predict GHG emissions instead of using single mean speed in each section. Since speed distributions could help to predict more details speed data of each vehicle, estimation of GHG emission could be more accurate.
These studies could determine fuel consumptions and GHG emission rates varied by speed in different acceleration curves that could develop for finding emission factors. Also, they tried to conduct more traffic data and some modal models to obtain more reliable estimation. However, these studies considered only test vehicles in the field for measuring fuel consumption and GHG emission without sufficient data reflecting driving patterns of all roadways in the urban area.
Using probe information for estimation of fuel consumption and GHG emission
Song et al. [18] proposed the emission models by the relationship between emission factors and delay/number of stops at intersections on arterials. Probe data were collected by test buses for reporting driving patterns collected from speed, acceleration,
13
delay, and number of stops. Then, vehicle specific power (VSP) was applied in this study in order to collect fuel consumption/GHG emission rates obtained from probe into the bin in each 1 KW/ton. Consumption/emission rates together with delay and number of stops could be used to estimate emission factor based on probe data from buses.
Ropkins et al. [19] estimated the impacts of fuel consumption and GHG emissions of 5% biodiesel (B5) blend compared with original diesels. Probe data, which can separate speed and acceleration in each traffic condition, was used for reporting traffic conditions and positions in only test vehicles in order to compare with fuel consumption and GHG emission results for studying the relationship between of them.
Meanwhile, fuel consumption and GHG emissions could be calculated via exhaust pipe.
Comparisons consisted of emission results varied by distance, and the relationships between fuel consumption/GHG emissions and speed/acceleration, as shown by map charts, both in ordinary case and introducing 5% biodiesel (B5) blend case.
Chang et al. [13] and Li et al. [14] applied International vehicle emission (IVE) to estimate real-time traffic CO2 emission in Beijing, China. Probe data were used for collecting speed, acceleration, grade, and driving modes for separating into the bins/ranges and considering each separate case into the models, which also applied VSP study and engine stress (ES) principle into IVE that could make more details of driving patterns for estimation.
Zhang et al. [27] estimated vehicle emissions in work zones and rush hour congestion compared to emission under free flow traffic conditions along freeway segment. The comprehensive modal emission model (CHEM) was used to generate fuel consumption and GHG emission. Probe data could provide speed, acceleration, and positions every 1 second. Fuel consumption and GHG emission were predicted for different driving modes consisting of stopping, cruising, accelerating, and decelerating.
Zeng et al. [28] estimated fuel consumption in a large-scale data set, which were collected from probe and mobile fuel measurement of bus travelling. This research proposed the support vector machine (SVM) in order to study the relationship between fuel consumption and the corresponding factors including average speed, distance traveled, coverage of link speed, and engine displacement.
Choudhary and Gokhale [29] studied the impacts of different traffic conditions on GHG emission rates of personal cars and rickshaws. Traffic conditions could be identified from probe data of these vehicles. This study also found the relationship between speed/acceleration and emission rates. The results found that frequent
14
stop-and-go occurring during interruptions and congestion are the main causes of higher emissions because stop-and-go lead to sharp increase or decrease in acceleration and deceleration. However, this study focused only arterials roadways and conducted many probe cars only reporting traffic condition.
Barth and Boriboonsomsin [30] found the impacts of fuel consumption and CO2
emission by using real-world data, like probe data, which were collected by 626 vehicles in southern California, USA. Meanwhile, fuel consumption and CO2 emission were measured by test vehicles. The results indicated that traffic congestion, as indicated by low average speed and non-smooth traffic flow by stopping and moving behavior of vehicles, increase fuel consumption and CO2 emission.
From literature, real-world data, like probe data, could well reflect driving patterns/modes and explain the relationship with fuel consumption and CO2 emission.
However, probe data were used as test vehicles, which could not sufficiently cover all vehicles on whole road sections in the urban area, and were used for identifying only driving pattern/modes [13, 14, 18], and traffic conditions [19, 27, 28, 29]. Although, Barth and Boriboonsomsin [30] conducted probe data from 626 vehicles, they still could not cover all vehicles on whole roadways in the urban area and fuel consumption and CO2 emission have not yet estimated directly from probe cars.
2.3 Impacts of Promoting Hybrid Cars 2.3.1 Hybrid cars
Auto industry has tried to develop a new generation of fuel saving and environmentally friendly vehicles. “Hybrid Vehicle (HV)” is one such vehicle and it has been brought to the auto market in Thailand. HV is a new private car technology with the best efficiency among vehicles running during highly traffic congestion. The advantage of HV is significant fuel consumption and GHG emissions reduction compared with conventional combustion engine vehicles in similar weight class. In addition, it is already widely used in many countries such as the USA, European Countries, and Japan, especially in urban areas [31].
The concept of HV is to use the energy transformation system rather than energy storage system. The most common option is the combination of an internal combustion engine and an electric power source (battery pack and electric machine), as shown in Figure 2.1. Using the electrical energy, which supplement the power of the internal combustion engine, can improve the efficiency of the fuel use of HV.
15 Source: (How Stuff Work, 2016) [31]
Figure 2.1 The mechanism of hybrid car
There are three benefits of HV in order to improve the efficiency of the fuel use as follows:
(1) The conventional combustion engine can be turned off to save fuel consumption when vehicle stops or starts moving by using electric motor, which has more efficiency at low speeds.
(2) The kinetic energy parts, which normally lose by heat, can be captured by electric motor and kept back into the battery during deceleration.
(3) When less power is needed, the excessive energy which generally loses will be kept in batteries. In contrast, when more power is needed, the supplementary power from batteries will be supplied to the electric motor to power the vehicle. Therefore, hybrid system can increase efficiency and reduce emissions.
HV has benefit from the efficiency improvements both in gasoline and diesel vehicles. Currently, HV technology could reduce fuel consumption about 45% compared with the conventional combustion engine in similar vehicle type [32]. This study selects HV in private car sector which consume gasoline for the conventional combustion engine to investigate how much drivers can save fuel during hybrid system operated.
On the current market, three major types of hybrid systems being used in the HV consist of series, parallel, and series/parallel system or full hybrid system. In fact, most
16
HV in the auto market have been developed based on the “series/parallel system” or “full hybrid system” [33]. This system leads the benefit of the series and the parallel hybrid system. In series/parallel hybrid system, the power split device and its control unit are the crucial components of this system. In Figure 2.2, the power split device transfers a part of the power produced by the gasoline engine to drive the wheel and also the generator, which is another part providing electric power for the electric motors or recharging the battery. This system can provide benefit of the energy-efficient electric motors by using the power of electric motor and gasoline engine, or the electric motor only, depending on the driving patterns.
Source: (Toyota Motor Operation, 2014) [34]
Figure 2.2 Series and parallel hybrid system
HV uses the electric energy kept in its battery to run the car by the electric motor at low speed driving. The gasoline engine is the main power source for wheels driving in cruising mode. Also, it provides the power to the generator in order to supply electricity to the electric motor when the battery charge level is low. During the full acceleration or climbing a steep slope, the dual power both direct gasoline and electric motor is operated.
When the accelerator is lifted, hybrid system operates the kinetic energy by letting gasoline power to the wheels system turn to the electric power only.
Apart from HV, the newer vehicle technology called Plug-in hybrid electric vehicles (PHEVs) has been promoted recently. PHEV combines the vehicle efficiency benefits of hybridization with the opportunity to travel part-time on electricity provided
17
by the external charger, rather than the vehicle’s internal recharging system by HV [35].
Therefore, PHEV is more potential for the reduction of fossil fuel use and CO2 emissions.
2.3.2 Previous study on impact of promoting hybrid cars
Pitanuwat and Sripakagorn [36] investigated fuel economy benefit by using hybrid cars under field driving test in Bangkok. This study analyzed the results by separating traffic conditions consisting of arterials in inner area, arterials in outer area, and highways in outer area. Moreover, this study separated the behavior of drivers into aggressive and normal calm that have different acceleration. Average speed, divided into 9 ranges, was employed to quantify as parameters for finding the impacts of fuel consumption. The results indicated that both conventional gasoline and hybrid cars had the greatest fuel consumed on arterials in inner area, and hybrid cars also achieved the greatest fuel consumption reduction in the same conditions. Meanwhile, highways had the fewest reductions. Aggressive driving was the cause of 100% increase for conventional cars and 200% increase for hybrid cars. In addition, normal-calm driving could reduce fuel consumption rather than aggressive driving. For driving patterns/modes, hybrid cars seem to be more sensitive to aggressive driving, as shown by more fuel consumption percentages compared with conventional cars.
Raykin et al. [37] evaluated the impacts on fuel consumption of plug-in hybrid cars in evening-peak on different road categories including arterials and highways. In addition, this study also analyzed energy use in each of electricity and fossil fuel. They simulated traffic assignment to demonstrate traffic situations by average speed and stopping percentage. Then, movement data of hybrid cars on each road category were put into simulation and fuel consumption was calculated when test vehicles ran along selected roadways. The results indicated that fuel consumption of hybrid cars was lower in all road categories that the lowest was on the arterials. Moreover, hybrid car, which is series system installation, was the best fuel saving.
Wang et al. [38] studied the energy reduction together with hybrid electric cars (HVs), plug-in hybrid cars (PHEVs), and battery electric cars (BEVs), compared with conventional cars (CVs) in Beijing, China. They also collected traffic data based on 1,000 probe cars to demonstrate driving cycles in each sub-area in peak and off-peak hours for finding the impacts. The results indicated that all vehicle types in downtown area in peak hours consumed the most fossil fuel. All vehicles in Beijing yield more fuel reduction benefits than in US, and the most fuel reduction was PHEVs.
Nisamani et al. [39] studied the impacts of incorporating hybrid cars into high
18
occupancy lanes (HOV) by introducing scenarios which were different share of demand of hybrid cars. The results indicated that allowing hybrid cars into HOV lanes could reduce vehicle emission. However, if demand of hybrid cars was higher, traffic indicators were in case of congestion such as worse level of service, lower average speed. The maximum number of hybrid cars, using HOV could absorb significant relegation, was about 50,000.
From literature, promotion of hybrid cars achieved the greatest fuel consumption reduction on arterials in the inner area, especially in peak hours. However, these defined studies conducted only test hybrid cars to calculate the impacts on fuel consumption [36, 37], and did not consider minor roads [36, 37, 38, 39], in which metropolitans as above consist of significant amount of minor roads in their road network. In addition, probe data in these defined studies were only used to explain traffic conditions in term of average speed/acceleration [36, 37] and driving cycles [38] without considering fuel consumption and GHG emission estimation based on this data directly.
Therefore, it implies that further studies on calculating the fraction of duration of each driving mode, which was defined as “Time Sharing of Driving Modes” from probe data in various conditions, are necessary for estimating fuel consumption in order to study the impacts of promoting hybrid cars in Bangkok Metropolitan and Region (BMR).
2.4 Crawling Behavior of Vehicles
Crawling is a behavior of vehicles in traffic stream, which is the transition driving state between stopping/idling and full moving of vehicle. Since, Bangkok has been known as one of the worst cities in the world for traffic congestion, crawling behavior of vehicles is very common, especially during peak hours on weekdays.
Therefore, the impacts of vehicle crawling during traffic congestion are the main cause of more fuel consumption and more CO2 emission in transport sector, because by previous studies, traffic congestion, as indicated by low average speed and non-smooth traffic flow, increase fuel consumption and CO2 emission [39, 40, 41] without considering crawling behavior of vehicles.
There were some studies similar to this behavior of vehicles, called stop-and-go.
They indicated that frequent stop-and-go occurring during interruptions and congestion are the main causes of higher emissions on urban roads since stop-and-go lead to sharp increase or decrease in acceleration and deceleration [29, 30]. However, probe information cannot provide more details of speed data because vehicles in stop-and-go situation will stop and move immediately. Thus, crawling of vehicles can explain traffic
19
congestion and can define as another driving mode better than using stop-and-go because it can explain traffic congestion although speed data obtained from probe information cannot provide more details.
There was some literature studying vehicles crawling for estimating stopped delay in traffic system, especially at signalized intersections. Although, considering zero speed is the threshold for stopping vehicle, a higher speed should be also applied to allow for the identification of vehicles crawling before stopping at a queue. For example, Mousa [40] utilized 1 - 1.5 m/s (3.6 – 5.4 km/h), and Colyar and Rouphail [41] indicated 4.8 km/h as the criteria for measuring stopped delay.
However, no previous studies considered about this behavior for more reliable estimation of fuel consumption, and crawling behavior of vehicles in different study sites and traffic conditions is probably different. These studies did not focus on congestion periods and different conditions (such as sub-area, days of week, or road category), and have not yet been analyzed to study the impacts on estimation of fuel consumption.
Consequently, the author is interested in this behavior and desire to add in as another driving mode for estimation of fuel consumption because it can define traffic congestion more accurately, is the cause of more fuel consumption, and is possible to reduce fuel consumption if hybrid cars replace conventional gasoline cars. In addition, crawling of vehicles is used to examine whether it corresponds to traffic congestion, especially during traffic congestion.
2.5 Concluding Remarks
Previous studies about estimation of fuel consumption in road transport sector considered only test vehicles in the fields without sufficient data reflecting driving patterns of all roadways in urban area; whereas, probe data, installed in many vehicles, can operate all roadways. There were using vehicle kilometer traveled (VKT) to estimate fuel consumption; however, VKT cannot determine and cannot well reflect driving pattern, which affect fuel consumption directly. Thus, this research applies the original equation for estimation of fuel consumption. Proposed equations in term of distance (VKT) are modified to the new term that collect of average speed, amount of detected probe cars, and time sharing of driving modes collected from probe data to better reflect driving patterns.
According to crawling behavior of vehicles, there were some studies similar to this behavior of vehicles, called stop-and-go. They indicated that frequent stop-and-go,
20
occurring during interruptions and congestion of traffic, are the main causes of higher emissions on urban roads since stop-and-go lead to sharp increase or decrease in acceleration and deceleration. However, probe data cannot provide more details of speed data because vehicles in stop-and-go situation will stop and move immediately. Thus, crawling of vehicles can explain traffic congestion and can define as another driving mode better than using stop-and-go because, it can explain traffic congestion although speed data obtained from probe data cannot provide more details. In addition, no previous studies defined about crawling behavior for estimation of fuel consumption if hybrid cars or other environmentally friendly cars replace conventional gasoline cars. Consequently, this behavior of vehicles is added in as another driving mode in this study.
21
REFERENCES
1. Atabani AE, Badruddin I A, Mekhilef S, Silitonga SA. (2011). A review on global fuel economy standards, labels and technologies in the transportation sector.
Renewable and Sustainable Energy Reviews, vol.15, pp.4586–4610.
2. Uchiyama Y. (2002). Present efforts of saving energy and future energydemand/supply in Japan. Energy Conversion and Management, vol.43, pp.1123–31.
3. Wagner DV, An F, Wang C. (2009). Structure and impacts of fuel economy standards for passenger cars in China. Energy Policy, vol.37, pp.3803–3811.
4. Cheah L, Heywood J., (2011), Meeting U.S. passenger vehicle fuel economy standards in 2016 and beyond, Energy Policy, vol.39, pp.454–466.
5. Department of Alternative Energy Development of Efficiency (2009). Oil Used in Thailand (1997-2008), Ministry of Energy.
6. Stern, N. (2006). The Economics of Climate Change, Amer.Econ.Rev., vol.98, no.2, pp.1–37.
7. Dalkmann, H. and Brannigan, C. (2007). Transport and Climate Change, German Technical Cooperation (GTZ), Eschborn.
8. Thailand National Reform Steering Assembly (2015). The New Innovation of Electric Vehicles for Environment, Available online:
http://www.parliament.go.th/ewtadmin/ewt/parliament_parcy/ewt_dl_link.php?nid=3 1546 (Accessed August 4, 2016) (in Thai).
9. Inter-government Panel on Climate Change (2006). 2006 IPCC Guidelines for National Greenhouse Gas Inventories, Available online:
http://www.ipcc-nggip.iges.or.jp/public/2006gl/ (Accessed July 7, 2016).
10. Fulton, L. et al. (2009) IEA Mobility Model (MoMo) and its use in the ETP 2008, Energy Policy, vol.37, pp.3758-3768.