Fukushima Medical University
福島県立医科大学 学術機関リポジトリ
This document is downloaded at: 2021-11-07T23:40:28Z
Title Effects of a high-sodium diet on renal tubule Ca2+ transporter and claudin expression in Wistar-Kyoto rats
Author(s) Yatabe, Midori Sasaki; Yatabe, Junichi; Takano, Kozue;
Murakami, Yuta; Sakuta, Rina; Abe, Sadahiko; Sanada, Hironobu; Kimura, Junko; Watanabe, Tsuyoshi
Citation BMC nephrology. 13: 160
Issue Date 2012-12-02
URL http://ir.fmu.ac.jp/dspace/handle/123456789/354
Rights
© 2012 Yatabe et al.; licensee BioMed Central Ltd. This is an Open Access article distributed under the terms of the Creative Commons Attribution License
(http://creativecommons.org/licenses/by/2.0), which permits unrestricted use, distribution, and reproduction in any medium, provided the original work is properly cited.
DOI 10.1186/1471-2369-13-160
Text Version publisher
R E S E A R C H A R T I C L E Open Access
Effects of a high-sodium diet on renal tubule Ca 2+
transporter and claudin expression in Wistar-Kyoto rats
Midori Sasaki Yatabe
1,2*, Junichi Yatabe
1,2, Kozue Takano
1, Yuta Murakami
1, Rina Sakuta
1, Sadahiko Abe
1, Hironobu Sanada
3, Junko Kimura
1and Tsuyoshi Watanabe
2Abstract
Background: Urinary Ca
2+excretion increases with dietary NaCl. NaCl-induced calciuria may be associated with hypertension, urinary stone formation and osteoporosis, but its mechanism and long-term effects are not fully understood. This study examined alterations in the expressions of renal Ca
2+transporters, channels and claudins upon salt loading to better understand the mechanism of salt-induced urinary Ca
2+loss.
Methods: Eight-week old Wistar-Kyoto rats were fed either 0.3% or 8% NaCl diet for 8 weeks. Renal cortical expressions of Na
+/Ca
2+exchanger 1 (NCX1), Ca
2+pump (PCMA1b), Ca
2+channel (TRPV5), calbindin-D
28k,and claudins (CLDN-2, -7, -8, -16 and − 19) were analyzed by quantitative PCR, western blot and/or
immunohistochemistry.
Results: Fractional excretion of Ca
2+increased 6.0 fold with high-salt diet. Renal cortical claudin-2 protein decreased by approximately 20% with decreased immunological staining on tissue sections. Claudin-16 and − 19 expressions were not altered. Renal cortical TRPV5, calbindin-D
28kand NCX1 expressions increased 1.6, 1.5 and 1.2 fold, respectively.
Conclusions: Chronic high-salt diet decreased claudin-2 protein and increased renal TRPV5, calbindin-D
28k, and NCX1. Salt loading is known to reduce the proximal tubular reabsorption of both Na
+and Ca
2+. The reduction in claudin-2 protein expression may be partly responsible for the reduced Ca
2+reabsorption in this segment. The concerted upregulation of more distal Ca
2+-transporting molecules may be a physiological response to curtail the loss of Ca
2+, although the magnitude of compensation does not seem adequate to bring the urinary Ca
2+excretion down to that of the normal-diet group.
Keywords: Calcium, Sodium chloride, Distal tubule, Na
+/Ca
2+exchanger, Ca
2+channel, Claudins
Background
Urinary Ca
2+excretion increases with sodium chloride (NaCl) ingestion [1]. This dietary NaCl-induced cal- ciuria may lead to osteoporosis at low calcium intake [2,3] and also is associated with urinary stone forma- tion [1] and hypertension [4]. The increase in urinary Ca
2+excretion is postulated to be due to salt-induced
volume expansion [5] and/or competition between sodium and calcium ions in the renal tubule [6]. How- ever, the precise mechanism for the dietary NaCl- induced urinary Ca
2+increase is not fully understood.
In addition, it is not clear if long-term salt loading has any effects on Ca
2+-transporting molecule expressions in the kidney.
The bulk of Ca
2+in the pro-urine is reabsorbed in the proximal tubule and the thick ascending loop of Henle through a passive, paracellular movement. Transepithe- lial Ca
2+permeability is high in these segments, and the rate-limiting barrier is the tight junction. Claudins and other tight junction proteins are known to be important
* Correspondence:[email protected]
1Department of Pharmacology, Fukushima Medical University School of Medicine, 1 Hikarigaoka, Fukushima 960-1295, Japan
2Department of Nephrology, Hypertension, Diabetology, Endocrinology and Metabolism, Fukushima Medical University School of Medicine, Fukushima, Japan
Full list of author information is available at the end of the article
© 2012 Yatabe et al.; licensee BioMed Central Ltd. This is an Open Access article distributed under the terms of the Creative Commons Attribution License (http://creativecommons.org/licenses/by/2.0), which permits unrestricted use, distribution, and reproduction in any medium, provided the original work is properly cited.
in determining the permeability characteristics of vari- ous epithelia [7]. For example, renal expression of clau- din 2 is restricted to the proximal nephron [8], and claudin 2 is believed to form high-conductance cation pores [9]. The distributions and functions of these tight junction proteins are becoming known, but information on their regulation, especially in the kidney, is just emerging.
In contrast, regulated transcellular Ca
2+reabsorption occurs primarily in the distal tubule. In the distal neph- ron, Ca
2+in the pro-urine enters the cytosol of tubule cells through Ca
2+channel, mainly TRPV5 [10]. The transport of intracellular Ca
2+to the basolateral side is facilitated by a Ca
2+-binding protein called calbindin- D
28k[10,11], and Ca
2+exits the cell on the basolateral side through Na
+/Ca
2+exchanger 1 (NCX1) and Ca
2+pump (PMCA1b) [12,13]. NCX1 counter-transports 3 Na
+for Ca
2+, but the role of NCX1 in NaCl-induced cal- ciuria has not been studied.
Alterations in the expressions of tight junction pro- teins and transcellular Ca
2+transporters may in part ex- plain the urinary calcium loss upon salt loading or provide clues on long-term effects of dietary NaCl inges- tion. Therefore, we examined the expression changes of renal Ca
2+transport molecules in rat with chronic high- NaCl diet.
Methods
Animal experiment
All experimental procedures were approved by the Fukushima Medical University School of Medicine Ani- mal Committee. Eight-week old Wistar-Kyoto rats (Japan SLC Inc. Sendai, Japan) were fed either 0.3% or 8% NaCl chow (Oriental Yeast Co., Tokyo, Japan) for 8 weeks with tap water ad libitum. Unanesthetized sys- tolic blood pressure was measured by the tail-cuff method (Blood Pressure Analyzer model BP-98A;
Softron, Tokyo, Japan). Ten measurements were taken and averaged per rat per day. Urine was collected regu- larly using metabolic cages. At the end of the study, under intraperitoneal pentobarbital anesthesia, blood was drawn from abdominal aorta, and kidneys were col- lected for assays.
Biochemical analysis
Biochemical analyses were performed by SRL Inc.
(Tokyo, Japan) using creatinase-sarcosine-oxidase-POD method for creatinine, electrode method for Na, K and Cl, arsenazo III method for Ca, direct molybdate assay for inorganic phosphate (P) and xylidyl blue method for Mg. Serum concentrations of 1,25-dihydroxyvitamin D
3were measured by radioimmunoassay using the two anti- body method.
Quantitative Real-Time RT-PCR
Total RNA was prepared from renal cortex using RNeasy plus mini kit (Qiagen). Subsequently, 0.25 μg of total RNA was reverse-transcribed into cDNA using iScript cDNA Synthesis Kit (Bio Rad) in a 20 μl reaction volume. One μl of reverse-transcription sample was used for real-time quantitative PCR using the iQ5 Real-Time PCR Detection System and iQ SYBR Green Supermix (Bio Rad). The primers used were as follows: NCX1 forward CAGTT GTGTTTGTCGCTCTTGG and reverse GTTGGCCG CATGGTAGATGG, with annealing temperature (Ta) 57°C; GAPDH forward GCAAGTTCAACGGCACAGT CAAG and reverse ACATACTCAGCACCAGCATC ACC with Ta 56°C, TRPV5 forward CTTACGGGTT GAACACCACCA and reverse TTGCAGAACCACAG AGCCTCTA with Ta 56°C; PMCA1b forward CGCCAT CTTCTGCACAATT and reverse CAGCCATTGTTC TATTGAAAGTTC with Ta 56°C, calbindin-D
28kfor- ward GGAGCTGCAGAACTTGATCCand reverse GC AGCAGGAAATTCTCTTCG with Ta 57°C, claudin 2 forward TCTGGATGGAGTGTGCGAC and reverse AGT GGCAAGAGGCTGGGC with Ta 63°C, claudin 7 forward GACTCGGTGCTTGCCCTGCC and reverse GGAGCG GGGTGCACGGTATG with Ta 59°C, claudin 8 forward GTGCTGCGTCCGTCCTGTCC and reverse CCAAGCT CGCGCTTTTGGGC with Ta 59°C. NCX1 and GAPDH primers were designed using Beacon Designer soft- ware (PREMIER Biosoft International, Palo Alto, Cali- fornia, USA), claudin 7 and 8 primers were designed using PrimerBlast (NCBI), and TRPV5, PMCA1b and claudin 2, 16 and 19 primers were adopted from else- where [14-16]. PCR reactions were performed in tripli- cate, and mRNA was quantified based on the Ct value, normalized to GAPDH, and expressed as relative amounts.
Immunoblotting
Immunoblotting of renal cortical proteins was per- formed similarly as previously reported [17]. The anti- bodies used were monoclonal anti-rat NCX1 antibody (Abcam), polyclonal anti-claudin 2 antibody (Life Tech- nologies, Carlsbad, CA), and polyclonal anti-TRPV5, anti-NHE3, and anti-GAPDH antibodies (Santa Cruz Biotechnology). The bands were visualized by ECL or ECL plus reagents (Amersham) and quantified by densi- tometry using ImageJ software.
Immunohistochemistry
Sections of rat kidney paraffin blocks were made with 2-μm thickness. Kidney sections of normal- and high-salt diet fed rats were placed on a single slide glass for comparison.
After deparaffinization and blocking, the slices were treated with anti-claudin 2 antibody (Life Technologies, Carlsbad, CA), anti-rabbit secondary antibody and DAB
Yatabeet al. BMC Nephrology2012,13:160 Page 2 of 9
http://www.biomedcentral.com/1471-2369/13/160
using VECTASTAIN-ABC kit (Vector laboratories, Burlingame, CA). The slides were counterstained with haematoxylin and eosin.
Data analysis
All values are expressed as means ± SE. Statistical com- parisons were performed by Student's t-test or ANOVA where appropriate. P values <0.05 were considered sta- tistically significant.
Results
Serum electrolytes were similar between the normal- and high-salt fed rats
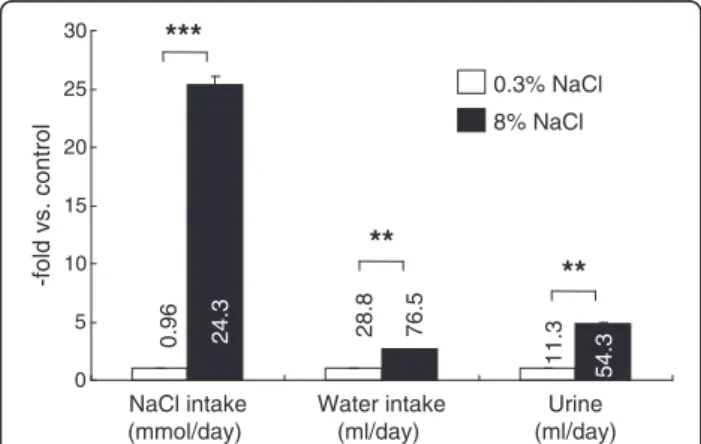
Food intake was similar between the groups (normal-salt vs high-salt groups, 18.8±0.9 vs 17.8±0.5 g/day, n.s., n=15 /group), although the high-salt group weighed slightly less than the normal-salt group at the end of the study (369±5 vs 354±4 g, P <0.05). This may partly be due to the reduced caloric intake of the high-salt fed rats because 8% (by weight) of the chow was sodium chlor- ide. As expected, the high-salt group drank and urinated significantly more than the normal-salt group, 2.7 times and 4.8 times the control rats, respectively (Figure 1).
However, the serum electrolyte concentrations measured did not differ between the normal-salt and high-salt groups (Table 1). Creatinine clearance, which is used as an approximate of glomerular filtration rate, was also not significantly different between the groups (2.51±0.12 vs 2.63±0.14 ml/min, n=12-15 /group). Systolic blood pressures also did not differ significantly between the groups (133±2.8 vs 141±3.0 mmHg, n=15/group).
Urinary calcium excretion was markedly increased in the high-salt rats
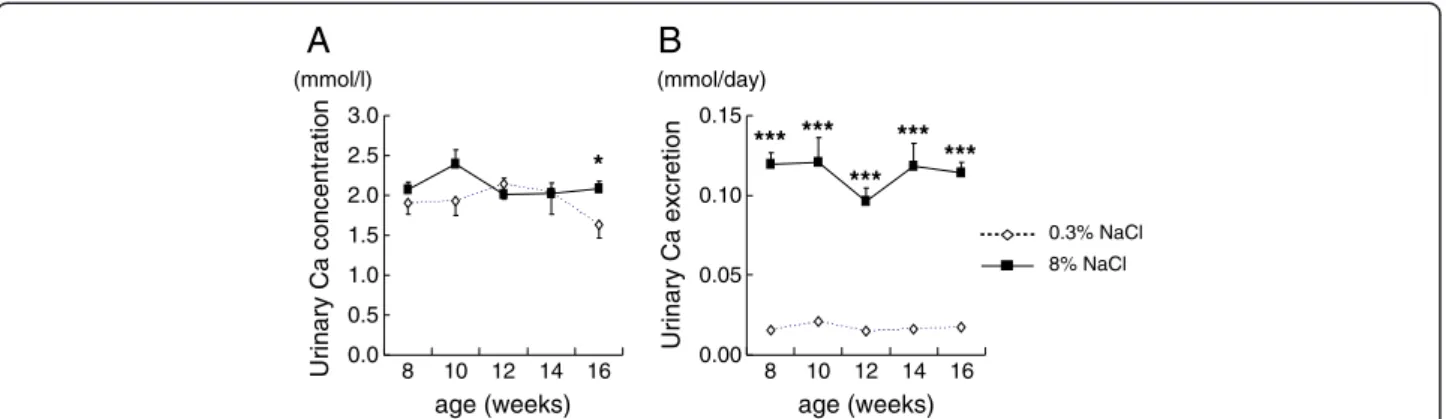
At the end of the study, urinary calcium concentration (Figure 2A) and daily urinary calcium excretion (Figure 2B) of rats on high-salt diet were higher than those of the normal-salt group, and fractional Ca excretion of the salt-loaded rats was 6 times that of the control rats (Figure 3). Fractional Mg excretion also increased with salt loading, although the increase was smaller than that of the fractional Ca excretion (Figure 3).
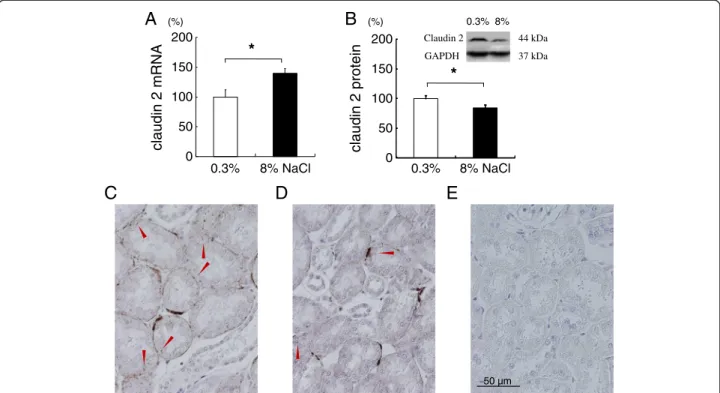
Renal claudin-2 protein decreased, but claudin-7, -8, -16 or -19 mRNA was not altered with chronic salt loading Claudin-2 forms paracellular cation pore in the proximal tubule. Rats fed 8% NaCl for 8 weeks showed increased renal cortical claudin-2 mRNA (Figure 4A), but salt loading significantly decreased the protein expression of claudin-2 by about 20% (Figure 4B). There may be post- transcriptional regulation of claudin-2. Immunohisto- chemical staining of kidney cortex was performed for claudin-2 to further examine the change in expression.
Although by subjective observation, the staining of renal cortical claudin-2 also suggested a decrease by salt load- ing (Figure 4C and 4D). In the proximal tubule, NHE3 expressed primarily in the apical membrane is shown to be necessary for calcium reabsorption by providing the driving force for paracellular calcium transport [18]. Un- expectedly, this study found that renal cortical NHE3 protein level of salt-loaded rats was significantly increased compared to that of rats on normal diet (100
±20 vs 292±38%, n=9-11, P<0.01, figure not shown).
Claudin-16 and −19 are expressed primarily in the thick ascending limb [19], and mutations of claudin-16 [20] and
−19 [21] result in renal Mg
2+and Ca
2+wasting. In this study, no significant change in renal claudin-16 or −19 was observed by salt loading (Figure 5A and 5B).
Claudin-7 and −8 are found from distal convoluted tu- bule to the inner medullary collecting duct [22].
Claudin-8 is believed to act as a paracellular cation bar- rier [23], inhibiting the backflow of Ca
2+that has been
0 5 10 15 20 25 30
NaCl intake (mmol/day)
Water intake (ml/day)
Urine (ml/day)
-fold vs. control
0.3% NaCl 8% NaCl
**
***
0.96 24.3 11.3 54.3
28.8 76.5
**
Figure 1Intake and output data at the end of the study in Wistar-Kyoto rats fed 0.3% or 8% NaCl diet for 8 weeks.The bars are shown as relative amounts of the 8% NaCl group to those of 0.3% NaCl control group. Numbers by the bars are the averages of actual measurements, with the units indicated below the item labels. *P<0.05, **P<0.01, and ***P<0.001 vs. 0.3% NaCl group of same age, n=15.
Table 1 Blood pressure and biochemistry data at the end of the study
0.3% NaCl 8% NaCl Systolic Blood Pressure (mmHg) 133 ± 2.8 141 ± 3 n.s.
Serum creatinine (mg/dL) 0.29 ± 0.01 0.33 ± 0.02 n.s.
Serum Na (mmol/L) 143 ± 0.5 142 ± 0.3 n.s.
Serum K (mmol/L) 4.33 ± 0.07 4.36 ± 0.11 n.s.
Serum Cl (mmol/L) 104 ± 0.69 103 ± 0.64 n.s.
Serum Ca (mmol/L) 9.26 ± 0.07 9.22 ± 0.09 n.s.
Serum Mg (mmol/L) 2.29 ± 0.03 2.23 ± 0.04 n.s.
Serum P (mmol/L) 7.05 ± 0.17 7.06 ± 0.23 n.s.
Abbreviations:n.s.: not significant.
reabsorbed through transcellular mechanisms. Claudin-7 is generally assumed to be an anion barrier. No signifi- cant change was observed in the mRNA expression of claudin-7 or claudin-8 (Figure 5C and 5D).
High-salt diet increased distal, transcellular Ca
2+trans- porting molecules, TRPV5, calbindin-D
28, and NCX1.
TRPV5 Ca
2+expression in the renal cortex increased with high-salt diet both in terms of mRNA (Figure 6A) and protein levels (Figure 6B). TRPV5 is the apical Ca
2+entry mechanism and the gatekeeper of the distal tubular Ca
2+transport [24]. In addition, the renal cortical mRNA of calbindin-D
28k, an intracel- lular Ca
2+transport molecule [11], also increased by about 48% (Figure 6C). NCX1 and PMCA1b are the basolateral Ca
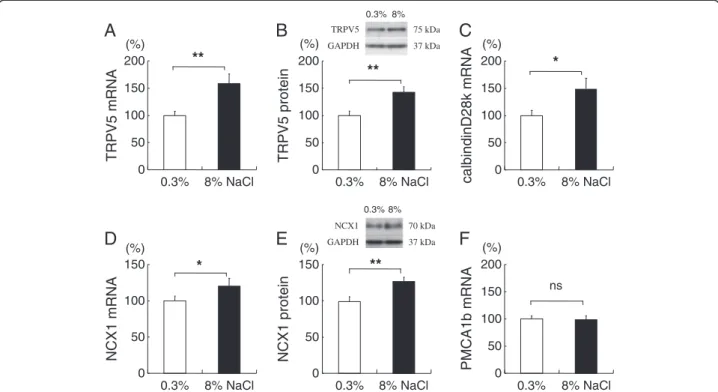
2+extrusion mechanisms in this segment [25]. Renal cortical NCX1 mRNA and protein levels increased in the high-salt group by about 20% and 26%, respectively (Figure 6D and E). In contrast, renal cortical expression of PMCA1b was not altered by high-salt diet (Figure 6F).
Modeling of NCX1 function
The functions of NCX1 with different electrolyte settings were modeled to interpret the effects of high-salt diet be- cause the transport of NCX1 is bidirectional. Even under normal conditions, estimates of NCX1 contribution to distal tubular, basolateral Ca
2+transport vary from 15%
[26] to 70% [27]. Figure 7 shows the relationship among intracellular Na
+concentration ([Na
+]
i), intracellular Ca
2+concentration [Ca
2+]
i, and equilibrium potential for NCX (E
NCX), calculated using the equation, E
NCX= 3 E
Na- 2 E
Ca[28], where E
Naand E
Caare respective equilibrium potentials for Na
+and Ca
2+given by the Nernst equation.
Basolateral extracellular Na
+concentration is set at 140 mM and basolateral extracellular Ca
2+concentration at 1 mM. In the literature, the basolateral membrane po- tential of the distal convoluted tubule and connecting tu- bule cells is reported to be −70 mV [29], while [Na
+]
iin those cells is reported to be 17.5 mM [26,30]. Under these conditions, the model in Figure 7 gives [Ca
2+]
iof 142 nM (shown as a dotted circle). This [Ca
2+]
iis below the esti- mated [Ca
2+]
iof 200 nM [29], indicating that NCX1 likely extrudes Ca
2+under normal conditions. However, the effects of high-salt diet on Na
+and Ca
2+gradients and membrane potential have not been determined. As dietary NaCl reduces plasma aldosterone and increases endogen- ous Na
+/K
+pump inhibitors such as ouabain [31] and marinobufagenin [32,33], [Na
+]
iis likely to be elevated. If [Na
+]
irises to 22 mM at -70mV, the equilibrium [Ca
2+]
iwill be 282 nM (shown as a solid circle on Figure 7). Then, NCX1 extrudes less Ca
2+from the cell, or may even re- verse to Ca
2+entry mode on high-salt diet. As TRPV5 is inhibited by a rise in [Ca
2+]
I[34], the elevation of intracel- lular [Ca
2+]
ialong with [Na
+]
imay reduce the rate of Ca
2+entry via TRPV5.
Chronic salt loading decreased serum 1,25-dihydroxyvitamin D
3concentration
To investigate the mechanism of upregulation of TRPV5, calbindin-D
28kand NCX1 with salt loading,
0.0 0.5 1.0 1.5 2.0 2.5 3.0 (mmol/l)
0.00 0.05 0.10 0.15
8 10 12 14 16 (mmol/day)
0.3% NaCl 8% NaCl
A B
*** ***
***
*** ***
*
8 10 12 14 16
age (weeks) age (weeks)
Urinary Ca concentration Urinary Ca excretion
Figure 2Urinary calcium concentration (2A) and daily urinary calcium excretion (2B) of rats fed normal-salt or high-salt diet from 8 to 16 weeks of age.*P<0.05 and ***P<0.001 vs. 0.3% NaCl group of same age, n=5-15.
0 2 4 6 8 10 12 14 16 18 20
FENa FECl FEK FECa FEP FEMg 0.3% NaCl 8% NaCl
fold over control
***
***
***
*
* p<0.05
*** p<0.001
Figure 3Fractional excretion of electrolytes at the end of the study.The bars are shown as relative amounts of the 8% NaCl group to those of 0.3% NaCl control group. *P<0.05 and ***
P<0.001 vs. 0.3% NaCl group of same age, n=15.
Yatabeet al. BMC Nephrology2012,13:160 Page 4 of 9
http://www.biomedcentral.com/1471-2369/13/160
serum concentrations of 1,25-dihydroxyvitamin D
3[1,25 (OH)
2D] were measured. 1,25(OH)
2D is known to upre- gulate renal TRPV5, calbindin-D
28kand NCX1 [35].
However, rats fed 8% NaCl diet for 8 weeks showed sig- nificantly reduced serum concentration of 1,25(OH)
2D (176±19 vs 129±7 pg/ml, P <0.05, n=9-11), suggesting the presence of mechanisms other than 1,25(OH)
2D for the salt-induced upregulation of these molecules.
Discussion
This study, for the first time, examined the effects of long- term dietary sodium chloride on renal Ca
2+-transporting molecule and claudin expressions. Chronic salt loading decreased the protein expression of claudin 2, a compo- nent of proximal, paracellular Ca
2+transport pathway.
Concomitantly, dietary NaCl increased the expression of more distal, transcellular Ca
2+reabsorption machinery, TRPV5, calbindin-D
28kand NCX1.
Salt loading acutely increases urinary excretion of Ca
2+along with Na
+[3,6]. In this study, the fractional Ca
2+excretion of salt-loaded rats increased approximately 6.0 fold. Generally, the cause for this phenomenon is attrib- uted to an extracellular fluid volume expansion and/or to the reduced reabsorption of both Na
+and Ca
2+in the proximal tubule [36]. Although renal blood flow is reported to be unchanged or sometimes even reduced
050 100 150 200
A
claudin 2 mRNA
*
(%)
0.3% 8% NaCl
*
0 50 100 150 200
B
claudin 2 protein
(%)
0.3% 8% NaCl Claudin 2 GAPDH
0.3% 8%
44 kDa 37 kDa
C D E
50 µm
Figure 4Claudin-2 expressions in the kidney cortex of rats fed 0.3% or 8% NaCl for 8 weeks.Protein and mRNA were normalized against GAPDH expression and expressed as relative amounts. Salt loading for 8 weeks increased the expression of claudin-2 mRNA (4A), but significantly decreased its protein level (4B). *P<0.05 vs 0.3% NaCl group, n=14-16. Claudin 2 immunnohistochemistry in kidney from rat on normal-salt diet (4C), high-salt diet (4D), and no primary antibody control (4E). Arrowheads indicate claudin 2 staining. By subjective observation, normal-salt fed rat kidney (4C) shows more claudin 2 staining compared to salt-loaded rat kidney (4D).
0 50 100 150 200
claudin 7 mRNA
C D
0 50 100 150 200
claudin 8 mRNA
ns ns
(%) (%)
0.3% 8% NaCl 0.3% 8% NaCl
0 50 100 150 200
claudin 19 mRNA
A
(%)0.3% 8% NaCl ns
B
0 50 100 150 200
claudin 16 mRNA
(%)
0.3% 8% NaCl ns
Figure 5Claudin-16, -19, -7, and−8 expressions in the kidney cortex of rats fed 0.3% or 8% NaCl for 8 weeks.Target mRNA or protein levels were normalized against GAPDH and expressed as relative amounts. Salt loading for 8 weeks did not significantly alter claudin-16 (5A), -19 (5B), -7 (5C), or−8 (5D) mRNA. n=13-15 for5A and5B, and n=9-10 for5Cand5D.
when salt loading is chronic such as over 8 weeks [37], from this study, the contribution of volume expansion and/or hyperfiltration cannot be ruled out as creatinine clearance tended to increase in the salt-loaded rats, al- though not significant. As creatinine determination in
rodents can vary depending on the method used [38], the use of inulin clearance may be favorable. Pressure natriuresis is another possible factor of salt-induced cal- ciuria, as blood pressure of salt-loaded rats tended to in- crease, although the difference was not statistically
TRPV5 mRNA
0 50 100 150 200
PMCA1b mRNA
TRPV5 protein
0 50 100 150 200
0 50 100 150 200
0.3% 8% NaCl
0.3%
0.3%
ns
calbindinD28k mRNA
050 100 150 200
0.3%
TRPV5 GAPDH
0.3% 8%
0 50 100 150
0.3%
NCX1 mRNA
D
NCX1 protein
0 50 100 150
0.3%
NCX1 GAPDH
0.3% 8%
A B C
E F
** *
**
* **
(%) (%) (%)
(%) (%) (%)
8% NaCl 8% NaCl
8% NaCl 8% NaCl 8% NaCl
70 kDa 37 kDa 75 kDa 37 kDa
Figure 6Distal, transcellular calcium-transporting molecule expressions in the kidney cortex of rats fed 0.3% or 8% NaCl for 8 weeks.
Protein and mRNA of the target molecules were normalized against GAPDH expression and expressed as relative amounts. Salt loading increased the expression levels of TRPV5 (6A: mRNA,6B: protein), calbindin-D28k(6C), and NCX1 (6D: mRNA,6E: protein), but did not alter PMCA1b (6F) expression. *P<0.05 and **P<0.01, vs. 0.3% NaCl group, n=14-16.
10 12 14 16 18 20 22 24
0 50 100 150 200 250 300 350 400 450
[Ca
2+]
i(nM)
[Na
+]
i(mM)
E
NCX(mV) -80
-75 -70
-65
Ca
2+exit via NCX
Ca
2+entry via NCX
Figure 7Simulated ENCX, [Na+]iand [Ca2+]i, assuming [Na+]o= 140 mM and [Ca2+]o= 1 mM.Abbreviations; ENCX: equilibrium potential of NCX1, [Na+]i: intracellular Na+concentration, [Ca2+]i: intracellular Ca2+concentration, [Na+]o: extracellular (basolateral) Na+concentration and [Ca2+]o: extracellular (basolateral) Ca2+concentration. Dotted circle indicates the simulated physiological [Ca2+]i, with [Na+]iat 17.5 mM and ENCXat−70 mV.
Solid circle indicates the simulated [Ca2+]iwith salt loading, with [Na+]iassumed at 22 mM and ENCXat−70 mV.
Yatabeet al. BMC Nephrology2012,13:160 Page 6 of 9
http://www.biomedcentral.com/1471-2369/13/160
significant. Renal artery servo-control experiments would be useful to delineate these in the future.
Approximately 65% of calcium in the pro-urine is reabsorbed in the proximal tubule. In the proximal tu- bule, claudin-2 is postulated to form tight junction cat- ion pores [9]. Muto et al. have reported that fractional excretion of Ca
2+in claudin-2 knockout mice is 3 times that of wild-type mice, further supporting a role of claudin-2 in proximal tubular paracellular Ca
2+re- absorption [39]. In this study, we found that chronic salt loading decreased renal cortical claudin-2 protein ex- pression. Although there is not enough functional stud- ies of rat claudin-2, sequence similarity to mouse claudin-2 suggests a similar role in Na
+and Ca
2+trans- port. Therefore, the decreased expression of claudin-2 with high-salt diet may, to some degree, account for the decrease in Ca
2+reabsorption, while limiting Na
+and water reabsorption, as Na
+[9] and water [40] in addition to Ca
2+may pass through the pores formed by claudin- 2. It has been reported that hyperosmolarity stress decreased claudin-2 expression in Madin-Darby canine kidney cells [41], and hyperosmolarity due to NaCl load may be a possible mechanism of claudin-2 downregula- tion in this study. As claudin-2 facilitates Ca
2+move- ment from the luminal to interstitial fluid in the proximal tubule, reduction in claudin-2 may underlie the increased urinary Ca
2+excretion observed under high-salt diet.
In the proximal tubule, NHE3 is shown to be import- ant as a part of driving force for Ca
2+reabsorption, mediating apical Na
+entry and consequently water re- absorption to produce osmotic gradient [18]. In our study, renal NHE3 protein significantly increased with salt loading. However, this finding is not in accordance with some previous studies, such as that of Frindt and Palmer who found no change in luminal NHE3 with 5% NaCl diet for 1 week in rats using in situ biotinyla- tion [42]. As regulation of NHE3 occurs on multiple levels, including trafficking, interacting proteins and oligomerization [43], protein level may not be directly related to apical NHE3 activity. If NHE3 activity is in- deed increased in the high salt-fed rats, this may in- crease the pressure for Ca
2+reabsorption in the proximal tubule. However, competition between Na
+and Ca
2+for paracellular transport binding site may occur in the proximal tubule. It has been reported that Ca
2+inhibits paracellular Na
+conductance by competi- tive binding on claudin-2 [44]. If Na
+and Ca
2+share a binding site, inversely, high Na
+may inhibit claudin-2 Ca
2+conductance. This competition between Na
+and Ca
2+may play a large role in the dietary NaCl-induced hypercalciuria.
Thick ascending limb of the loop of Henle is respon- sible for approximately 20% of Ca
2+reabsorption.
Claudin-16 and −19 are shown to be important for para- cellular Mg
2+and Ca
2+in this segment. In our study, there was an increase in the fractional excretion of Mg, albeit smaller than that of Ca. However, there was no significant difference in renal claudin-16 or −19 mRNA in rats on high-salt diet. Extracellular volume expansion decreases transepithelial voltage and Mg
2+reabsorption in the TAL [45]. Although not directly detectable in our experimental setting, there may have been some volume expansion in the high-salt fed rats which may have con- tributed to the increase in Mg
2+fractional excretion.
Distal nephron is the final and most-regulated site of urinary Ca
2+reabsorption [46,47]. A concerted increase in the expression levels of TRPV5, calbindin-D
28k, and NCX1, was observed with salt loading in this study.
Claudin-8, the distal tubular paracellular cation barrier, was not altered by salt loading. It may be that with salt loading, the proximal, paracellular Ca
2+reabsorption is reduced, and more distal, transcellular Ca
2+transport molecules are upregulated to facilitate Ca
2+reabsorption as a compensatory mechanism. However, salt loading may reduce the Ca
2+reabsorption via NCX1, as illu- strated in Figure 7. Therefore, the upregulation of distal Ca
2+transport machinery with chronic salt-loading may partially compensate for the urinary Ca
2+loss, although with a limited effect.
As for the mechanism of TRPV5, calbindin-D
28k, and NCX1 upregulations by dietary NaCl, one possibility is the endocrine factors that regulate Ca
2+-related mole- cules, such as parathyroid hormone [48] and vitamin D [49]. For example, 1,25(OH)
2D has been shown to in- crease the expressions of TRPV5, calbindinD
28k, and NCX1 [35]. However, in this study, serum concentration of 1,25(OH)
2D was significantly lower in the high-salt group than the control group. Unless there is a signifi- cant difference between serum and intrarenal 1,25(OH)
2D levels, it is likely that salt-induced transcellular Ca
2+-trans- porter upregulation is mediated by pathway(s) other than 1,25(OH)
2D.
The weakness of the study includes a lack of regional expression data, as excised renal cortex was used in the study. Higher-resolution immunohistological staining experiments and qRT-PCR/Western blotting from micro-dissected tissue specimens are necessary in the fu- ture. However, this study aimed to lay the foundation for a more detailed mechanistic examination of the effects of chronically high dietary sodium on the expression of renal Ca transporters and on urinary calcium excretion.
Conclusions
Our findings suggest that the decrease in renal claudin-2
protein by salt loading may increase the Ca
2+in tubular
fluid reaching the distal tubule, while the concerted
upregulation of more distal Ca
2+-handling molecules
may curtail some of the Ca
2+loss in the urine. Findings of our study may have implications on further research on the pathophysiology of osteoporosis, urinary stone formation and hypertension associated with excessive salt intake.
Abbreviations
NCX1: Na+/Ca2+exchanger 1; 1,25(OH)2D: 1,25-dihydroxyvitamin D3.
Competing interests
The authors declare that they have no competing interests.
Authors’contributions
MSY conceived the experiments in part with JY. KT, YM, RS and SA performed the experiments. HS, JK and TW gave advice on the study. All authors read and approved the final manuscript.
Acknowledgments
We thank Hiroko Ohashi, Atsuko Hashimoto and Kaori Aso for their technical assistance. Junichi Taniguchi at Jichi Medical University provided us with insightful comments on the manuscript. We are also grateful for the support of Tomoyuki Ono and Sanae Sato in completing this study. MSY was supported by KAKENHI 23790950 Grant-in-Aid for Young Scientists (B), NISHINOMIYA Basic Research Fund (Japan), and a program project grant from Fukushima Medical University.
Author details
1Department of Pharmacology, Fukushima Medical University School of Medicine, 1 Hikarigaoka, Fukushima 960-1295, Japan.2Department of Nephrology, Hypertension, Diabetology, Endocrinology and Metabolism, Fukushima Medical University School of Medicine, Fukushima, Japan.
3Division of Health Science Research, Fukushima Welfare Federation of Agricultural Cooperatives, Fukushima, Japan.
Received: 13 June 2012 Accepted: 27 November 2012 Published: 2 December 2012
References
1. Massey LK, Whiting SJ:Dietary salt, urinary calcium, and kidney stone risk.
Nutr Rev1995,53(5):131–139.
2. Goulding A, Campbell D:Dietary NaCl loads promote calciuria and bone loss in adult oophorectomized rats consuming a low calcium diet.J Nutr 1983,113(7):1409–1414.
3. Heaney RP:Role of dietary sodium in osteoporosis.J Am Coll Nutr2006, 25(3 Suppl):271S–276S.
4. Quereda C, Orte L, Sabater J, Navarro-Antolin J, Villafruela JJ, Ortuno J:
Urinary calcium excretion in treated and untreated essential hypertension.J Am Soc Nephrol1996,7(7):1058–1065.
5. McCarron DA, Rankin LI, Bennett WM, Krutzik S, McClung MR, Luft FC:
Urinary calcium excretion at extremes of sodium intake in normal man.
Am J Nephrol1981,1(2):84–90.
6. Walser M:Calcium clearance as a function of sodium clearance in the dog.Am J Physiol1961,200:1099–1104.
7. Angelow S, Ahlstrom R, Yu AS:Biology of claudins.Am J Physiol Renal Physiol2008,295(4):F867–F876.
8. Enck AH, Berger UV, Yu AS:Claudin-2 is selectively expressed in proximal nephron in mouse kidney.Am J Physiol Renal Physiol2001,
281(5):F966–F974.
9. Amasheh S, Meiri N, Gitter AH, Schoneberg T, Mankertz J, Schulzke JD, Fromm M:Claudin-2 expression induces cation-selective channels in tight junctions of epithelial cells.J Cell Sci2002,115(Pt 24):4969–4976.
10. Hoenderop JG, Nilius B, Bindels RJ:Calcium absorption across epithelia.
Physiol Rev2005,85(1):373–422.
11. Hemmingsen C:Regulation of renal calbindin-D28K.Pharmacol Toxicol 2000,87(Suppl 3):5–30.
12. Hoenderop JG, Willems PH, Bindels RJ:Toward a comprehensive molecular model of active calcium reabsorption.Am J Physiol Renal Physiol2000,278(3):F352–F360.
13. Boros S, Bindels RJ, Hoenderop JG:Active Ca(2+) reabsorption in the connecting tubule.Pflugers Arch2009,458(1):99–109.
14. Teerapornpuntakit J, Dorkkam N, Wongdee K, Krishnamra N, Charoenphandhu N:Endurance swimming stimulates transepithelial calcium transport and alters the expression of genes related to calcium absorption in the intestine of rats.Am J Physiol Endocrinol Metab2009, 296(4):E775–E786.
15. Lee CT, Lien YH, Lai LW, Chen JB, Lin CR, Chen HC:Increased renal calcium and magnesium transporter abundance in streptozotocin-induced diabetes mellitus.Kidney Int2006,69(10):1786–1791.
16. Wongdee K, Pandaranandaka J, Teerapornpuntakit J, Tudpor K,
Thongbunchoo J, Thongon N, Jantarajit W, Krishnamra N, Charoenphandhu N:Osteoblasts express claudins and tight junction-associated proteins.
Histochem Cell Biol2008,130(1):79–90.
17. Yatabe J, Sanada H, Yatabe MS, Hashimoto S, Yoneda M, Felder RA, Jose PA, Watanabe T:Angiotensin II type 1 receptor blocker attenuates the activation of ERK and NADPH oxidase by mechanical strain in mesangial cells in the absence of angiotensin II.Am J Physiol Renal Physiol2009, 296(5):F1052–F1060.
18. Pan W, Borovac J, Spicer Z, Hoenderop JG, Bindels RJ, Shull GE, Doschak MR, Cordat E, Alexander RT:The epithelial sodium/proton exchanger, NHE3, is necessary for renal and intestinal calcium (re)absorption.Am J Physiol Renal Physiol2012,302(8):F943–F956.
19. Angelow S, El-Husseini R, Kanzawa SA, Yu AS:Renal localization and function of the tight junction protein, claudin-19.Am J Physiol Renal Physiol2007,293(1):F166–F177.
20. Simon DB, Lu Y, Choate KA, Velazquez H, Al-Sabban E, Praga M, Casari G, Bettinelli A, Colussi G, Rodriguez-Soriano J,et al:Paracellin-1, a renal tight junction protein required for paracellular Mg2+ resorption.Science1999, 285(5424):103–106.
21. Konrad M, Schaller A, Seelow D, Pandey AV, Waldegger S, Lesslauer A, Vitzthum H, Suzuki Y, Luk JM, Becker C,et al:Mutations in the tight- junction gene claudin 19 (CLDN19) are associated with renal magnesium wasting, renal failure, and severe ocular involvement.Am J Hum Genet 2006,79(5):949–957.
22. Li WY, Huey CL, Yu AS:Expression of claudin-7 and−8 along the mouse nephron.Am J Physiol Renal Physiol2004,286(6):F1063–F1071.
23. Yu AS, Enck AH, Lencer WI, Schneeberger EE:Claudin-8 expression in Madin-Darby canine kidney cells augments the paracellular barrier to cation permeation.J Biol Chem2003,278(19):17350–17359.
24. Hoenderop JG, van der Kemp AW, Hartog A, van de Graaf SF, van Os CH, Willems PH, Bindels RJ:Molecular identification of the apical Ca2+
channel in 1, 25-dihydroxyvitamin D3-responsive epithelia.J Biol Chem 1999,274(13):8375–8378.
25. Lambers TT, Bindels RJ, Hoenderop JG:Coordinated control of renal Ca2+
handling.Kidney Int2006,69(4):650–654.
26. Magyar CE, White KE, Rojas R, Apodaca G, Friedman PA:Plasma membrane Ca2+−ATPase and NCX1 Na+/Ca2+ exchanger expression in distal convoluted tubule cells.Am J Physiol Renal Physiol2002,283(1):F29–F40.
27. Bindels RJ, Ramakers PL, Dempster JA, Hartog A, van Os CH:Role of Na +/Ca2+ exchange in transcellular Ca2+ transport across primary cultures of rabbit kidney collecting system.Pflugers Arch1992,420(5–6):
566–572.
28. Hinata M, Yamamura H, Li L, Watanabe Y, Watano T, Imaizumi Y, Kimura J:
Stoichiometry of Na+−Ca2+ exchange is 3:1 in guinea-pig ventricular myocytes.J Physiol2002,545(Pt 2):453–461.
29. Brenner BM:Brenner & Rector's the Kidney. 8th edition. Philadelphia, PA:
Saunders Elsevier; 2008:187.
30. Yoshitomi K, Fromter E:How big is the electrochemical potential difference of Na+ across rat renal proximal tubular cell membranes in vivo?Pflugers Arch1985,405(Suppl 1):S121–S126.
31. Manunta P, Ferrandi M, Bianchi G, Hamlyn JM:Endogenous ouabain in cardiovascular function and disease.J Hypertens2009,27(1):9–18.
32. Bagrov AY, Fedorova OV, Dmitrieva RI, French AW, Anderson DE:Plasma marinobufagenin-like and ouabain-like immunoreactivity during saline volume expansion in anesthetized dogs.Cardiovasc Res1996, 31(2):296–305.
33. Schoner W, Scheiner-Bobis G:Endogenous and exogenous cardiac glycosides: their roles in hypertension, salt metabolism, and cell growth.
Am J Physiol Cell Physiol2007,293(2):C509–C536.
34. Nilius B, Prenen J, Hoenderop JG, Vennekens R, Hoefs S, Weidema AF, Droogmans G, Bindels RJ:Fast and slow inactivation kinetics of the Ca2+
channels ECaC1 and ECaC2 (TRPV5 and TRPV6). Role of the intracellular
Yatabeet al. BMC Nephrology2012,13:160 Page 8 of 9
http://www.biomedcentral.com/1471-2369/13/160
loop located between transmembrane segments 2 and 3.J Biol Chem 2002,277(34):30852–30858.
35. Lytton J, Lee SL, Lee WS, van Baal J, Bindels RJ, Kilav R, Naveh-Many T, Silver J:The kidney sodium-calcium exchanger.Ann N Y Acad Sci1996, 779:58–72.
36. Duarte CG, Watson JF:Calcium reabsorption in proximal tubule of the dog nephron.Am J Physiol1967,212(6):1355–1360.
37. Simchon S, Manger WM, Brown TW:Dual hemodynamic mechanisms for salt-induced hypertension in Dahl salt-sensitive rats.Hypertension1991, 17(6 Pt 2):1063–1071.
38. Keppler A, Gretz N, Schmidt R, Kloetzer HM, Groene HJ, Lelongt B, Meyer M, Sadick M, Pill J:Plasma creatinine determination in mice and rats: an enzymatic method compares favorably with a high-performance liquid chromatography assay.Kidney Int2007,71(1):74–78.
39. Muto S, Hata M, Taniguchi J, Tsuruoka S, Moriwaki K, Saitou M, Furuse K, Sasaki H, Fujimura A, Imai M,et al:Claudin-2-deficient mice are defective in the leaky and cation-selective paracellular permeability properties of renal proximal tubules.Proc Natl Acad Sci U S A2010,107(17):8011–8016.
40. Rosenthal R, Milatz S, Krug SM, Oelrich B, Schulzke JD, Amasheh S, Gunzel D, Fromm M:Claudin-2, a component of the tight junction, forms a paracellular water channel.J Cell Sci2010,123(Pt 11):1913–1921.
41. Ikari A, Takiguchi A, Atomi K, Sato T, Sugatani J:Decrease in claudin-2 expression enhances cell migration in renal epithelial Madin-Darby canine kidney cells.J Cell Physiol2011,226(6):1471–1478.
42. Frindt G, Palmer LG:Surface expression of sodium channels and transporters in rat kidney: effects of dietary sodium.Am J Physiol Renal Physiol2009,297(5):F1249–F1255.
43. Bobulescu IA, Moe OW:Luminal Na(+)/H (+) exchange in the proximal tubule.Pflugers Arch2009,458(1):5–21.
44. Yu AS, Cheng MH, Coalson RD:Calcium inhibits paracellular sodium conductance through claudin-2 by competitive binding.J Biol Chem 2010,285(47):37060–37069.
45. Poujeol P, Chabardes D, Roinel N, De Rouffignac C:Influence of extracellular fluid volume expansion on magnesium, calcium and phosphate handling along the rat nephron.Pflugers Arch1976, 365(2–3):203–211.
46. Friedman PA, Gesek FA:Cellular calcium transport in renal epithelia:
measurement, mechanisms, and regulation.Physiol Rev1995, 75(3):429–471.
47. Windhager EE, Frindt G, Milovanovic S:The role of Na-Ca exchange in renal epithelia.An overview. Ann N Y Acad Sci1991,639:577–591.
48. van Abel M, Hoenderop JG, van der Kemp AW, Friedlaender MM, van Leeuwen JP, Bindels RJ:Coordinated control of renal Ca(2+) transport proteins by parathyroid hormone.Kidney Int2005,68(4):1708–1721.
49. Hoenderop JG, Dardenne O, Van Abel M, Van Der Kemp AW, Van Os CH, St- Arnaud R, Bindels RJ:Modulation of renal Ca2+ transport protein genes by dietary Ca2+ and 1,25-dihydroxyvitamin D3 in 25-hydroxyvitamin D3- 1alpha-hydroxylase knockout mice.Faseb J2002,16(11):1398–1406.
doi:10.1186/1471-2369-13-160
Cite this article as:Yatabeet al.:Effects of a high-sodium diet on renal tubule Ca2+transporter and claudin expression in Wistar-Kyoto rats.
BMC Nephrology201213:160.
Submit your next manuscript to BioMed Central and take full advantage of:
• Convenient online submission
• Thorough peer review
• No space constraints or color figure charges
• Immediate publication on acceptance
• Inclusion in PubMed, CAS, Scopus and Google Scholar
• Research which is freely available for redistribution
Submit your manuscript at www.biomedcentral.com/submit