One‑person Household in Japan
著者 Hashimoto Noriko
journal or
publication title
Kansai University review of economics
volume 8
page range 43‑61
year 2006‑03
URL http://hdl.handle.net/10112/12261
A Preliminary Note on Expenditure Patterns of One‑person Household in Japan
Noriko Hashimoto*
For several years, the Japanese family budget structure and its attributes have changed greatly with social and economic development. What stands out especially is the dwindling size of family, evident in the increase of one‑person household. We use the micro data of National survey of Family Income and Expenditure of 1999 to examine the expenditure patterns of one‑person households, which vary by attributes, such as sex, job status, age, annual income and type of residence.
Keywords: National survey of Family Income and Expenditure, micro data, one‑person household, household attributes, expenditure pattern
1. Preface
For several years, the Japanese family budget structure and its attributes have changed a lot with social and economic development.
Notable one trend is the dwindling size of family.
The increase of nuclear families due to the changes in lifestyle and the sharp decline in the number of birth significantly decreased the size of family. Annual Report on the Family Income and Expenditure Survey, which covers households of 2 persons and above, reports that the size of one family decreased from 4.2 persons per household in 1963 to 3.5 persons in 1999.
During the same period, increase of one‑person household stands out.
In the past, single person households were observed primarily among persons who finished school and lived by themselves until they got married. However, growing tendency to delay ma'rriage and
* Professor of Econometrics
43
increasing women's participation in society raised the number of one‑
person households not only in 20's age group but also in 30's and 40's, while rapidly aging society enlarged the number of aged one‑person household as well.
As a result of these facts, the census of 2000 reported that the number of one‑person household in Japan is 12.91 million, which accounts for 27 .6%・of all households.
To grasp the situations of one‑person household accurately is imperative 1> because the ratio of single household is significant, and their spending patterns are thought to be different from traditional households. The state of unoccupied aged one person is also crucial in conceiving the future social welfare.
There are some sampling surveys of consumption in Japan. In their published reports, only aggregated statistics, mean values in most cases, are released. As the (conditional) use of micro data has been approved abroad, many researchers in Japan have been aspiring to use the micro data. Recently, the circumstances for their use are improving little by little.
At present, SSJDA (the Social Science Data Archive, http://ssjda. iss.u‑tokyo.ac.jp) collects and provides data obtained from social surveys to researchers for secondary analyses. Also available, from the autumn of 2004, is the COE program by Research Centre for Information and Statistics of Social Science, Institute of Economic Research, Hitotsubashi University. Although still at a trial stage, this program provides micro data of official statistics to applicants. Once approved they are able to use certain micro data for half a year period. Three surveys that include National survey of Family Income and Expenditure are available at the moment for reserch. (See details in http://rcisss.ier.hit‑u.ac.jp/.)
This paper presents the first and preliminary results of analyses of the micro‑data for one‑person households by researchers, Hashimoto and Araki who were approved to use the micro data from National survey of Family Income and Expenditure of 1999.
2. Data
The National survey of Family Income and Expenditure (hereinafter
called NFIE) is done by Statistics Bureau, Management and Coordination Agency2> every five years since 1959. It covers all parts of Japan and all categories of business紅 Itis a comprehensive inquest for households'expenditure, saving and debt, holdings of durables and possession of properties such as residence and land. To get detailed results which can not be obtained by usual family surveys, NFIE investigates considerable numbers of households to capture the household's characteristics by their age, income level, inhabiting districts, and so on.
The 1999 survey was conducted in autumn, from September to November for general households4> and from October to November for one‑person households. 54,792 general households'and 5,002 one‑
person households'data were collected.
Published report of NFIE (1999) focused on the effect on consumption via possession of housing and/or land and the situation of sharp increase in aged households.
The purpose of this paper is to bring out the influences of sex, occupational state, age‑group, income level and possessing residence and so on by using micro data of 4,012 one‑person households砂
The Statistics Bureau, Management and Coordination Agency also attempts to grasp the consumption trend of one‑person households by using another form. They started the survey of the Income and Expenditure Survey for One‑person households (hereinafter called 1 person Survey) in 1995. In this survey, 673 one‑person households6>
are inquired every month. Every household responds to the survey for three months and one third of the households are shuffled every month. Only aggregated statistics (the mean value) are published and detailed trend of each attributes are difficult to grasp.
In this paper, we arbitrarily compare our results with the findings of 1 person Survey of 1999.
3. The characteristics of the one‑person household
W e use the micro data of 4012 households (persons) which constututes of 2421 women (60.3%) and 1591 men (39.7%). This is a little difference from the ratio of 1 person Survey of 1999, whose sex ratio is 50.3% for male and 49.7% for female. People without a job
are 1538 (38.3%) and 24 7 4 persons (61. 7%) are employed. The participation rate of 1 person Survey is a little bit lower at 34.9%.
Look more closely into the state of employed person. For working form, 79.0% are permanent employees and 21.0% are part‑time workers. For form of business organization, 70.5% work for private offices, 10.8% for self‑owned business and 18.7% for public offices. For type of job, service industry dominates occupying 30. 7 % workers followed by manufacturing industry (25.2%), wholesaling, retailing and restaurant business (13.9%) and public service (10.1 %). The percentage of the agriculture, forestry and fisheries industry workers, which are excluded in 1 person Survey, is 1.9%.
To look at the employment situation by gender, 85.0% of male are occupied. Most of unemployed men are aged (60 years old and above). For female, job‑less percentage (53. 7%) exceeds the occupied rates (46.3%)璽 Thisis because large numbers of aged persons are female and most of them are unoccupied. These age‑
related characteristics are examined in detail below.
Next, take a look at the age composition. Figure 1 distribution7)̲
shows age
009 00寸
k :i u
a nb a
" J
i
oo
c
OON
00
゜ 20 40 50 70 80
Age
Figure 1 Age distribution (All households)
As a whole, many one‑person households are distributed in the youth layer (under 35 years old) and age layer (60 years old and
)U nO :J
400
300
200
100
゜
400
300
200
100
゜
20 40 60 80
Age
Figure 2 Age distribution (by gender)
above). 1 person Survey uses three age classification (under the age of 35, 35 to 59, and 60 years old and above) and age composition of NFIE provides a rational basis for this classification翌
Examine the age composition by gender (Figure 2).
For Male (upper stand), one‑person households centers in one location, the youth layer (under 35). Otherwise, for female (lower stand), quite a few one‑person households are distributed into the youth layer and many are into the aged layer (60 and above). As a result, age composition for female is di‑mordal.
Additionally, examine the state of occupation. For male (Figure 3), with few exceptions, single households under 60 years old are occupied. Aged single households sometimes continue to work
(27 .8%), but most of aged male single households are unoccupied.
For female (Figure 4), most households are occupied in youth and matured age layer, but the employment rate falls off over 55 years old. 80. 7 % of aged persons are unoccupied and around 20% aged persons continue to work. Those who continue to work over 60 are considered to belong in large part to the self‑owned business.
i u n o : :
: , l
No Occupation
300
200
100
゜
300
200
100
゜
20 40 60 80
Age
Figure 3 Age distribution of Male households (by occupational states)
1u no :)
400
300
200
100
゜
400
300
200
100
゜
20 40 60 80
Age
Figure 4 Age distribution of Female households (by occupational states)
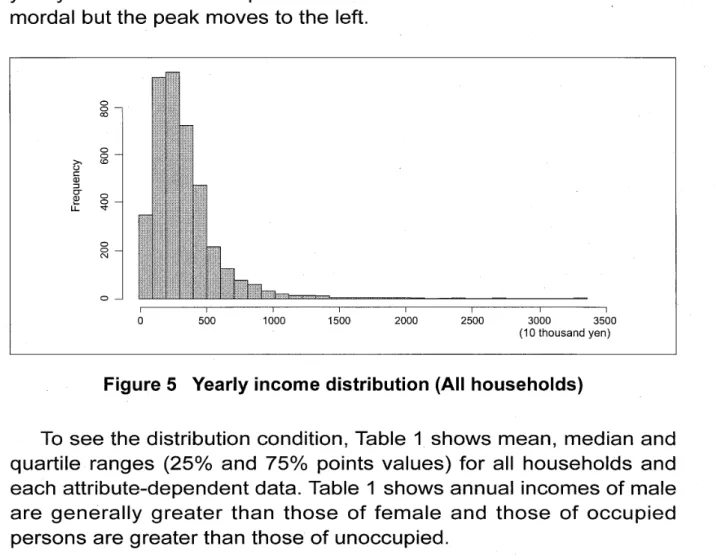
Next, let's see the distribution of yearly income. Figure 5 shows the yearly income of all one‑person households砂 Thedistribution is uni‑ mordal but the peak moves to the left.
008
ざ
ua
nb
aJ
n ‑
009
oo
v
oo
z
゜
゜
500 1000 1500 2000 2500 3000 3500(10 thousand yen)
Figure 5 Yearly income distribution (All households)
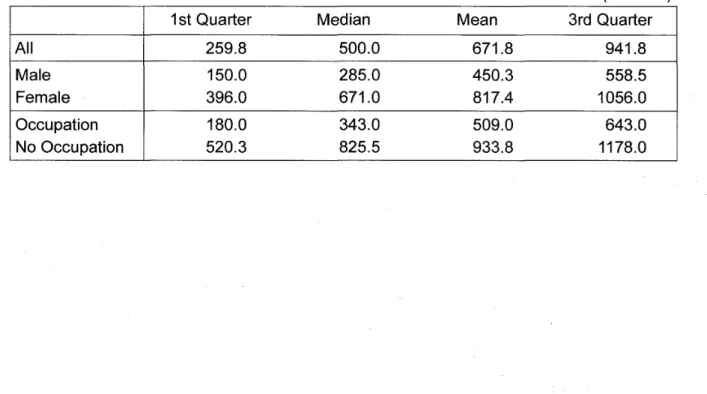
To see the distribution condition, Table 1 shows mean, median and quartile ranges (25% and 75% points values) for all households and each attribute‑dependent data. Table 1 shows annual incomes of male are generally greater than those of female and those of occupied persons are greater than those of unoccupied.
Table 1 The distribution state of annual income
(unit:10 thousand yen) 1st Quarter Median Mean 3rd Quarter
All 177.0 280.0 323.9 410.0
Male 272.5 377.0 412.7 500.0
Female 150.0 221.0 265.6 327.0
Occupation 246.0 351.5 394.9 480.0
No Occupation 126.3 190.0 209.8 263.8
Next, examine the type of residence.
In NFIE, nine classifications for dwelling are used. Nine categories
are 1) owned houses (name of his/her own), 2) owned houses (name of others), 3) privately owned rented houses (proprietary facilities), 4) privately owned rented houses (sharing facilities), 5) local government owned rented houses, 6) public owned rented houses, 7) company housing, 8) rented room and 9) company dormitory.
In NFIE of 1999, 40.6% single households live in 1) owned houses (name of their own) and the percentage reaches 43.0% including the ratio of 2) owned houses under name of others. Subsequently, 26.4%
persons dwell in 3) privately owned rented houses (proprietary facilities), 19.1 % in 9) company dormitory and 6.1 % in public owned rented houses (putting 5) local government and 6) public owned rented houses together) and 3.8% in company housing.
1 person Survey reports home ownership rate is 51.3% and the rate of privately owned rented houses (proprietary facilities) is 34.6%.
These rates are slightly different with those of NFIE.
Take a look into the rate of type of dwellings by attributes (Table 2). Table 2 shows that the rate of owned houses and public owned rented houses for females are relatively high. The rate of privately owned rented houses for people without job is low, and nearly half of males live in company dwellings.
Table 2 The type of possessed dwellings (by attributes)
Owned Houses Privatelyh owned Public owned Comphao ny owned rented ouses rented houses uses
All 43.0% 27.3% 6.1% 22.9%
Male 20.9% 27.7% 3.0% 47.8%
Female 57.5% 27.0% 8.1% 6.6%
Occupation 24.1% 33.4% 4.6% 37.1%
No Occupation 73.3% 17.4% 8.5% 0.1%
Owned houses: category 1 + 2, privately owned rented houses: category 3+4, Public owned rented houses: category 5+6, company owned houses: category 7+9
Table 3 shows the rate of type of dwellings by age. Home ownership rate goes up by age and reaches 75% for the aged layer. By contrast, the rate of privately owned rented house is low for the aged group. Above‑mentioned high home ownership of female and
unoccupied persons give account for high ownership rate of aged group. For young one‑person household, the most popular residence (56.8%) is company owned houses.
Check other characteristics associated with the residence.
The percentage of people who pay house rent is 44.6% and that of who pay residential mortgage is only 4.6%.
Table 3 The type of possessed dwellings (by age)
Age Owned Houses Privatelyh owned Public owned Comph any rented ouses rented houses owned ouses under35 4.0% 36.0% 2.0% 56.8% 35 to 59 39.9% 35.7% 8.3% 15.4% 60 and above 74.8% 16.2% 8.1% 0.6%
The distributions in space of dwellings by attributes are shown in Table 4 and those by age are shown in Table 5. Table 4 shows the distribution of female compared with that of male and the distribution of unoccupied person compared with that of occupied person are located to the right. That is, women and people without job live relatively in wider residences. This is in relation with the above‑
mentioned high ownership rate among women and unoccupied person, consequently aged person, tend to live in wider dwellings.
Table 4 The size of possessed dwellings (by attributes)
(unit: mり 1st Quarter Median Mean 3rd Quarter All 259.8 500.0 671.8 941.8 Male 150.0 285.0 450.3 558.5 Female 396.0 671.0 817.4 1056.0 Occupation 180.0 343.0 509.0 643.0 No Occupation 520.3 825.5 933.8 1178.0
Table 5 The size of possessed dwellings (by age)
(unit: mり
1st Quarter Median Mean 3rd Quarter
under35 143.0 207.0 289.4 360.0
35 to 59 330.0 528.0 653.8 857.0
60 and above 551.8 863.0 977.6 1200.0
4. The expenditure patterns of one‑person household
In this section, we use use‑classification expenditure data to grasp the characteristics of the expenditure behavior in single households.
W e focus on whether a difference is observed via various attributes (sex and state of employment and age), by the yearly income and the type of possession of the residence.
In NFIE survey, households'consumption expenditure is divided into these 10 items: Food, Housing (Rent, Repair & Maintenance), Fuel, Light & Water charges, Furniture & Household utensils, Clothing
& Footwear, Medical Care, Transportation & Communication, Education, Reading & Recreation and Miscellaneous.
In addition, food expenditure is classified into the following 13 items: Cereals, Fish, Meat, Daily products and eggs, Vegetables and seaweed, Fruits, Oils, Fats & Seasonings, Cakes & Candies, Cooked Food, Beverages, Alcoholic Beverages, Eating out and Charges of board.
Observe the expenditure patterns of this data at this point.
For general categories, the expenditure for education is rarely expensed to the household as the member constitutes only one adult10>. So, we added the education expenses with miscellaneous. As a result, we use the following 9 item classification for general categories.
1. Food
2. Housing (Rent, Repair & Maintenance) 3. Fuel, Light & Water charges
4. Furniture & Household utensils 5. Clothing & Footwear
6. Medical Care
7. Transportation & Communication
8. Reading & Recreation
9. Miscellaneous (include education)
For food categories, charges for board are typical item for a single family survey. This is the charge paid for the food provided at company dormitories and shared housings. In this data, 12.1 % households spent charges of board and most of them live in company dormitories. However, 40% of company dormitory residents do not spent charges of board. Consequently, we added charges of board expenses with eating out as eating out includes meals at the company cafeteria. As a result, we use following 12 item classification for food categories.
1. Cereals 3. Meat
5. Vegetables and seaweed 7. Oils, Fats & Seasonings 9. Cooked Food
11. Alcoholic Beverages
2. Fish
4. Daily products and eggs 6. Fruits
8. Cakes & Candies 10. Beverages
12. Eating out
(includes Charges of board) Now, the distributions of each item's expenditure are abundantly biased to the left. To correct this bias, we used log‑transformation and adopted very simple model CEDS (Constant Elasticity Demand System) to calculate expenditure elasticities.
log qi = Gt + et log(X IP)
where qi: consumed quantity for item i ,
X : consumption expenditure, P: price index
For most expense items, there are households who do not pay for that item. W e exclude these households in each item consumption function and estimate elasticities by OLS. The number of households who do not spend on that item is reported in tables below.
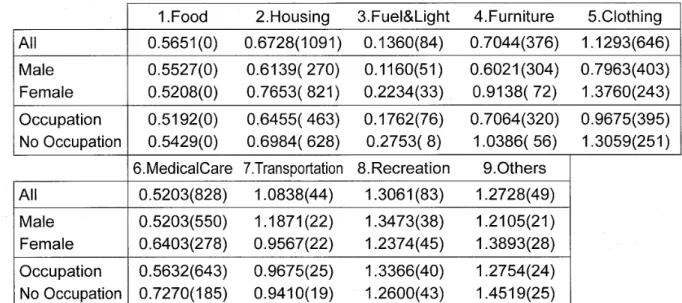
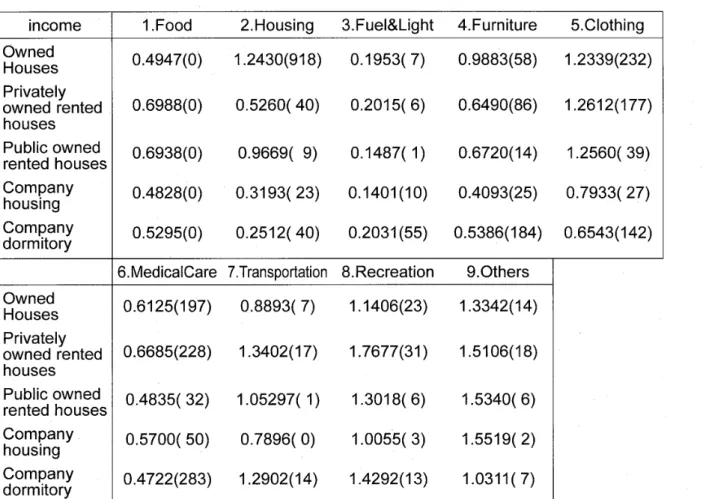
First, we will examine the result of general classification.
Table 6 shows expenditure elasticities of all households and those by each attributes. In all cases, the basic need of 3.Fuel & Light is strongly estimated. Items 1.Food, 2.Housing and 6.Medical care are judged as necessities as well. Meantime, 8.Recreation and 9 Others are assessed as luxuries. Other items, 4.Furniture, 5.Clothing and