Development of precise comprehensive element analysis for natural fluids by ICP-MS
with freeze-drying pre-concentration and its application to the geochemical study of
hot-spring fluids in Misasa area, Tottori, Japan:
Implication for origin of Rn-rich hot spring fluids
2018 September Que Dinh Hoang
Institute for Planetary Materials,
Graduate School of Natural Science and Technology,
Okayama University
ABSTRACT
The chemical characteristics of hot-spring waters are believed as the consequence of interactions between hot waters and solids or mixtures between the cold waters and hot waters within the crust of the Earth. Thus, element abundances and isotopic compositions in the hot-spring waters can provide physio-chemical characteristics of the hydrothermal system and details concerning the origin and evolution of these waters. In Japan, there are more than 4536 hot springs. Among them, hot-springs in Misasa area, Tottori Prefecture, southwest Japan, are well-known as the Rn-rich hot springs with high temperature. Misasa hot springs have been studied for more than a century, but their geochemical features and origin of the Rn-rich hot-spring waters are still not understood yet. This is because of difficulties in determination of the small quantities of elements that they contain, as low as fg g−1 level.
Therefore, this study is firstly aimed to develop a pre-concentration method to precisely determine 52 elements by using a FDC-ID-IS method, which is a combination of freeze-drying pre-concentration (FDC) and isotope dilution internal standardization (ID-IS). By sublimation of H2O,∼100-125 mL of the sample solution was reduced by<1/50. After FDC, the sample was collected, digested, dried, and redissolved. For analyses of Li, Be, Na, Mg, Al, P, K, Ca, Sc, V, Mn, Fe, Ni, Co, Cu, Zn, Ga, Rb, Sr, Y, Cd, In, Cs, Ba, REE, Tl, Pb, Bi, Th, and U (group I element), the sample was mixed with HCl, HF, and HClO4, and the residue after drying was redissolved with HNO3. For analyses of B, Ti, Zr, Nb, Mo, Sn, Sb, Hf, Ta (group II element), the sample was mixed with HF and mannitol, and the residue after drying was redissolved with HF. Abundances of 52 elements were determined by six acquisitions using mass spectrometry after addition of spiked solutions. Abundances of group I elements were determined by four acquisitions Ia (for Li, Be, Rb, Sr, Y, Cs, Ba, REE, Pb, Th, and U), Ib (for Cd, In, Tl, and Bi), Ic (for Na, Mg, Al, P, Ca, V, Mn, Fe, Co, and Sr), and Id (for K, Sc, Ni, Cu, Zn, Ga, and Sr). Abundances of group II elements were determined by two acquisitions IIa (for B, Zr, Nb, Mo, Sn, Sb, Hf, and Ta) and IIb (for Ti). Acquisitions Ia, Ib, and IIa, and acquisitions Ic, Id, and IIb were conducted by ICP-QMS and ICP-SFMS, respectively. To minimize overestimation of element abundances resulted from interferences, high-mass-resolution technique was applied for acquisitions Ic, Id, and IIb with mass resolution of 4000, 10000, and 4000, respectively. The oxide-correction was applied for acquisitions Ia and Ib. In order to determine element abundances with accuracy better than 10%, the solution fed into mass spectrometry should be with concentration of HNO3
>0.3 mol L−1to avoid hydrolysis of cations. Matrix-effected signal suppression was not significant for the solutions with NaCl concentrations lower than 0.2 cg g−1and 0.1 cg g−1for ICP-QMS and ICP-SFMS, respectively. Recovery yields of elements on FDC were 96.8-105%. Detection limits in a sample solution with FDC were≤10 pg g−1, except 100 pg g−1 for Na, 89.0 pg g−1for K, and 15.6 pg g−1for Ca, respectively. Blanks with FDC were pg-level, except for 11 elements (ng-level, Na, Mg, Al, P, Ca, Mn, Fe, Co, Ni, Cu, and Zn). Reproducibilities on determination of element abundances of standard river water SLRS5 with FDC were≤10% and 21% for 51 elements and Sn, respectively. The reliability of the FDC-ID-IS method was demonstrated by analyses of drinking waters from seven geological sources of which abundances of 52 elements were found ranging from fg g−1(e.g., REE) to µg g−1level (e.g., Na). The FDC-ID-IS method has been applying for analyses of Misasa hot-spring waters.
Then, a comprehensive geochemical analyses of hot-spring waters were conducted using the FDC-ID-IS, ion chromatography, liquid scintillation counting, and isotopic analysis to determine abun- dances of major- and trace-elements including cations, anions, and Rn, and Sr isotopic composition, respectively. Based on new results including geochemical data and fluid properties, Misasa hot-spring waters are characterized. The new results of this study, together with those available literature of geological, geochemical, geothermal, and geophysical data, the origin of Rn-rich hot-spring waters in Misasa are further interpreted.
In Misasa area, there are 57 hot-springs locating in narrow strip 1.5 km stretch of Mitoku river of Misasa valley, where basement geology are dominated by late Tertiary plutonic rocks to early Quaternary volcanic rocks. The hot-spring waters show variations in abundances of not only among elements, but also among waters. These variations are likely related to solubility of elements in the waters, which are turn out dependent upon water properties such as temperature, pH, oxidation- reduction condition, and scavenging with anions. Most elements are controlled both temperature and pH, while REE and U, which are probably controlled by scavenging with Cl− and SO2−4 and incorporated with Fe oxyhydroxide and calcite. The positive and negative trends of element abundances and temperature and pH, together with negative trend of the hot-spring fluids with volcanic rocks, but plutonic rocks, respectively, suggesting that the fluids are progressively react with the volcanic rocks at elevated temperature. Chlorine has abundances from 70.4 to 688 µg g−1, which is the most dominant element in the hot-spring fluids. The Cl abundance of the hot springs is∼100 and∼44 times higher and lower than that of the surface water and sea water, respectively. The minerals of basement rocks such as amphibole and biotite contain significant Cl abundance, but they are minor minerals in rocks. The relative large Cl abundance of the hot springs can not explained by contribution of Cl from the surface water, sea water, and basement rocks. The positive correlation between Cl and temperature imply that the initial fluids may come from the depth of a hydrothermal reservoir, where Cl is probably derived from magma fluids.
Based on Na-K-Mg diagram, the temperature of hydrothermal reservoir is estimated to be 120- 200◦C, indicating that the hot-spring waters are probably originated from heterogeneous high temper- ature reservoir. Most hot-spring waters fall into the immature fluid and partial equilibrium, suggesting that the interaction of the fluids and with rocks has not been reached to equilibrium yet.
The upper-crust major element normalized patterns for hot springs are characterized by positive spikes of Cl, S, Na, and F and strong negative spike of Mg, which differ from those of seawater, and 2
river water. The negative spikes of Mg is explained by incorporation of Mg into smectite hydroxide during fluid-rock interaction. The upper-crust trace element normalized patterns for hot springs are characterized by negative slopes with positive spikes of Li, Cs, Tl, Pb, and Be, and negative spike of V. The CI-chondrite REE normalized patterns for hot springs and cold springs are characterized by flat patterns to positive slopes, and with negative spikes of Ce and Eu. The positive correlation between elements (Ce and Eu) and elements (Fe and Ca), suggesting that the negative spikes of Ce and Eu are resulted from incorporation onto precipitations of Fe oxyhydroxide and calcite, respectively.
These features differ from those of volcanic and granitic rocks, which are characterized by negative slopes, and with no spikes of Ce and Eu, except for negative Eu spike in granitic rocks. Based on REE features, three groups (I, II, and III) of hot springs were identified. Groups I and II are characterized by higher and lower total REE abundances, in association with higher and lower temperature, respectively, while those of group III is characterized by varied total REE abundances and varied temperature and pH. group III may be a mixture of groups I and II with cold spring fluid.
The Sr-isotopic compositions of Misasa cold and hot springs show lower compared with those of granitic rocks, and fall into those of ranges of volcanic rocks in vicinity area. The Sr isotope trend formed by cold and hot springs suggests the involvement of two end-member components, which are volcanic rocks and cold-spring waters.
Misasa hot springs are uniquely characterized by both Rn-rich and high temperature. The origin of the Rn-rich hot springs can attribute to either (1) Ra-rich in hot-spring waters, (2) Ra-rich in basement rocks (volcanic and granitic rocks), (3) magma degassing, or (4) hidden U ore deposits.
The possibilities coming from Ra-rich in hot springs and basement rocks are eliminated as important sources, because their Ra abundances are too low and small leaching efficiency of Rn from rocks into solution, respectively. The possibility of Rn-rich coming from magma degassing is ruled out, because the half-life of Rn is short (3.82 days), it cannot survive during transportation to surface for long journey from magma chamber, which may be located in great depth. Having eliminated hot-spring waters, basement rocks, and magmatic degassing as important sources, hidden U ore deposits beneath this studied area are the best explained for dominant means of Rn addition into hot springs. The estimated abundances of Ra and U equilibrated with that of Rn found within hot-springs are high enough to generate high Rn into hot-spring waters. The spatial distributions of surface exposure of U deposits associated with well-developed fault system and shear zone are also supported for presence of the hidden U ore deposits in this area and regional vicinity.
Contents
Contents 4
1 GENERAL INTRODUCTION 7
1.1 HOT-SPRING FLUID AND ITS FORMATION AND OCCURRENCE . . . 7
1.2 HOT-SPRING FLUIDS IN MISASA AREA . . . 8
1.3 PROBLEMS OF PREVIOUS STUDIES . . . 9
1.4 OBJECTIVES . . . 10
1.5 PROPOSAL OF NEW APPROACHES . . . 10
2 DEVELOPMENT OF HIGH SENSITIVE ANALYTICAL TECHNIQUE FOR NAT- URAL WATER ANALYSES 12 2.1 INTRODUCTION . . . 12
2.2 EXPERIMENTAL . . . 13
2.2.1 Spike, reagent, and reference solutions . . . 13
2.2.2 Pre-concentration, collection, and spiking . . . 14
2.2.3 Mass spectrometry . . . 14
2.2.4 Performance of freeze-drying pre-concentration . . . 16
2.3 RESULTS AND DISCUSSIONS . . . 16
2.3.1 Optimization for natural-water analyses . . . 16
2.3.2 Recovery yield on freeze-drying pre-concentration . . . 17
2.3.3 Detection limit and blank . . . 17
2.3.4 Analytical precision . . . 18
2.3.5 Reliability . . . 19
2.4 SUMMARY . . . 21
Appendices . . . 44
A Total- and atomic-yield . . . 44
B BaO correction for Eu . . . 44
3 ANALYSES OF HOT-SPRING FLUIDS IN MISASA AREA 48 3.1 INTRODUCTION . . . 48 4
3.2 GEOLOGY SETTING AND SAMPLE DISTRIBUTION . . . 49
3.2.1 Basement geology . . . 49
3.2.2 Evolution of magmatism . . . 49
3.2.3 Sample distribution . . . 49
3.3 ANALYTICAL METHODS . . . 50
3.3.1 Sampling methods for hot-spring fluids . . . 50
3.3.2 Determination of major- and trace-element abundances . . . 51
3.3.3 Determination of Radon abundance . . . 52
3.3.4 Determination of Sr isotopic composition . . . 53
3.4 RESULTS . . . 53
3.4.1 Temperature and pH . . . 53
3.4.2 Major and trace elements . . . 53
3.4.3 Radon . . . 55
3.4.4 Sr isotopic composition . . . 55
3.5 DISCUSSIONS . . . 55
3.5.1 Source of the solutes in hot spring fluids . . . 55
3.5.2 Evaluation of hydrothermal reservoir temperature . . . 58
3.5.3 Rare earth elements in hot-spring fluids . . . 58
3.5.4 Implication for source of Sr from87Sr/86Sr ratio of hot-spring fluids . . . 61
3.5.5 Radon rich in hot-spring fluids . . . 62
3.6 SUMMARY . . . 64
4 ORIGIN OF RADON RICH HOT-SPRING FLUIDS IN MISASA AREA 97 4.1 INTRODUCTION . . . 97
4.2 A COMPREHENSIVE OBSERVATION . . . 98
4.2.1 Tectonic setting . . . 98
4.2.2 Large earthquakes . . . 99
4.2.3 Helium anomaly . . . 99
4.2.4 Surface exposure of U ore deposits . . . 100
4.2.5 Distribution of hot-springs in Misasa and regional vicinity . . . 100
4.3 SOURCES TO GENERATE Rn-RICH IN HOT-SPRING FLUIDS . . . 101
4.3.1 Which sources generate Rn-rich in hot-spring fluids? . . . 101
4.3.2 Hot-spring fluids . . . 102
4.3.3 Plutonic and volcanic rocks . . . 102
4.3.4 Magmatic degassing . . . 103
4.3.5 Hidden U ore deposits . . . 103
4.3.6 Evaluation of potential resource of U ore deposits . . . 105
4.4 HEAT SOURCES OF HOT-SPRING FLUIDS . . . 106
4.4.1 Sources of heat . . . 106
4.4.2 Radioactive heat productions . . . 107
4.4.3 Heat transferring from magma activities . . . 107
4.5 A MODEL OF GENERATION OF Rn-RICH HOT-SPRING FLUID . . . 108
4.6 SUMMARY . . . 109
Appendices . . . 124 A Solution for decay chains . . . 124 B Estimation of abundances of Ra and U . . . 125
5 CONCLUSIONS 126
5.1 OVERVIEW . . . 126 5.2 DEVELOPMENT OF NEW FREEZE-DRYING PRECONCENTRATION TECH-
NIQUE . . . 126 5.3 CHARACTERIZATION OF MISASA HOT-SPRING FLUIDS . . . 127 5.4 U ORE DEPOSIT: SOURCE GENERATING RADON RICH HOT-SPRING FLUIDS 128
Bibliography 131
List of Tables 147
List of Figures 149
6
Chapter 1
GENERAL INTRODUCTION
1.1 HOT-SPRING FLUID AND ITS FORMATION AND OCCURRENCE
Water plays an important role in Earth’s evolution and dynamics, because it has a strong influence on the physical and chemical properties of geological materials. As a mobile phase, water also plays a vital part in transferring mass and energy near the surface and within interior of the Earth. The water flows on the surface and migrates within the underground and it is responsible for mobility and transport of dissolved solid, liquid, and gas, as well as heat to the surface (Ague, 2003). For example, flows of water on the surface and the sub-ground provide the powerful force for shaping the landform such as formation of the Grand Canyon in the past 4 Ma causing by stream channels on Colorado Plateaus eroded the land surface (Karlstrom et al., 2014).
Most water within underground originates from meteoric waters deriving from precipitation (rain and snow), continuously infiltrating and descending into the depth of the geothermal reservoir.
The water migrates within the underground is caused by differences in density related largely to temperature (White and Brannock, 1950). The water comes into contact with or distributes near heat source within geothermal reservoir, it will be heated and forms hydrothermal fluid (Hedenquist and Lowenstern, 1994). As heated, the water becomes highly reactive and tend to be circulated upward to the surface because of convection force under hydrothermal systems. It usually emerges at openings on Earth’s surface such as faults or shear zone. The surface manifestation of hydrothermal circulation is fumaroles or hot-springs. A terminology “hot spring” is defined as a spring that is generated when the fluid within underground of the Earth’s crust is geothermally heated.
In general, hot spring is primarily found in regions of dormant volcanic activity or situated in association with the volcanic belt of the arc (Acharya, 1989; Sugimura and Uyeda, 2013). For example, occurrences of clusters of high temperature hot springs are coincided with Quaternary volcanoes form the lineament along the coastal area in eastern part of Chugoku district, where higher geothermal flow is detected. The heat source for these hot springs are, therefore, naturally related to magma activity within volcanoes, while fluid source is believed to be genetic linked to volcanic source or mixture of groundwater with volcanic fluid (White and Brannock, 1950; Aki and Hirano, 1970; Shinohara et al.,
1993).
A second types of hot-springs is unrelated to active volcanoes and situated in regions of non- detected volcanic activity such as South Korea, Arima (Hyogo) in Japan (Chiba et al., 2015; Lee et al., 2011). These hot springs occur at granitic and Cenozoic volcanic rocks, where the geothermal flow and anomaly of geothermal gradient are detected. The heat source provides for these hot-springs is considered to be linked to heat production, which generated by radioactive elements or post-magma activity (Mawson, 1927; McLennan and Taylor, 1996; Brugger et al., 2005), while the fluid source is believed to be dominated by meteoric waters descending into the depth of geothermal reservoir through rock fracture and pores (White and Brannock, 1950; Bucher et al., 2009; Lee et al., 2011).
Both two types of hot springs have high temperature (normally above the core human body temperature>36.7◦C), and they are highly reactive and convective. The composition of hot spring is highly enriched in dissolved salts, which derived from the continuous interaction of the fluid with the crustal wall rock on flow path to the surface. The composition of hydrothermal fluid can have signatures of the wall rocks (Sheppard, 1986). Different elements have different solubilities which may depend on fluid properties such as temperature, pH, salinity, and acidity, as well as compositions of the wall rocks (Nordstrom et al., 2005). Elements and isotopes of this fluid may, thus, provide important clues linking to sources of fluid and heat, as well as water-rock interaction processes. These resulted into major questions on the subject concerning to the sources of heat, fluid, and dissolved elements.
1.2 HOT-SPRING FLUIDS IN MISASA AREA
Japan has more than 4536 hot springs and many of them are distributed in the western part of Japan (Muraoka et al., 2006). Among them, hot springs in Misasa area are well-known as Rn-rich hot springs, which have been studied for more than 100 years. Many studies have been investigated geochemical characteristics of Misasa hot-spring based on major elements Na, Mg, K, Ca, Cl, HCO3, and SO4and few trace elements such as Fe, As, Ge, Se, and P (Umemoto, 1953; Sugihara, 1960;
Sakanoue, 1960; Matsubaya et al., 1973). Majority of those studies have been mainly focused on interpretation of the origin of Rn rich in hot springs based on analyses of Rn, Ra (Nakai, 1940; Oshima et al., 1954; Horiuchi and Murakami, 1979; Koga et al., 1996; Horiuchi, 1998; Inagaki et al., 2005).
Radon rich in hot-spring fluids are interpreted to be originated from (1) groundwater, (2) plutonic rocks, (3) spring deposit containing Rn lying near the surface.
Horiuchi and Murakami (1979); Moninaga et al. (1984) interpreted that the dissolved Ra in groundwater or from Ra-rich in deeper aquifers is a main source to generate Rn-rich in hot-spring. In contrast, Koga et al. (1996) reported that Rn abundance of groundwater is much lower than that of hot springs. This suggests that groundwater is unlikely source to generate Rn-rich in hot springs. The Rn abundance is 2-3 orders higher than that of equilibrium amount of Ra in groundwater Horiuchi (1998). The dissolved Ra in groundwater or deeper aquifer is therefore not source to generate Rn-rich in hot springs. Oshima et al. (1954); Inagaki et al. (2005) considered that the plutonic rocks contain significant amounts of Ra disintegrating from U, is possible source to generate Rn-rich in hot springs.
Mifune (1981) interpreted that the Rn-rich in hot springs in Misasa is originated from the spring sediment containing Ra lying close to ground surface.
8
None of them have been conducted comprehensive evaluation of characteristics of Misasa hot spring, as well as its sources of fluid and heat yet. Therefore, these studies have been shown their limitation for understanding instinct nature of hot-spring fluids in the form of source of heat and fluid, as well as dissolved elements in the fluid.
1.3 PROBLEMS OF PREVIOUS STUDIES
The most likely problems of previous studies have been attributed for limitation of (1) determina- tion of element abundances and isotopes and (2) lack of information from comprehensive observations.
Many previous studies have been focused on finding sources of Rn-rich in hot-spring fluids based on analyses of Rn and Ra (Nakai, 1940; Oshima et al., 1954; Koga et al., 1996; Horiuchi, 1998; Inagaki et al., 2005). Some have been determined abundances of few major elements such as Na, Mg, K, Ca, Cl, HCO3, and SO4and few trace elements such as Fe, As, Ge, Se, and P (Umemoto, 1953; Sugihara, 1960; Sakanoue, 1960; Matsubaya et al., 1973). Most trace elements in hot-spring fluids have been not determined. This is because of trace elements that present at extremely low abundances down to fg g−1level (e.g., REE). Therefore, the determination of abundances of trace elements is difficult.
To determination of such extremely low abundances of elements, pre-concentration of elements in solution prior to analyses is required.
Many pre-concentration techniques have been proposed such as boiling and sub-boiling evap- oration (Thompson et al., 1982; Gorlach and Boutron, 1990), coprecipitation (Umashankar et al., 2002), solid-phase or liquid-phase extraction (Esser et al., 1994), and freeze drying (Harrison et al., 1975; Stoessel and Prange, 1985). The sub-boiling evaporation technique developed by Boutron and Martin (1979); Gorlach and Boutron (1990) showed advantages of analyses of many elements (32 and 4 elements) and contamination by drying solution at 70◦C, their limitations are low recovery yield and large detection limits, and labour consuming (∼7 days to dry up 70 mL), respectively. The coprecipitation technique presented by Murthy and Ryan (1983); Yabutani et al. (2000); Umashankar et al. (2002) showed to enable to analyses of many elements (4, 11, and 30 elements, respectively) with relative high recovery yields, but large blank from reagents and larger detection limits. The solid-phase or liquid-phase extraction reported by Esser et al. (1994); Batterham et al. (1997); Mackey et al. (1997) showed ability to analyses of multi-elements with large pre-concentration factor, but the technique requires tedious teps for cleaning the ion exchanger, and employs environmentally unsafe and expensive solven and requires large sample volume, as well as labour consuming (Komjarova and Blust, 2006).
In contrast, freeze-drying technique is the only technique that has high recovery yield, low blank, and wide applicability to multi-elements. This technique developed by several previous studies, but they have been taken all advantages of the method. Harrison et al. (1975) showed high recovery yields (95%) by using freeze-drying prior to neutron activation analysis, but lower yields for I (68±21%) and Hg (61±9%), and determined only 22 elements. Stoessel and Prange (1985) demonstrated the applicability of freeze-drying prior to total-reflection X-ray fluorescence for determining elements in rainwater, and showed low detection limit (2–20 ng L−1), but blank is still high for Fe (0.13 µg L−1), Ni (0.08 µg L−1), Cu (<0.03 µg L−1), Zn (0.17 µg L−1), and Ba (0.72 µg L−1), and determined only 20 elements. As a consequence, those studies did not take full advantages of freeze-drying technique.
The lacks of information about geology and geochemistry of basement rocks, as well as geophysics
are secondly problems of previous studies. The genetic links between hot-spring fluids and basement rocks have not been elucidated because of no or little available geochemical data including major- and trace elements, and isotopes of either hot springs or basement rocks. The evidences of sources of heat and Rn-rich for hot springs have not been evaluated by previous studies yet, because no combination among geochemistry, geothermal gradient, geothermal flow, and geophysics are made.
1.4 OBJECTIVES
This study is firstly aimed to characterize hot-spring fluids based on comprehensive geochemical analyses including element and isotopic data of hot-spring fluids in Misasa area, Tottori prefecture, Japan. Secondly, the genetic links of hot-spring fluids to basement geology is elucidated by comparison of element and isotopic ratios of the hot-spring fluids with the surrounding rocks. Thirdly, the source to generate Rn-rich in Misasa hot-spring fluids is interpreted based on comprehensive observations including geochemical data, geology, and geophysics. The last goal is followed the third objective to reveal the sources of heat for various types of hot-spring fluids.
1.5 PROPOSAL OF NEW APPROACHES
In order to determine elements of natural water, FDC-ID-IS technique is a combination of freeze- drying pre-concentration (FDC) with isotope dilution internal standardization (ID-IS), has been developed. The FDC-ID-IS technique allow determination of 52 elements of natural waters with abundances ranging from µg g−1down to fg g−1level. On the other hand, other major elements such as F, Cl, Br, N, and S and radioactive gas elements of Rn, together with Sr isotopes are determined.
Besides evidences of geochemistry obtained by this study, those of another information have been appeared on literature are collected in order to have comprehensive insights into the instinct nature of hot-spring fluids. Basement geology of area where hot springs located, may help to understand fluid-rock interaction and genetic links to composition of the wall rock that hot-spring fluid passing through or reacting with. In the areas where basement rocks have high porosity and permeability are usually associated with locations of fractures, faults, shear zone, which are favorable channels for transportation of fluids and gases in the ground within Earth’s crust. The fact that occurrences of hot springs and hydrothermal deposits are structurally controlled (Nakamura et al., 1969; Sasada et al., 1987; Harper, 1978; Pedersen et al., 1980; Kislyakov and Shumilin, 1996).
In the non-volcanic activity region, occurrences of hot-springs are associated with anomalies of high geothermal gradients and flows. The heat source caused the anomalies of high geothermal gradients and flows could be attributed for (1) energy generated by disintegration of radioactive elements of basement rocks, (2) post-magma activity, and (3) friction due to movement of two blocks of rocks on faults (White and Brannock, 1950). Therefore, determination of heat source may help understanding mechanism of circulation and transportation of fluids within hydrothermal system.
In the active regions with occurrence of many large Earthquakes may help identifying signatures of hidden active faults or presence of magma chamber in the deeper depth. The ascent of magmatic fluids, together with transferring heat into the surrounding rocks by magma activity is resulted into low seismic velocity and high Poisson ratio (Christensen and Mooney, 1995; Zhao et al., 2018). The 10
high He anomaly detected in hot springs or along faults and shear zones may be signatures to support for contribution of mantle-delivered helium from magma source.
The surface expose of hydrothermal deposits such as U deposit associated with the occurrence of hot springs and fault systems, can provide important clues for seeking hidden hydrothermal ore deposits. In addition, Rn-rich in hot-spring fluids can be used as tool for exploration of the hidden U deposits in the depth. A combination of occurrence of Rn-rich in hot-spring fluids with the surface exposure of U deposit, together with distribution of fault systems and shear zone will help understanding mechanism of hydrothermal fluid activity, as well as relationship between Rn and U in hydrothermal systems.
Chapter 2
DEVELOPMENT OF HIGH SENSITIVE ANALYTICAL
TECHNIQUE FOR NATURAL WATER ANALYSES
2.1 INTRODUCTION
Chemical characteristics of natural fluids such as hot-spring water and ground water is consequence of interaction between fluid and solid on the surface and crust of Earth (Shevenell and Goff, 1993; Lee et al., 2011). Element abundances in the fluids provide physiochemical characteristics of system, and origin and evolution of the surface and crust of the Earth. Determination of element abundances of the hydrothermal fluid is, however, difficult because of small quantities of elements in it, as down to fg g−1 level (Kalacheva et al., 2015). To determine element abundances of such natural water, concentration of elements in solutions prior to analyses (pre-concentration) have been proposed.
A few pre-concentration techniques have been developed; those include sub-boiling evaporation (Gorlach and Boutron, 1990), coprecipitation (Umashankar et al., 2002), solid-phase or liquid-phase extraction (Esser et al., 1994), and freeze drying (Harrison et al., 1975; Stoessel and Prange, 1985).
Pre-concentration using freeze drying has advantages in good recovery yield and low procedural blank, thus it has been applied to analyses of natural water combined with instrumental neutron activation (INAA; Ndiokwere, 1982), atomic absorption spectrometry (AAS; Hall and Godinho, 1980), and total-reflection X-ray fluorescence (TXRF; Stoessel and Prange, 1985). However, number of elements to be determined was limited by analyses following the pre-concentration.
To determine abundances of 52 elements of natural water with pre-concentrations down to fg g−1 level precisely, a FDC-ID-IS method that is combination of freeze-drying pre-concentration (FDC) and isotope dilution internal standardization (ID-IS) has been developed. Recovery yields on FDC 12
were estimated by analyses of reference solutions with and without FDC. Ranges of acidity without hydrolysis of cations and ranges of major-element concentrations without matrix-effected signal suppression on mass spectrometry were examined. To determine Eu accurately, contribution of
135BaO+interference on151Eu+ spectrum and uncertainty on determination of Eu were estimated. To demonstrate performance of FDC-ID-IS method, river water SLRS5 and drinking waters from seven geological sources were analyzed.
2.2 EXPERIMENTAL
2.2.1 Spike, reagent, and reference solutions
Reagents H2O, HClO4, HCl, HF, and HNO3were prepared following Moriguti et al. (2004). Four spiked solutions149Sm,10B,91Zr-179Hf, and97Mo-119Sn-121Sb were prepared following Makishima and Nakamura (2006), Makishima et al. (1997), Makishima et al. (1999), and Lu et al. (2007), respectively. To estimate recovery yields of elements on FDC, tworeference solutions X1 and X2 were prepared. To find conditions that are free from hydrolysis and matrix-effected suppression, two reference solutions TE and MEwere prepared. Four reference solutions are detailed as below.
Reference solutions X1 and X2: To determine element abundances by mass spectrometry, elements in solution must be in form of soluble ions or stable complexes. Elements Li, Be, Na, Mg, Al, P, K, Ca, Sc, V, Mn, Fe, Ni, Co, Cu, Zn, Ga, Rb, Sr, Y, Cd, In, Cs, Ba, REE, Tl, Pb, Bi, Th, and U (groupIelements) form soluble ions in HNO3and elements B, Ti, Zr, Nb, Mo, Sb, Sn, Hf, and Ta (groupIIelements) form soluble oxo- and fluoro-complexes in HF (Nagender Nath et al., 2009). Two batches of silicate rocks (JB3, Geological Survey, Japan) were decomposed, dried, redissolved, and diluted to have two reference solutions. The silicate rock was decomposed, step-wisely dried, and redissolved following Yokoyama et al. (1999) and Makishima and Nakamura (2006), then diluted by 0.5 mol L−1HNO3to have a solution with dilution factor of 1000, which was referred asreference solution X1. To demonstrate performance of Ba oxide correction, a solution of Ba (Wako pure chemical industries, Ltd, Japan) was mixed toreference solution X1to have a series of solutions that varied in Ba/Eu ratio from 182 to 5×10⁵. The silicate rock was also decomposed, dried, and redissolved following Lu et al. (2007), then diluted by 0.5 mol L−1HF to have a solution with dilution factor of 1000, which was referred asreference solution X2. To suppress evaporation of B during decomposition (Ishikawa and Nakamura, 1990), mannitol solution (Nakamura et al., 1992) was dropped on the silicate rock before decomposition.Reference solutions ME and TE:To find ranges of acidity without hydrolysis and range of major-element concentrations without matrix-effected signal suppression, two reference solutions were prepared.Reference solution MEincludes Na, Mg, Al, K, Ca, V, Mn, Fe, Co, Ni, Cu, Zn, Ga, and Sr, and was created by dilution of a multi-element calibration standard 2A (Agilent Technologies, USA) by 0.5 mol L−1HNO3.Reference solution TE includes Li, Rb, Sr, Y, Cs, Ba, REE, Pb, Th, and U, and was created by dilution of a mixture of a
“PM solution” (Makishima and Nakamura, 1997), Li solution (Kanto Chemical Co, Japan) and Pb solution (Kanto Chemical Co, Japan) by 0.5 mol L−1HNO3.Reference solution TEwas mixed with 16 mol L−1HNO3, and diluted by H2O to have a series of solutions that varied in concentrations of HNO3from 0.1 to 1.0 mol L−1.Reference solutions ME and TEwere mixed with a NaCl solution to have a series of solutions that varied in concentrations of NaCl from 0 to 0.6 cg g−1and from 0 to
2 cg g−1, respectively. The NaCl solution was created by dissolving NaCl solid (Merck KGaA 64271 Darmstadt, Germany) by 0.5 mol L−1HNO3.
2.2.2 Pre-concentration, collection, and spiking
Sample solutions (100−125 mL with 0.05 mol L−1HNO3) were loaded in two polypropylene bottles (125 mL bottle, Thermal Scientific, USA) for groupIandIIelements. The sample solutions were frozen at 105Pa and−70◦C for 8 hours in a freezer MDF-C8V1 (Sanyo Electric, Japan). Then the solids were dried at 2 Pa and−60◦C for 45 hours in a dryer DC800 (Yamato Scientific, Japan). By sublimation of H2O, a volume of the sample was reduced by<1/50. The solids were then thawed at room temperature. Following freeze-drying pre-concentration (FDC), the sample was collected, digested, dried, and redissolved differently (see Figure 2.1).
After FDC, the sample for groupIelements was transferred into a Teflon beaker (7 mL beaker, Savillex). To collect remnant elements that may stay on the wall, additional procedures were repeated twice: (1) Solutions of 6 mol L−1 HCl (1.5 mL) and 30 mol L−1HF (0.15 mL) were dropped on to the 125 mL bottle. (2) The 125 mL bottle was vigorously shaked. (3) The solution in the bottle was transferred into the 7 mL beaker. The sample solution was mixed with 7 mol L−1HClO4(0.5 mL) and 30 mol L−1HF (0.3 mL), and agitated in a ultrasonic bath at 70◦C for 8 hours, and dried following Yokoyama et al. (1999). The residue after drying was redissolved by 0.5 mol L−1HNO3to be sample solution of 0.7−2 mL. The sample solution was agitated in the ultrasonic bath at 70◦C for 1 hour.
After FDC, the sample solution for groupIIelements was transferred into a polypropylene beaker (8 mL beaker, Thermal Scientific). To collect remnant elements that may stay on the wall, additional procedures were repeated twice: (1) Solutions by of 0.1% mannitol (0.12 mL) and 10 mol L−1HF (1.2 mL) were dropped on to the 125 mL bottle. (2) The 125 mL bottle were vigorously shaked. (3) The solution in the bottle was transferred into the 8 mL beaker. To suppress coprecipitation of group IIelements with Ca-Al fluorides, Al-solution (Alfa Aesar, USA) was mixed to the sample solution to make Al/(Al+Ca) ratio be≥0.9 (Tanaka et al., 2003; Lu et al., 2007). The sample solution was agitated in the ultrasonic bath at 70◦C for 8 hours, and dried at 70◦C following Lu et al. (2007).
The residue after drying was redissolved by 0.5 mol L−1HF to be sample solution of 0.7−2 mL. The sample solution was agitated in the ultrasonic bath for 1 hour. To determine element abundances using the ID-IS, the optimum amount of spiked solutions (spiked solution149Sm for groupIelements and spiked solutions10B,91Zr-179Hf, and97Mo-119Sn-121Sb for groupIIelements) were mixed to the sample solutions. Before addition of the spike solutions, element abundances of sample solutions were determined by intensities of ion signal semi-quantitatively consuming quantity of 0.3 mL. The sample solutions were agitated in the ultrasonic bath at 70◦C for 30 minutes after addition of the spiked solutions. Supernatant of the sample solutions was analyzed by mass spectrometry. We define pre-concentration factorCas relative quantity of the sample solution before FDC to that fed into mass spectrometry. The sample solution that fed into mass spectrometry is withC=50−185.
2.2.3 Mass spectrometry
Abundances of 52 elements were determined by six acquisitions using mass spectrometry. Abundances of groupIelements were determined by four acquisitionsIa(for Li, Be, Rb, Sr, Y, Cs, Ba, REE, Pb, Th, and U),Ib(for Cd, In, Tl, and Bi),Ic(for Na, Mg, Al, P, Ca, V, Mn, Fe, Co, and Sr), and 14
Id(for K, Sc, Ni, Cu, Zn, Ga, and Sr). Abundances of groupIIelements were determined by two acquisitionsIIa(for B, Zr, Nb, Mo, Sn, Sb, Hf, and Ta) andIIb(for Ti). AcquisitionsIa,Ib, and IIa, and acquisitionsIcandIdwere conducted by ICP-QMS Agilent 7500cs (Yokogawa Analytical Systems, Japan; Makishima and Nakamura, 2006; Makishima et al., 2011; Lu et al., 2007) and ICP-SFMS Element-XR (Thermo Scientific, Germany; Makishima and Nakamura, 2006; Lu et al., 2007), respectively. To minimize overestimation of element abundances resulted from interferences, high-mass-resolution technique was applied for acquisitionsIc,Id, andIIbwith M/∆M 4000, 10000, and 4000, respectively, and oxide-correction technique was applied for acquisitionsIaandIb. To estimate contributions of 95MoO+ and135BaO+ interference on111Cd+ and 151Eu+ spectra, Mo solution without Cd (1 µg g−1; Makishima et al., 2011) and Ba solution without Eu (1 µg g−1) were analyzed periodically. The analytical conditions are detailed in Table 2.1 and 2.2. Total yields and atomic yields on mass spectrometry are shown in Appendix A.
Elements with ionic potential (IP≡charge/radius ratio)>30 nm−1strongly bond with O2− in water and therefore form stable oxyhydroxides or aquocomplexes, which tend to turn into minerals (Railsback, 2003). Existence of hydrolysis in solution results in inhomogeneous distribution of cations (e.g., Milkey, 1954) and consequently, delivery rate of elements to mass spectrometry would be biased. Elements such as Pb, Th, and U are not hydrolyzed with pH<0.3 (e.g., Nagender Nath et al., 2009) but hydrolyzed with pH>4.2,>3.7, and>5.6 (e.g., Milkey, 1954). Natural water was stored with the acidity of pH 1.3 without evaluation on hydrolysis of cations (0.05 mol L−1HNO3; Batley and Gardner, 1977). To find out minimum acidity that are without hydrolysis of cations,reference solutions TEthat varied in concentrations of HNO3 from 0.1 to 1.0 mol L−1, were analyzed as if sample. Ion signals of Li, Be, Rb, Sr, Y, Cs, Ba, REE, Pb, Th, and U were surveyed.
Matrix-effected signal suppression is a phenomenon for which target ions of element is suppressed by abundant ions of major element on mass spectrometry. Natural waters (hot-spring water, river water, and sea water) are with abundant major elements such as Na and Cl up to µg g−1level. By FDC, not only trace elements but also the major elements were concentrated. To find maximum major-element concentrations without matrix-effected signal suppression,reference solutions ME and TEthat varied in concentrations of NaCl from 0 to 0.6 cg g−1and from 0 to 2 cg g−1, respectively, were analyzed as if sample. Ion signals of elements Na, Mg, Al, K, Ca, V, Mn, Fe, Co, Ni, Cu, Zn, Ga, and Sr and elements Li, Be, Rb, Sr, Y, Cs, Ba, REE, Pb, Th, and U were surveyed.
Contribution of 135BaO+ interference on 151Eu+ spectrum becomes significant when Ba/Eu ratio is >103 such as hot-spring water and river water (Chiba et al., 2015; Aries et al., 2000).
Aliaga-Campuzano et al. (2013) tried to suppress generation of BaO using Apex-Spiro system that was a combination of high-efficiency-sample-introduction system and membrane-desolvator system.
However, when Ba/Eu ratio is >4×10⁴, an aperture on sample-introduction cone was partially closed by deposit of salts and memory effects derived from the membrane-desolvator system became significant. Chiba et al. (2015) estimated contribution of BaO+ interference on Eu+ spectrum by analysis of Ba solution, without showing uncertainty. We determine [Eu] accurately and estimated uncertainty propagated from uncertainties on intensity151I, intensity137I, and Ba oxide-to-atomic- yieldΘBaO+/Ba+. The uncertainty is detailed in Appendix B. To demonstrate the performance in[Eu]
determination,reference solutions X1that varied in Ba/Eu ratio from 182 to 5×10⁵, were analyzed as if sample.
2.2.4 Performance of freeze-drying pre-concentration
Recovery yield, that is habitability of elements on FDC, was examined.Reference solutions X1 and X2 were diluted 50 times by H2O, then concentrated back by FDC.Reference solutions X1 and X2with and without FDC were analyzed as if sample. To demonstrate applicability of the method, reference river water SLRS5 of Ottawa (National Research Council Canada, Canada) was analyzed with and without FDC, and drinking waters from seven geological sources were analyzed.
2.3 RESULTS AND DISCUSSIONS
2.3.1 Optimization for natural-water analyses
Range of concentration of HNO3without hydrolysis was examined by analyses of a series ofreference solutions TEthat varied in concentrations of HNO3from 0.1 to 1.0 mol L−1. Existence of hydrolysis was detected as a deficit of ion signal relative to that of 0.5 mol L−1HNO3. The deficit as a function of concentration of HNO3is shown in Figure 2.2. The deficit due to hydrolysis of elements except for Th, was≤10% on the whole range. That of Th was≤10% when concentration of HNO3 was
≥0.3 mol L−1but>10% when concentration of HNO3was<0.3 mol L−1. To have accuracy better than 10%, solution fed into mass spectrometry should be with concentration of HNO3≥0.3 mol L−1.
Range of concentration of major element without matrix-effected signal suppression was examined by analyses of a series ofreference solutions ME and TEthat varied in concentrations of NaCl from 0 to 0.6 cg g−1and from 0 to 2.0 cg g−1, respectively. Existence of matrix-effected signal suppression was detected as deficit of ion signal relative to that without NaCl. The deficit as a function of concentrations of NaCl is shown in Figure 2.3.The deficit of Fe was≤10% when concentrations of NaCl was≤0.1 cg g−1. Those of Cu, Ga and Mn were≤10% when concentrations of NaCl were
≤0.17 cg g−1,≤0.22 cg g−1, and≤0.24 cg g−1, respectively. The deficit of four elements increases with increment of concentrations of NaCl and those were>25% when concentrations of NaCl were 0.6 cg g−1(see Figure 2.3a). The deficit of U was≤10% when concentration of NaCl was≤0.2 cg g−1. Those of Ce, Sr, and Li were≤10% when concentrations of NaCl were≤0.4 cg g−1,≤0.53 cg g−1, and≤0.7 cg g−1, respectively. The deficits of the four elements increase as increment of concentrations of NaCl, and those become>50% when concentrations of NaCl were>2 cg g−1(see Figure 2.3b).
Maximum concentrations of NaCl with matrix-effected signal suppression of≤10% for elements analyzed by ICP-SFMS and elements analyzed by ICP-QMS were ≤0.1 cg g−1 and ≤0.2 cg g−1, respectively. Matrix-effected signal suppression is loss of ions during flight on mass spectrometer because of a space-charge competition by abundant major ions (Olivares and Houk, 1986). Because of double focusing, ion space-density is larger in ICP-SFMS than in ICP-QMS. We conclude that to have accuracy better than 10%, solution fed into ICP-SFMS and ICP-QMS should be with concentrations of NaCl≤0.1 cg g−1and≤0.2 cg g−1, respectively.
To estimate abundance of Eu precisely, ΘBaO+/Ba+ was estimated from 151I/135I ratio, that corresponds to I135BaO+/I135Ba+ ratio, on analysis of the Ba solution (without Eu). The mean and variation (1σ) ofΘBaO+/Ba+among eleven sessions were 2.48×10⁻³and 4%, respectively.Reference solutions X1that varied in Ba/Eu ratio from 182 to 5×10⁵were analyzed to confirm accuracy that defined as a deviation of Eu relative to that ofreference solution X1with Ba/Eu ratio 182. The 16
deviation of Eu as a function of Ba/Eu ratio was shown in Figure 2.4. It was shown that when Ba/Eu ratio was<5×10⁴, Eu can be determined with uncertainty<10%.
2.3.2 Recovery yield on freeze-drying pre-concentration
Recovery yields on FDC were estimated by analyses ofreference solutions X1 and X2determined with and without FDC. The recovery yields for 52 elements was 96.8−106% and shown in Table 2.3 and Figure 2.5.
The recovery yields of K, Al, Cu, Mo, Sb, Cd, V, Cd, Ce, and Eu by previous studies (Lieser et al., 1977; Hall and Godinho, 1980; Grotti et al., 2008) are either lower or higher than ideal collection.
Recovery yields by Lieser et al. (1977), Hall and Godinho (1980), and Grotti et al. (2008) are 86%, 89%, 130%, 155%, 121%, and 136% for Mo, Sb, K, Cd, Ce, and Eu, 90%, 109% and 114% for Cd, Al, and Cu, and 81% and 112% for V and Co, respectively. Lower or higher recovery yields were probably due to incomplete collection of elements during sample transfer after FDC or due to contamination from impurity of quartz tubes on non-destructive neutron activation (Lieser and Neitzert, 1976; Lieser et al., 1977) and flasks (Hall and Godinho, 1980). The recovery yields of those elements (K, Al, Cu, Mo, Sb, Cd, V, Ce, and Eu) on this study were 100−104%, which demonstrate that elements were completely collected and contamination from apparatus was not significant. Using the new FDC-ID-IS method, isotope composition of elements in solutions could be determined without fractionation.
2.3.3 Detection limit and blank
Detection limit is defined as variation (3σ) of mean ion signals of 10 acquisitions of 0.5 mol L−1 HNO3and 0.5 mol L−1HF, and typically expressed in unit of counts per second. Using atomic yield, isotope ratio, andC, the detection limit was converted into a sample detection-limit that corresponds to a minimum concentration of sample solution. AsCgets larger, the sample detection-limit becomes smaller. The sample detection-limits byC=50 were shown in Table 2.4. The sample detection-limits were≤10 pg g−1, 100 pg g−1, 89 pg g−1, and 16 pg g−1for 49 elements, Na, K, and Ca, respectively.
Since abundances of Na, K, and Ca of natural waters such as river water SLRS5 are at fg g−1 level, sample detection-limits of these elements are about 6 orders of magnitudes smaller than their abundances in the sample. Therefore, relative large sample detection-limits of Na, K, and Ca are small enough to determine their abundances in the sample. By FDC-ID-IS method, element abundances down to fg g−1level can be determined.
Blank is defined as quantity of elements coming from reagents, spiked solutions, containers, and environments. To determine blank, two empty PP bottles (125 ml) were prepared for groupsIandII elements, and chain of operations were conducted including FDC operation as if with sample solution.
Estimated blanks were shown Table 2.4. The blanks were ≤10 pg, 10 pg−1 ng, and>1 ng for 32, 9, and 11 elements, respectively. Those of the 11 elements Na, Mg, Al, P, Ca, Mn, Fe, Co, Ni, Cu, and Zn were 1.6, 10, 12, 34, 14, 13, 7.5, 1.2, 1.4, 1.4 and 6.9 ng, respectively and, those were from impurity of HClO4, mannitol solution, and Al solution. When the relative contribution of blank to the sample was≥1%, a blank correction was applied. When the relative contribution of the blank was
>50%, the acquisition was not considered.
2.3.4 Analytical precision
The reference river water SLRS5 were analyzed without FDC. It was also analyzed with FDC (C=50), although on acquisitionsIc,IdandIIb, sample solutions were diluted toC≤1 to avoid matrix-effected signal suppression. Analytical precision was calculated by a standard deviation of quadruplicate analyses. The results are shown in Table 2.5.
Analytical precisions of analyses without FDC were≤10% and>10% for 41 and 9 elements, respectively. Those for 9 elements Ga, Zr, Nb, Cd, In, Sn, Eu, Lu, and Hf were 15, 29, 27, 22, 20, 37, 13, 22, and 35%, respectively, and were dominated by sample detection-limits relative to the element abundances (19, 24, 129, 8, 23, 87, 12, 15, and 262%). Analytical precisions of analyses with FDC were≤10% and 21% for 51 elements and Sn, respectively. That for Sn was relatively large because of significant contribution of blank (35%). Analytical precisions of analyses with FDC relative to those without FDC were 1.5−72 times better for 34 trace elements (determined by acquisitionsIa,Ib, andIIa) except for U, and 0.6−3.5 times better for 16 major- and transition-elements (determined by acquisitionsIcandId, andIIb).
Abundances of elements of SLRS5 using ICP-MS determined without FDC were compiled by Yeghicheyan et al. (2013). Notes that the data by Yeghicheyan et al. (2013) is consistent with those of certified values that are also shown in Table 2.5. For direct comparison, element abundances determined using ICP-QMS by SARM (for Li, Be, Rb, Sr, Y, Mo, Cd, Sb, Cs, Ba, REE, Tl, Pb, Bi, Th, and U), using ICP-SFMS by LEGOS (for B, Na, Mg, Al, P, K, Ca, Ti, V, Mn, Fe, Co, Ni, Cu, Zn, and Nb), using ICP-SFMS by LGE-LISA (for Sc and Sn), using ICP-QMS by Geoscience Montpellier (for Zr), and using ICP-QMS by EPOC (for Ga), were selected from Yeghicheyan et al. (2013) and shown on Table 2.5. Abbreviations of SARM, LEGOS, LGE-LISA, and EPOC denote as the Service d’Analyse des Roches et des Mineraux of Nancy, the Laboratoire d’Etudes en Geeophysique et Oceanographie Spatiales of Toulouse, the Laboratoire de Geochimie des Eaux of Paris and the Laboratoire Interuniversitaire des Systemes Atmospheriques of Paris, and the Laboratoire d’Environnements et Paleoenvironnements Oceaniques et Continentaux of Bordeaux, respectively.
Analytical precisions of analyses with FDC on this study relative to those values from Yeghicheyan et al. (2013) were 1.7−31 times better for 32 trace elements, except for Sn, and 0.3−4 times better for 16 major- and transition-elements.
Analytical precisions of analyses with FDC on this study were better than those without FDC (this study; Yeghicheyan et al., 2013) for trace elements because of improvement in counting statistics resulted from significant increment in ion signal. For major- and transition-elements, analytical precisions of analyses with FDC on this study were similar to those without FDC (this study; Yeghicheyan et al., 2013) because the pre-concentrated solutions were diluted to avoid the matrix effect. I have demonstrated ideal recovery yields, detection limits down to sub-pg g−1, blanks, no hydrolysis, no matrix-effect signal suppression, Mo- and Ba-oxides correction, and reproducibility, and infer abundances of 52 elements of the river water SLRS5 determined by this study is the most precise ones.
In order to evaluate the analytical results using the reference river water SLRS5, the analyses of without FDC (this study; Yeghicheyan et al., 2013) were compared with those with FDC, and shown in Figure 2.6b. Analyses without FDC (this study; Yeghicheyan et al., 2013) for all elements but 3 elements (P, Ga, and Sn) were consistent within 10% or over-wrapped with analytical precisions. Those 18
for P, Ga, and Sn were off by 40%,≤10%, and≤10% for this study, and off by 13%, 68%, and 43% for Yeghicheyan et al. (2013). The relatively large deviation for P was due to difficulty in wet chemistry measurement and its low ionization efficiency (Makishima and Nakamura, 2006). The relatively large deviation of Ga by Yeghicheyan et al. (2013) was probably resulted from interferences of sulfur because of lack of sufficient mass resolution on mass spectrometry (May and Wiedmeyer, 1998).
Abundances of Sn determined by analyses with or without FDC by this study are consistent but they are inconsistent with Yeghicheyan et al. (2013). Abundance of Sn determined with FDC is consistent with that without FDC, suggesting that the blank is properly correct in this study. Since abundance of Sn is reported by only one laboratory in Yeghicheyan et al. (2013), the inconsistency of Sn should further be evaluated We also compared of the values by FDC-ID-IS relative to those complied from 10 laboratories by Yeghicheyan et al. (2013), using schemes of measurement comparison (13528, 2005), and the values of all elements are consistent with considering uncertainty, except for P and Sn.
I also note that the Enscores defined by Equation 7 in Yeghicheyan et al. (2013) of this study with FDC-ID-IS relative to the compiled values from 10 laboratories by Yeghicheyan et al. (2013) for all elements but P and Sn are less than 1.
Abundances of REE of the reference river water SLRS5 determined by the FDC-ID-IS, Yeghicheyan et al. (2013), and Heimburger et al. (2013) were normalized (n) by those of CI chondrite (Anders and Grevesse, 1989) and shown in Figure 2.7. The patterns show LREE enrichment ([La/Lu]n=13) with negative anomalies of Ce (Ce/Ce∗=Cen/[Lan×Prn]0.5=0.60) and Eu (Eu/Eu∗=Eun/[Smn×Gdn]0.5=0.63), and they are identical when analytical precisions are considered. Abundances of heavy REE (HREE) determined by Heimburger et al. (2013) tend to be lower (3-19%) than those by this study and by Yeghicheyan et al. (2013), although the difference has small impact on geochemical discussion for natural waters.
2.3.5 Reliability
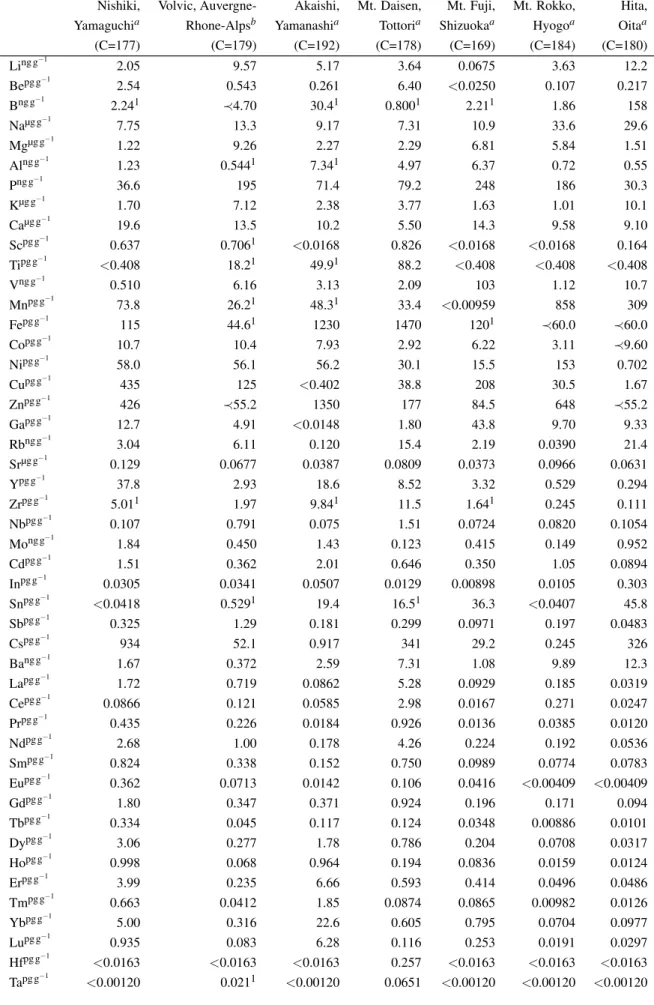
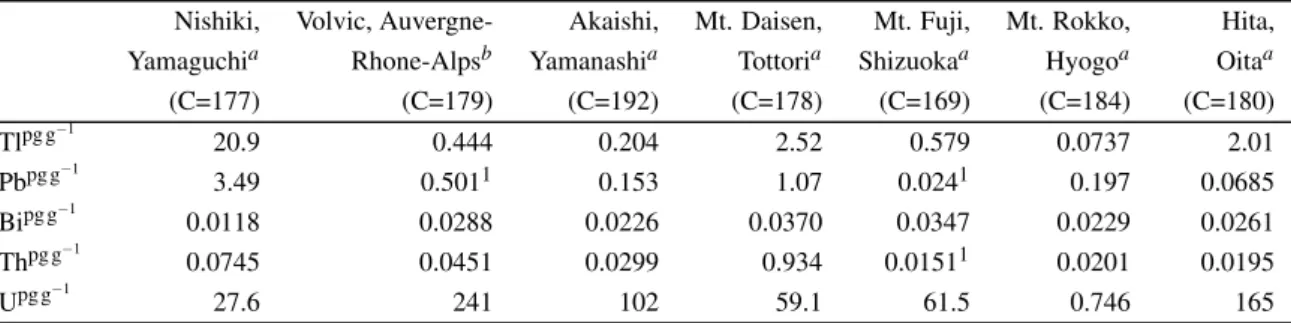
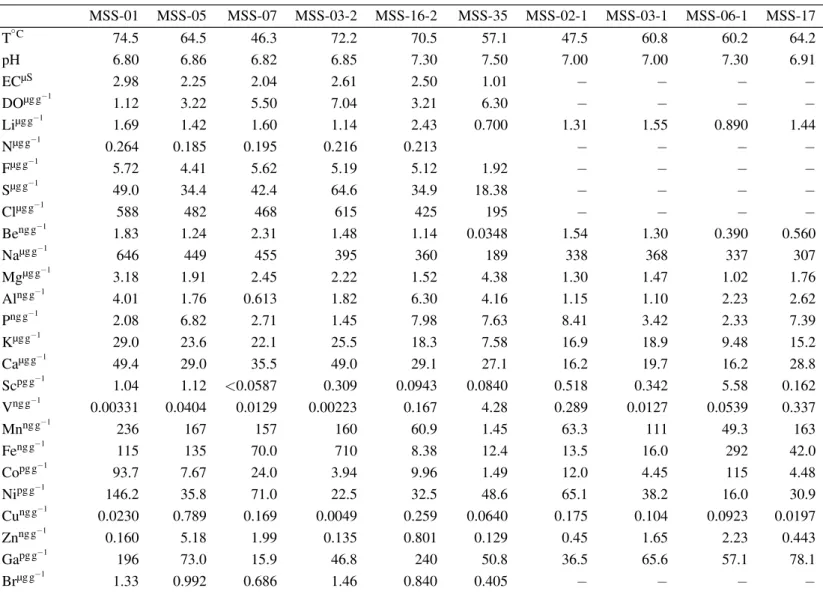
To demonstrate capability and applicability of FDC-ID-IS method, commercially available drinking waters filled in PET bottles taken from seven geological setting were analyzed as examples of natural water analyses. They are from foothills of Holocene young basaltic volcanoes (Mt. Fuji, Shizuoka prefecture, Japan and Volvic, Auvergne-Rhone-Alpes, France), foothills of young andesite-dacite volcano (Mt. Daisen, Tottori prefecture, Japan), terrains of Tertiary granitic rock (Akaishi Mountains, Yamanashi prefecture, Japan), Permian meta-sedimentary rock (Nishiki, Yamaguchi prefecture, Japan), terrains of late Cretaceous granitic rocks (Rokko, Kobe prefecture, Japan), and foothills of late Miocene to Holocene andesite (Hita, Oita prefecture, Japan). The drinking waters were pre-concentrated by reducing the weight of drinking waters from∼125 g to∼0.7 g, resulting into pre-concentration factor C∼180. Elements determined by acquisitions Ia (Li, Be, Rb, Sr, Y, Cs, Ba, REE, Pb, Th, and U), Ib (Cd, In, Tl, and Bi), and IIa (B, Zr, Nb, Mo, Sn, Sb, Hf, and Ta) were determined withC∼180, while elements determined by acquisitions Ic (Na, Mg, Al, P, Ca, V, Mn, Fe, Co, and Sr), and Id (K, Sc, Ni, Cu, Zn, Ga, and Sr), and IIb (Ti) were determined withC<1 after re-dilution to avoid matrix-effected signal suppression. The analyses of seven drinking waters were duplicated, and their element abundances were shown in Table 2.6.
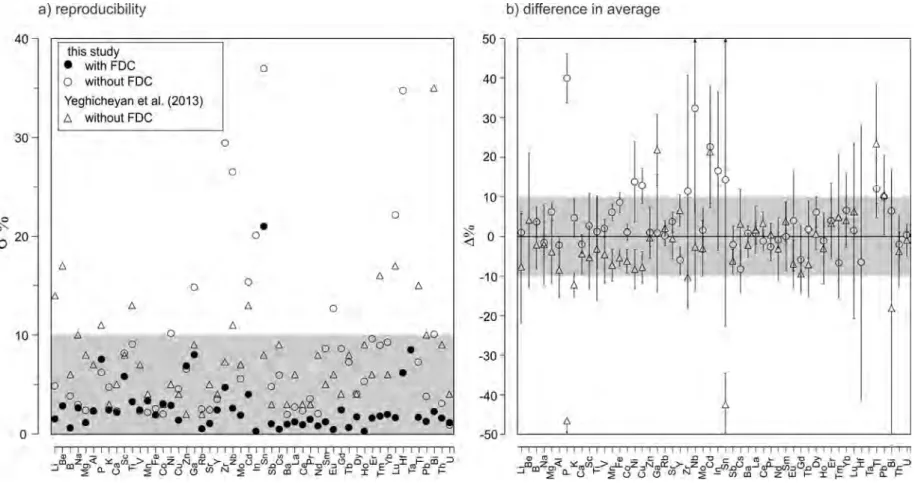
To evaluate reliability on acquisitions by FDC-ID-IS for unknown-water samples by FDC-ID-IS, relative differences among duplicated acquisitions are plotted as a function of abundances of 52
elements, and shown in Figure 2.8. Among 364 acquisitions, 78%, 12%, and 10% of total acquisitions are with relative differences of <10%, 10−20%, and >20%, respectively. Among acquisitions with relative differences >10%, 50 elements corresponding to 14% of total acquisitions are with concentrations of≤pg g−1 level. The difference may be caused by over-spiking and low intensity signals with accidental noise during acquisitions. In addition, tiny suspended particles (such as colloid, clays, and zircons which are enriched in specific elements) could have passed through membrane filter during filtration of natural waters (Sholkovitz, 1992; Elderfield et al., 1990; Nozaki et al., 2000). If this is the case addition of small amounts of acid such as HNO3and HF to the mother PET bottle before taking aliquots for FDC will dissolve the tiny particles to make solution homogeneous, resulting in highly reproducible analyses. It is noteworthy that 80% of the duplicate analyses are<10% deviation among duplicates irrespective of elements and concentrations, which range from several tens of µg g−1 down to fg g−1level indicating that the FDC-ID-IS method is a powerful tool for the comprehensive trace element analyses of fluids with extremely low element abundances.
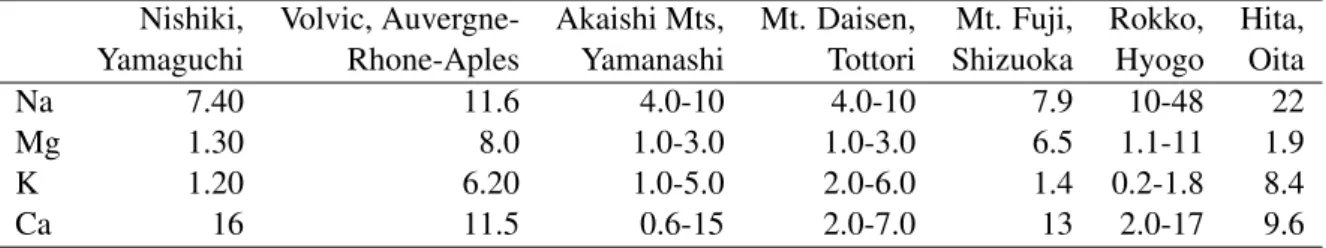
Abundances of major elements (Na, Mg, K and Ca) are consistent with those on the labels (see Tables 2.6 and 2.6). Labels for waters from Mt. Daisen and Akaishi Mountains infer that abundances of major elements on them are with variations of ±50% and our data are included in the range.
Such large variations are probably resulted from weather (rainy and dry seasons), time, and space of collection. The results also suggest that determination of abundances of major elements are accurate enough even though the water samples were diluted to C<1 after pre-concentration ofC∼180.
Element abundances of waters range by nine orders of magnitudes from fg g−1 (e.g., REE) to µg g−1level (e.g., Na). Abundances of 52 elements were normalized to those of upper continental crust as function of solubility of elements estimated from partition coefficient between seawater and upper-crust (Taylor and McLennan, 1985; Rudnick and Gao, 2003; Li et al., 2011), and shown in Figure 2.9. Element patterns tend to show negative slopes (Nan/Fen=7.2×103−434×103) with positive and negative spikes of Mo, Sb, P, V, Sn, In, Be, Co, and Ga, and Cd, Eu, Pb, La, Ce, Th, and Fe, respectively. Depending on the samples, elements such as Be, Sc, Ti, Zn, Ga, Hf, and Ta are below sample detection limit even beingC∼180. If further pre-concentration with FDC until exceeding the detection limits and blank corrections being properly carried out, these extremely low element abundances must be able to be determined.
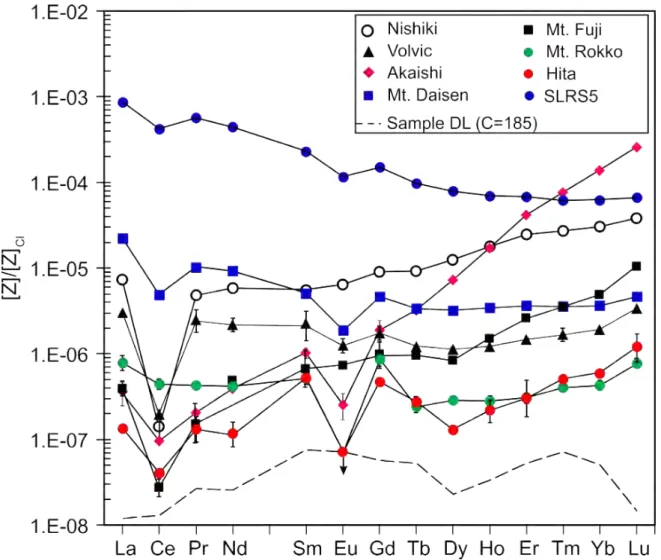
Abundances of REE of drinking waters were normalized to those of CI chondrite (Anders and Grevesse, 1989) and shown together with the reference river water SLRS5 in Figure 2.10. Compared with the reference river water SLRS5, LREE such as La and Ce are low by two to four order of magnitude. The element abundances of LREE are down to 0.012 pg g−1in the drinking waters and HREE are variable within two order of magnitude as 0.00886 to 6.66 pg g−1. REE patterns in Figure 2.10 are smooth with variable negative spikes of Ce and Eu, and positive spike of Gd, indicating the analyses were properly carried out for the samples with various matrixes and extremely low element abundances. The slope (La/Lu)nand the negative spikes of Ce and Eu (Ce/Ce∗, and Eu/Eu∗) range from 0.001 to 4.7, from 0.02 to 0.6, and from 0.2 to 0.9, respectively, reflecting ground water processes such as permeability, residence time, redox and chemical properties of host rocks. The waters from Rokko and Hita show the positve spike of Gd (Gd/Gd∗=Gdn/[Tbn2/3×Dyn1/3] = 2.2 and 3.4, respectively) is possiblly contaminated from anthropogenic source where Gd is composed in derivatives of the gadopentetic acid for magnetic resonance imaging agents (Knappe et al., 2005;
20
Lawrence, 2010; Kulaksız and Bau, 2011; Campos and Enzweiler, 2016).
Recently, Bulia and Enzweiler (2018) determined REE abundances and drinking waters from S˜ao Paulo state, Brazil with concentrations ranging from pg g−1 down to fg g−1 level. They pre- concentrated the water sample by C=100 using solid phase extraction with bis-(2-ethyl-hexyl)- phosphate. However, abundance of Gd is not quantitatively determined by the bis-(2-ethyl-hexyl)- phosphate because the Gd chelates dissociated slowly in acid media to produce the free ion during extraction (Campos and Enzweiler, 2016). The blanks in Bulia and Enzweiler (2018) range from 2 pg (Tm) to 189 pg (Ce), which are ten to hundred times higher than those in this study using FDC.
As a consequence, Bulia and Enzweiler (2018) overestimated abundances of HREE such as Er, Tm, Yb, and Lu of SLRS5 by 16, 126, 27, 24%. I infer that the FDC-ID-IS method is the only technique to determine trace element abundance comprehensively and precisely on fluids with extremely low element abundances. Geological and isotopic characteristics combined with fluid properties (e.g., pH, Eh, and temperature) and FDC-ID-IS method that can determined the element abundance down to fg g−1level of water will help understanding origin and evolution of aqueous systems.
2.4 SUMMARY
A FDC-ID-IS method that is a combination of freeze-drying concentration (FDC) and isotope dilution internal standardization (ID-IS) was developed to determine abundances of 52 elements of natural water with concentrations down to fg g−1level. To minimize overestimation of element abundances resulted from interferences, high-mass-resolution technique (M/∆M = 4000 or 10000) and oxide-correction techniques were applied. Hydrolysis of Th was avoided by dissolution of sample in 0.5 mol L−1HNO3, and matrix-effected signal suppression was avoided by dilution of the sample solution to NaCl of≤0.2 cg g−1and≤0.1 cg g−1for ICP-QMS and ICP-SFMS, respectively.
The 100–125 ml of sample solution was reduced to 0.7–2.0 g through freeze drying. Consequently, concentrated sample solution withC=50−180 was fed into mass spectrometry. The recovery yields of 52 elements on FDC were 96.8–106%, which demonstrate that elements were fully collected without significant contamination. Detection limits in a sample solution with FDC were≤10 pg g−1, except 100 pg g−1for Na, 89.0 pg g−1 for K, and 15.6 pg g−1 for Ca, respectively. Blanks with FDC were in pg-level, except for 11 elements to be ng-level (Na, Mg, Al, P, Ca, Mn, Fe, Co, Ni, Cu, and Zn).
Compared with other pre-concentration techniques for determination of REE in drinking waters (e.g., solid phase extraction by Bulia and Enzweiler, 2018), blanks by FDC-ID-IS are ten to hundred times smaller.
Analytical precisions on determination of element abundances of river water SLRS5 with FDC were≤10% and 21% for 51 elements and Sn, respectively. Analytical precisions of analyses with FDC relative to those without FDC by Yeghicheyan et al. (2013) were 1.7−31 times better for 32 trace elements except for Sn, and consistent for 16 major- and transition-elements. By FD-ID-IS method, we determined abundances of 52 elements of drinking waters from seven geological sources that range in concentrations by nine order of magnitudes from fg g−1up to µg g−1level. The duplicated analyses are with relative differences of<10%, 10−20%, and>20% for 78%, 12%, and 10% of total 364 acquisitions. Major-element abundances inferred on the labels are consistent with those determined by this study. The CI-normalized REE patterns are smooth and with variable negative spikes of Ce and Eu suggesting that the analyses are properly conducted for the samples with various matrices
and extremely low element abundances. These results infer that the FDC-ID-IS method is the only technique to determine extremely low trace-element abundances accurately and precisely for natural waters.
22
Table 2.1: Analytical condition by ICP-QMS
parameter remark
instrument Agilent 7500cs ICP-QMS
plasma power 1.6 kW
torch Quartz glass torch with a Pt injector
plasma Ar gas rate 15 l min−1
auxiliary Ar gas rate 0.9 l min−1
nebulizer Ar gas rate 0.87 l min−1
make-up Ar gas flow rate 0.34 l min−1
nebulizer micro-flow PFA-20 nebulizer,
PFA-20 (ESI, USA), self-aspiration
spray chamber Scott double-pass, cooled at 275 K,
made of Teflon
sampling orifice 1 mm (made of Pt)
skimmer orifice 0.4 mm (made of Pt)
typical sensitivity 15 Mcps/µg ml−1for88Sr
oxide formation rate <1% (CeO+/Ce+)
integration time per 1 sec
86Sr+,88Sr+ 0.2 ms
89Y+ 0.3 ms
137Ba+ 1 ms
91Zr+,139La+,140Ce+,141Pr+, 2 ms
85Rb+,146Nd+,163Dy+ 10 ms
151Eu+,157Gd+ 12 ms
159Tb+ 14 ms
7Li+,93Nb+,93Nb+,147Sm+,149Sm+,165Ho+ 20 ms
167Er+,169Tm+,172Yb+,175Lu+,232Th+ 20 ms
97Mo+,111Cd+,115In+,119Sn+,121Sb+, 30 ms
147Cs+,208Pb+ 30 ms
9Be+,197Hf+,182W+ 40 ms
11B+,205Tl+,209Bi+,238U+ 50 ms
181Ta+ 130 ms
background correction measured before each sample,
after a 200 s wash

![Table 2.4: Sample detection-limit by C=50 and blank of FDC-ID-IS method sample detection-limit [pg g −1 ] blank [pg]](https://thumb-ap.123doks.com/thumbv2/123deta/5837984.1037825/28.892.310.595.154.1139/table-sample-detection-limit-blank-method-sample-detection.webp)