• 検索結果がありません。

Working Paper Series (E)

N/A
N/A
Protected

Academic year: 2021

シェア "Working Paper Series (E)"

Copied!
18
0
0

読み込み中.... (全文を見る)

全文

(1)

Working Paper Series (E)

No.31

Perceived availability of social support and its effects on mental health in Japan:

A preliminary analysis using National Survey on Social Security and People’s Life 2017

Ruoyan Gai

December 2020

http://www.ipss.go.jp/publication/e/WP/IPSS_WPE31.pdf

Hibiya Kokusai Building 6F, 2-2-3 Uchisaiwaicyo, Chiyoda-ku, Tokyo 100-0011

http://www.ipss.go.jp

(2)

The views expressed herein are those of the

authors and not necessarily those of the National

Institute of Population and Social Security

Research, Japan.

(3)

1

Perceived availability of social support and its effects on mental health in Japan:

A preliminary analysis using National Survey on Social Security and People’s Life 2017 1

Ruoyan Gai

National Institute of Population and Social Security Research

Abstract

Accumulating evidence indicates a robust association between social support and population health. On the other hand, social support and its effects on mental health status in the overall population has not often been examined in Japan. In this analysis, we used data of the latest National Survey on Social Security and People’s Life to explore availability of social support in various life events among different subgroups of population and to assess the association of the extent of social support and mental distress.

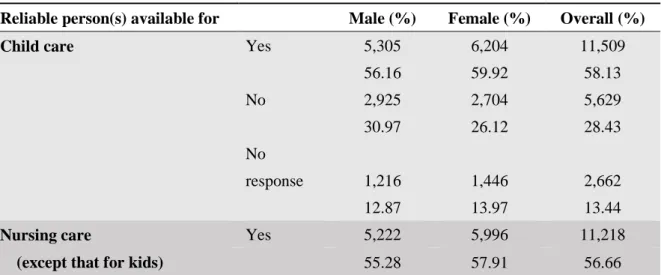
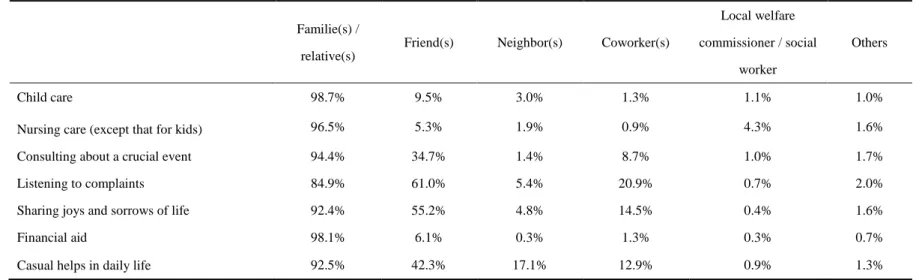
As the results, the multilevel regression model indicates that the extent of social support independently affected mental health status. Support coming from families / relatives is overwhelmingly dominant in persons expected to rely on in all surveyed functional events including child care, nursing care, consulting about a crucial event, listening to complaint, sharing joys and sorrows of life, financial aid and casual helps in daily life. Compared to the male, the female are more likely to have someone to rely on. The preliminary findings have provided an overview of the extent of social support in the overall population and confirmed the association of the low level of social support and mental distress in Japan.

1

Acknowledgement: This paper is published as a project deliverable of the joint

research team aiming to promote secondary data usage of the National Survey on Social

Security and People’s Life 2017.

(4)

2

Background

Social support is defined as “support accessible to an individual through social ties to other individuals, groups, and the larger community” 1 . Besides the private domain such as family, friends, neighbors and coworkers, it may come from the public domain such as public aids. Theoretically, social support is composed of two essential dimensions: (1) a structural dimension, which refers to network size, composition and frequency of social interactions, and (2) a functional dimension, which refers to emotional, instrumental and tangible components of support such as love/ empathy, being listened to and understood, and practical care and assistance received in relevant specific life events 2,3 .

Social support has been regarded as an important social determinant of health.

There have been numerous empirical epidemiological evidence demonstrating its benefits to physical and mental health of the overall population as well as diverse subgroups such as women, the elderly, patients and migrants. In general, those living with family, actively involving social network, having emotional and instrumental support and being satisfied with the interactions with family and friends are likely to have lower mortality and morbidities and mental distresses 4-7 . Underlying the robust association are plausible biological and health behavioral mechanisms of social support in terms of alleviating genetic and environmental vulnerabilies, inspiring resilience to stresses and encouraging positive health-related behaviors such as healthy diet, exercise, smoking cessation, and healthcare seeking and adherence 8-10 . Like all other types of human social interaction, social support shows sociocultural diversities, which suggest the necessity to examine and to interpret this issue based on a specific context 11,12 .

Japan has been experiencing unprecedented population aging and changing pattern

of family structure, bringing profound influences to the safety net for people’s life at both

private and public level. Meanwhile, social isolation accompanying with expending

inequalities has become a serious social problem. Those exposing to the high risk include

the elderly people and single household. Paralleling with such a social concern arise from

population aging, a relevantly large number of studies in particular focus on the elderly

people and their caregiver in Japan, revealing the impact of social support on healthcare

seeking, health and wellbeing outcomes and the gaps in terms of gender, financial status

and family pattern 13-18 . On the other hand, social support and its effects on mental health

status in the overall Japanese population has not often been examined. In the present

analysis, we used data of the latest National Survey on Social Security and People’s Life

2017 to explore availability of social support in several life events among different

subgroups of population and to assess its effect on mental health status. It is important to

note that the hypothetical association is anchored to the demographical background.

(5)

3

Methods

The dataset of the survey consisted of the valid response from the valid response from 10,369 households and 19,800 adult individuals (aged 18 years or older) living in 300 municipalities. The study settings covered all 47 prefectures of the country. Table 1 summarizes major demographic characteristics of the respondents.

Table 1. Demographic characteristics of the respondents

n %

Year of birth 1995-1999 846 4.27

1990-1994 813 4.11

1985-1989 1,038 5.24

1980-1984 1,291 6.52

1975-1979 1,549 7.82

1970-1974 1,715 8.66

1965-1969 1,648 8.32

1960-1964 1,540 7.78

1955-1959 1,664 8.40

1950-1954 2,001 10.11

1945-1949 1,958 9.89

1940-1944 1,614 8.15

1935-1939 1,068 5.39

1930-1934 678 3.42

1929 or earlier 377 1.90

Gender Male 9,446 47.71

Female 10,354 52.29

Marital status Single 6,736 34.02

Married 12,669 63.98

Widowed 13,629 68.83

Divorced 5,245 26.49

Educational background Primary and middle school 2,395 12.46

High school 7,931 41.26

Junior college 2,016 10.49

University and graduate school 4,819 25.07

(6)

4

Others 2,062 10.73

Decile of household

income I 1,394 7.04

II 1,488 7.52

III 1,698 8.58

IV 1,597 8.07

V 1,860 9.39

VI 1,849 9.34

VII 1,947 9.83

VIII 2,145 10.83

IX 2,263 11.43

X 2,105 10.63

Household structure Single male 1,079 5.45

Single female 1,233 6.23

Childless couple 4,539 22.92

Nuclear 3,889 19.64

Single parent 284 1.43

Three-generation 1,088 5.49

Structure unclear 334 1.69

Others 7,354 37.14

In the individual questionnaire, components related to availability of social support included the question “do you have someone (such as families, relatives and friends) you can count on to help you” for relevant life events and for those who had a positive answer,

“who is the reliable person” for that event. These events were considered to reflect the

functional dimension of social support, principally including 1) child care, 2) nursing care

(except that for kids), 3) consulting about crucial events, 4) listening to complaints, 5)

sharing joys and sorrows of life, 6) financial aid, and 7) casual helps in daily life. Then

depending upon the extent of availability of reliable person(s) for these events, the

responses were categorized into 1) reliable person(s) available in all 7 events, 2) reliable

person(s) not available or no response in some events, and 3) reliable person(s) not

available in any event. This newly created variable was regarded as the explanatory

variable. Descriptive analyses were performed for the distribution of each functional

event and reliable person(s) for it, as well as the extent of social support in different age

groups, gender, types of household structure, marital status, and deciles of household

income.

(7)

5

The outcome variable, mental distress, was measured by a self-administrated Kessler Psychological Distress Scale (K6), which score can be categorized into three levels: 1) no or mild mental distress with K& score < 5, 2) moderate mental distress with 5<= K6 score <13 and 3) serious mental distress with K& score >=13 19 . A multilevel mixed-effects logistic regression was performed to explore the relationship between the severity of mental distress and the extent of social support by adjusting major covariates, including year of birth, gender, household structure, marital status, deciles of household income, perceived financial status (five scaled options: 1. Very well off, 2. Well off, 3.

Fair, 4. Badly off, 5. Very badly off) and perceived health status (five scaled options: 1.

Excellent, 2. Good, 3. Fair, 4. Poor, 5. Bad). Intra-class cluster correlation at the municipality level was controlled. The model calculated adjusted odds ratios and the proportion of agreement / disagreement to the statement with a 95% confidence interval (95% CI) by using Stata 15.1.

Results

Availability of social support

Table 2 demonstrates the response of each functional event of social support. Those who have someone they can count on for child care, nursing care, consulting about crucial event, listening to complaints, sharing joys and sorrows of life, financial aid, and casual helps in daily life compose 58.13%, 56.66%, 81.85%, 81.84%, 84.94%, 55.59%, and 78.85% of all respondents, respectively. Compared to male, female are more likely to have reliable person(s) for all these life events.

Table 2. Functional events of social support by gender

Reliable person(s) available for Male (%) Female (%) Overall (%)

Child care Yes 5,305 6,204 11,509

56.16 59.92 58.13

No 2,925 2,704 5,629

30.97 26.12 28.43

No

response 1,216 1,446 2,662

12.87 13.97 13.44

Nursing care Yes 5,222 5,996 11,218

(except that for kids) 55.28 57.91 56.66

(8)

6

No 3,177 3,098 6,275

33.63 29.92 31.69

No

response 1,047 1,260 2,307

11.08 12.17 11.65

Consulting about crucial events Yes 7,388 8,818 16,206

78.21 85.17 81.85

No 1,352 763 2,115

14.31 7.37 10.68

No

response 706 773 1,479

7.47 7.47 7.47

Listening to complaints Yes 7,152 9,053 16,205

75.71 87.43 81.84

No 1,579 615 2,194

16.72 5.94 11.08

No

response 715 686 1,401

7.57 6.63 7.08

Sharing joys and sorrows of life Yes 7,628 9,191 16,819

80.75 88.77 84.94

No 1,093 452 1,545

11.57 4.37 7.8

No

response 725 711 1,436

7.68 6.87 7.25

Financial aid Yes 4,966 6,041 11,007

52.57 58.34 55.59

No 3,774 3,599 7,373

39.95 34.76 37.24

No

response 706 714 1,420

7.47 6.9 7.17

Casual helps in daily life Yes 7,068 8,545 15,613

74.83 82.53 78.85

No 1,626 1,078 2,704

(9)

7

17.21 10.41 13.66

No

response 752 731 1,483

7.96 7.06 7.49

Total 9,446 10,354 19,800

100 100 100

Among the reliable person(s) who are expected to give a favor, the option of families / relatives is overwhelmingly dominant, accounting for more than 90% of those who answered “yes” for availability of reliable person(s) in all these event (Table 3). In Table 3, the proportion of relying on friends in some events, such as consulting about a crucial events, listening to complaints, sharing joys and sorrows of life and casual helps in daily life, is also obvious.

Table 4 shows the extent of social support in different age groups and by gender.

In general, those who have reliable person(s) in all events account for 29.44%, 27.44%

and 31.27% of the overall, male and female population, respectively. Those born during 1955-1989 are more likely to have higher proportion of reliable person(s) available in all events. On the other hand, those who don’t have reliable person(s) in any event compose 3.05%, 4.77% and 1.48% of the overall, male and female population, respectively.

Married respondents are more likely to acquire necessary supports in all events (Table 5). Regarding annual household income, a tendency that the proportion of reliable persons available in all events is gradually increasing in higher deciles of household income is observed (Table 6).

The effect of the extent of social support on mental health status

Table 7 summarizes the outputs of the multilevel regression model to explore the

effect of the extent of social support on mental health. Those born prior to 1979, female,

those with excellent subjective health, those married, and those having reliable person(s)

for all the events are less likely to suffer from mental distress, while those perceiving to

be badly or very badly off and those not having reliable person(s) for any event are on the

opposite. The model does not identify a significant effect of annual household income

and educational background on mental health status.

(10)

8

Table 3. Reliable person(s) for each functional event of social support

Familie(s) / relative(s)

Friend(s) Neighbor(s) Coworker(s)

Local welfare commissioner / social

worker

Others

Child care 98.7% 9.5% 3.0% 1.3% 1.1% 1.0%

Nursing care (except that for kids) 96.5% 5.3% 1.9% 0.9% 4.3% 1.6%

Consulting about a crucial event 94.4% 34.7% 1.4% 8.7% 1.0% 1.7%

Listening to complaints 84.9% 61.0% 5.4% 20.9% 0.7% 2.0%

Sharing joys and sorrows of life 92.4% 55.2% 4.8% 14.5% 0.4% 1.6%

Financial aid 98.1% 6.1% 0.3% 1.3% 0.3% 0.7%

Casual helps in daily life 92.5% 42.3% 17.1% 12.9% 0.9% 1.3%

Table 4. The extent of social support in different age groups

Overall (%) Male (%) Female (%)

Year of birth

Reliable persons available

in all 7 events

Reliable persons

not available

in any event

Reliable persons not

available / no response

in some events

No response

in any

event Total

Reliable persons available

in all 7 events

Reliable persons

not available

in any event

Reliable persons not

available / no response

in some events

No response

in any

event Total

Reliable persons available

in all 7 events

Reliable persons

not available

in any event

Reliable person not available / no response

in some events

No response

in any

event Total 1995-

1999 194 19 556 77 846 80 16 259 35 390 114 3 297 42 456

22.93 2.25 65.72 9.1 100 20.51 4.1 66.41 8.97 100 25 0.66 65.13 9.21 100

(11)

9 1990-

1994 243 24 510 36 813 109 18 248 21 396 134 6 262 15 417

29.89 2.95 62.73 4.43 100 27.53 4.55 62.63 5.3 100 32.13 1.44 62.83 3.6 100

1985-

1989 376 32 588 42 1,038 157 24 298 25 504 219 8 290 17 534

36.22 3.08 56.65 4.05 100 31.15 4.76 59.13 4.96 100 41.01 1.5 54.31 3.18 100

1980-

1984 481 30 727 53 1,291 209 26 366 36 637 272 4 361 17 654

37.26 2.32 56.31 4.11 100 32.81 4.08 57.46 5.65 100 41.59 0.61 55.2 2.6 100

1975-

1979 606 32 846 65 1,549 293 23 431 31 778 313 9 415 34 771

39.12 2.07 54.62 4.2 100 37.66 2.96 55.4 3.98 100 40.6 1.17 53.83 4.41 100

1970-

1974 611 44 1,003 57 1,715 261 37 485 31 814 350 7 518 26 901

35.63 2.57 58.48 3.32 100 32.06 4.55 59.58 3.81 100 38.85 0.78 57.49 2.89 100

1965-

1969 570 60 963 55 1,648 271 46 478 36 831 299 14 485 19 817

34.59 3.64 58.43 3.34 100 32.61 5.54 57.52 4.33 100 36.6 1.71 59.36 2.33 100

1960-

1964 576 51 867 46 1,540 240 37 417 26 720 336 14 450 20 820

37.4 3.31 56.3 2.99 100 33.33 5.14 57.92 3.61 100 40.98 1.71 54.88 2.44 100

1955-

1959 553 53 988 70 1,664 243 43 466 36 788 310 10 522 34 876

(12)

10

33.23 3.19 59.38 4.21 100 30.84 5.46 59.14 4.57 100 35.39 1.14 59.59 3.88 100

1950-

1954 509 68 1,333 91 2,001 223 50 652 42 967 286 18 681 49 1,034

25.44 3.4 66.62 4.55 100 23.06 5.17 67.43 4.34 100 27.66 1.74 65.86 4.74 100

1945-

1949 400 93 1,363 102 1,958 190 71 629 54 944 210 22 734 48 1,014

20.43 4.75 69.61 5.21 100 20.13 7.52 66.63 5.72 100 20.71 2.17 72.39 4.73 100

1940-

1944 310 48 1,134 122 1,614 143 32 515 62 752 167 16 619 60 862

19.21 2.97 70.26 7.56 100 19.02 4.26 68.48 8.24 100 19.37 1.86 71.81 6.96 100

1935-

1939 186 32 759 91 1,068 90 20 355 44 509 96 12 404 47 559

17.42 3 71.07 8.52 100 17.68 3.93 69.74 8.64 100 17.17 2.15 72.27 8.41 100

1930-

1934 132 16 448 82 678 57 8 186 25 276 75 8 262 57 402

19.47 2.36 66.08 12.09 100 20.65 2.9 67.39 9.06 100 18.66 1.99 65.17 14.18 100

1929 or

earlier 83 2 244 48 377 26 0 93 21 140 57 2 151 27 237

22.02 0.53 64.72 12.73 100 18.57 0 66.43 15 100 24.05 0.84 63.71 11.39 100

Total 5,830 604 12,329 1,037 19,800 2,592 451 5,878 525 9,446 3,238 153 6,451 512 10,354

29.44 3.05 62.27 5.24 100 27.44 4.77 62.23 5.56 100 31.27 1.48 62.3 4.94 100

(13)

11

Table 5. Marital status and the extent of social support

Marital status

Reliable person(s) available in

all 7 events

Reliable person(s) not

available in any event

Reliable person(s) not available / no response in some

events

No response in

any event

Total

Single 690 238 2,902 225 4,055

17.02 5.87 71.57 5.55 100

Married 4,557 250 7,394 468 12,669

35.97 1.97 58.36 3.69 100

Widowed 315 38 1,098 112 1,563

20.15 2.43 70.25 7.17 100

Divorced 226 69 767 56 1,118

20.21 6.17 68.6 5.01 100

Table 6. Annual household income and the extent of social support

Decile of household income

Reliable person(s) available in all

7 events

Reliable person(s) not available in any

event

Reliable person(s) not available / no response in some

events

No response in

any event

Total

I 268 96 883 147 1,394

19.23 6.89 63.34 10.55 100

II 335 58 990 105 1,488

22.51 3.9 66.53 7.06 100

III 408 60 1,140 90 1,698

24.03 3.53 67.14 5.3 100

IV 461 47 1,014 75 1,597

28.87 2.94 63.49 4.7 100

V 518 52 1,238 52 1,860

27.85 2.8 66.56 2.8 100

VI 619 35 1,152 43 1,849

33.48 1.89 62.3 2.33 100

VII 599 48 1,247 53 1,947

30.77 2.47 64.05 2.72 100

VIII 743 54 1,290 58 2,145

34.64 2.52 60.14 2.7 100

(14)

12

IX 823 67 1,331 42 2,263

36.37 2.96 58.82 1.86 100

X 783 41 1,233 48 2,105

37.2 1.95 58.57 2.28 100

Table 7. Factors affecting mental health status

Mental distress measured by K6 Odds Ratio 95% CI p

Year of birth 1995-1999 ref.

1990-1994 1.240 0.989 1.554 0.062

1985-1989 1.115 0.895 1.389 0.334

1980-1984 0.875 0.706 1.085 0.224

1975-1979 0.785 0.634 0.972 0.026

1970-1974 0.794 0.641 0.983 0.035

1965-1969 0.635 0.511 0.789 <0.000 1960-1964 0.666 0.534 0.831 <0.000 1955-1959 0.481 0.385 0.600 <0.000 1950-1954 0.441 0.354 0.549 <0.000 1945-1949 0.369 0.295 0.462 <0.000 1940-1944 0.380 0.300 0.480 <0.000 1935-1939 0.439 0.340 0.567 <0.000 1930-1934 0.457 0.342 0.610 <0.000 1929 or earlier 0.526 0.369 0.748 <0.000

Gender Male ref.

Female 1.220 1.138 1.309 <0.000

Marital status Single ref.

Married 0.853 0.767 0.949 0.003

Widowed 0.993 0.832 1.185 0.937

Divorced 0.817 0.687 0.971 0.022

Decile of household income I ref.

II 1.000 0.839 1.191 0.999

III 0.983 0.830 1.163 0.838

IV 0.900 0.760 1.068 0.227

V 1.008 0.856 1.189 0.92

VI 1.075 0.912 1.268 0.389

VII 0.924 0.784 1.089 0.348

VIII 0.916 0.779 1.076 0.286

(15)

13

IX 0.921 0.784 1.082 0.317

X 0.858 0.725 1.015 0.074

Perceived financial status Very well off ref.

Well off 1.021 0.787 1.323 0.878

Fair 1.053 0.825 1.343 0.68

Badly off 1.820 1.416 2.338 <0.000 Very badly off 2.561 1.948 3.367 <0.000 Educational background Middle school and below ref.

High school 0.906 0.803 1.022 0.107 Junior college 1.055 0.904 1.230 0.498 University / graduate school 0.878 0.767 1.006 0.06

Others 0.960 0.824 1.119 0.599

Perceived health status Excellent ref.

Good 2.331 2.112 2.572 <0.000

Fair 3.236 2.948 3.553 <0.000

Poor 7.896 6.947 8.973 <0.000

Bad 14.593 11.036 19.296 <0.000

Social support

Reliable person(s) not available / no response in some events

ref.

Reliable person(s) available

in all 7 events 0.879 0.817 0.946 0.001 Reliable person(s) not

available in any event 1.271 1.041 1.553 0.019

Interpretations

The preliminary findings have provided an overview of the extent of social support in the overall population and confirmed the association of social support and mental health in Japan. By a multilevel model, the effect of the low level of social support on mental distress is confirmed by controlling demographical and socioeconomic factors. To our knowledge, this is the latest analysis with a good sampling frame and well assessed demographic and socioeconomic status of the overall population.

It is identified that support coming from families / relatives is overwhelmingly

dominant in persons expected to rely on in all surveyed functional events. This result

(16)

14

highlights a potential concern of weakened family functions in providing support and care with changing shrinking family size and family pattern, as the average family size is projected to decrease from 2.33 persons per household to 2.08 persons, and the proportion of single households among those headed by those 65 years and older will increase from 36.0% to 44.2% between 2015 and 2040 20 . To this end, exerting functions of social support and social safety net at the public domain is expected to compensate for the weakened support and care at the private domain in the near future.

The analysis also show a gender difference in the perceived social support.

Compared to the male, the female are more likely to have someone to rely on. It is consistent with previous findings suggesting that femininity was associated with seeking and receiving emotional support and promoting a more social form of wellbeing, which could be explained by socialization experiences and social roles of gender 21-23 . It entails the adaptation of the public services for the strengthening of variable support needs to the gender difference.

References

1. Lin N, Simeone RS, Ensel WM, Kuo W. Social support, stressful life events, and illness: A model and an empirical test. Journal of Health and Social Behavior. 1979;

20(2): 108-19.

2. Haber MG, Cohen JL, Lucas T, et al. The relationship between self-reported received and perceived social support: A meta-analytic review. American Journal of Community Psychology. 2007; 39: 133-44.

3. Thoits PA. Conceptual, methodological and theoretical problems in studying social support as a buffer against life stress. Journal of Health and Social Behavior. 1982;

23(2): 145-59.

4. Gariepy G, Honkaniemi H, Quesnel-Vallee A, et al. Social support and protection from depression: systematic review of current findings in Western countries. British Journal of Psychiatry. 2016; 209: 284-93.

5. Harandi TF, Taghinasab MM, Nayeri TD. The correlation of social support with mental health: A meta-analysis. Electronic Physician. 2017; 9: 5212-22.

6. Mohd TAMT, Yunus RM, Hairi F, et al. Social support and depression among community dwelling older adults in Asia: A systematic review. BMJ Open. 2019; 9(7):

e026667.

7. Reblin M, Uchino BN. Social and emotional support and its implication for health.

(17)

15

Current Opinions of Psychiatry. 2008; 21(2): 201-5.

8. Ozbay F, Johnson DC, Dimoulas E, et al. Social support and resilience to stress: From neurobiology to clinical practice. Psychiatry (edgmont). 2007; 4(5): 35-40.

9. Ozbay F, Fitterling H, Charney D, Southwick S. Social support and resilience to stress across the life span: A neurobiologic framework. Current Psychiatry Reports. 2008;

10(4): 304-10.

10. Uchino BN. Social support and health: A review of physiological processes potentially underlying links to disease outcomes. Journal of Behavioral Medicine.

2006; 29: 277-87.

11. Shavitt S, Cho YI, Johnson TP, et al. Culture moderates the relation between perceived stress, social support, and mental and physical health. Journal of Cross-Cultural Psychology. 2016; 47(7): 956-80.

12. Morling B, Uchida Y, Frentrup S. Social support in two cultures: Everyday transactions in the U.S. and empathic assurance in Japan. PLoS One. 2015; 10(6):

e0127737.

13. Okabayashi H, Liang J, Krause N, et al. Mental health among older adults in Japan:

Do sources of social support and negative interaction make a difference? Social Science and Medicine. 2004; 59(11): 2259-70.

14. Koizumi Y, Awata S, Kuriyama S, et al. Association between social support and depression status in the elderly: Results of a 1-year community-based prospective cohort study in Japan. Psychiatry and Clinical Neurosciences. 2005; 59(5): 563-9.

15. Takagi D, Kondo K, Kawachi I. Social participation and mental health: moderating effects of gender, social role and rurality. BMC Public Health. 2013; 13: 701.

16. Shiba K, Kondo N, Kondo K. Informal and formal social support and caregiver burden: The AGES caregiver survey. Journal of Epidemiology. 2016; 26(12): 622-8.

17. Higuchi M, Suzuki K, Ashida T, et al. Social support and access to health care among older people in Japan: Japan Gerontological Evaluation Study (JAGES). Asia-Pacific Journal of Public Health. 2018; 30(5): 425-36.

18. Uzuki T, Konta T, Saito R, et al. Relationship between social support status and mortality in a community-based population: A prospective observational study (Yamagata study). BMC Public Health. 2020; 20(1): 1630.

19. Prochaska JJ, Sung H, Max W, Shi Y, Ong M (2012). Validity study of the K6 scale as a measure of moderate mental distress based on mental health treatment need and utilization. Int J Methods Psychiatr Res 21: 88-97.

20. National Institute of Population and Social Security Research, Japan (2018).

Household projections for Japan: 2015-2040.

(18)

16

Available at: http://www.ipss.go.jp/pp-ajsetai/j/HPRJ2018/houkoku/hprj2018_houkoku.pdf

(Accessed on Nov. 27, 2020)

21. Reevy GM, Maslash C. Use of social support: Gender and personality differences.

Sex Roles: A Journal of Research. 44: 437-59.

22. Matud MP, Ibanez I, Bethencourt JM, et al. Structural gender differences in perceived social support. Personality and Individual Differences. 2003; 35(8): 1919-29.

23. Soman S, Bhat SM, Latha KS, et al. Gender difference in perceived social support and stressful life events in depressed patients. East Asian Archives of Psychiatry.

2016; 26(1): 22-9.

Table 1. Demographic characteristics of the respondents
Table 2. Functional events of social support by gender
Table 3. Reliable person(s) for each functional event of social support
Table 6. Annual household income and the extent of social support
+2

参照

関連したドキュメント

people with huge social costs which have not been satisfactorily mitigated by social policy in.. : Social costs of

During land plant evolution, stem cells diverged in the gametophyte generation to form different types of body parts, including the protonema and rhizoid filaments, leafy-shoot

Nov, this definition includ.ing the fact that new stages on fundamental configuration begin at the rows 23 imply, no matter what the starting configuration is, the new stages

Votes are to be placed in 36 cambres (cells). Llull has Natana state that &#34;the candidate to be elected should be the one with the most votes in the most cells&#34;. How is

mathematical modelling, viscous flow, Czochralski method, single crystal growth, weak solution, operator equation, existence theorem, weighted So- bolev spaces, Rothe method..

The SLE-revised (SLE-R) questionnaire despite simplicity is a high-performance screening tool for investigating the stress level of life events and its management in both community

In order to explore the ways to increase nurses’ job satisfaction, the relationship between nurses’ job satisfaction, servant leadership, social capital, social support as well as

In addition, we prove a (quasi-compact) base change theorem for rigid etale cohomology and a comparison theorem comparing rigid and algebraic etale cohomology of algebraic