Original
Evaluation of Heart Rate Variability as a Predictor of Hypotension after
Induction of General Anesthesia
Kosuke Miura, Yoshiaki Terao and Makoto Fukusaki Department of Anesthesia, Nagasaki Rosai Hospital
(Received: January 18, 2010)
Abstract
Purpose. To investigate specific criteria of parameters of heart rate variability (HRV) to predict hypoten-sion after induction of general anesthesia.
Methods. We studied 57 patients who were scheduled for either total knee arthroplasty (n=42) or anterior cruciate ligament reconstruction (n=15) under general anesthesia. Patients with rhythm other than sinus, ma-jor cardiovascular, pulmonary, neurologic, endocrine, or metabolic disorder or recent exposure to medications affecting heart rate were excluded from the study. After HRV analysis, anesthesia was induced with propofol, 1.5mg!kg, fentanyl, 3µg!kg, and vecuronium, 1.5mg!kg. We analyzed 256 R-R intervals immediately before in-duction of anesthesia. Power spectrum densities were calculated for total power (TP) , low frequency (LF) power (0.04―0.15Hz) and high frequency (HF) power (0.15―0.4Hz) . Non-invasive blood pressure was measured every 2.5 minutes from 5 min before anesthetic induction until 10 min after intubation. A decrease in systolic blood pressure (SBP) greater than 30% of the control value or SBP less than 90mmHg was defined as hypoten-sion. A receiver operating characteristic curve (ROC) was constructed for each of the significant HRV meas-ures.
Results. Forty patients developed hypotension during induction of general anesthesia. Amongst HRV measures, LF and TP were significantly lower in the hypotensive (HYPO) group. ROC curve analysis revealed a sensitivity of 33% and a specificity of 94% for LF<90ms2!Hz (area: 0.73, likelihood ratio: 5.5). The sensitivity
and specificity of TP<500ms2!Hz were 33%, and 95%, respectively (area 0.71, likelihood ratio: 5.5).
Conclusion. Preoperative LF<90ms2!Hz and TP<500ms2!Hz significantly correlated with hypotension
af-ter induction of general anesthesia. We suggest that preoperative measurement of LF and TP is useful for the prediction of hypotension during induction of general anesthesia.
(JJOMT, 58: 190―194, 2010)
―Key words―
heart rate variability, hypotension, general anesthesia
Introduction
Hypotension after induction of general anesthesia is common1)
. It has been recognized that perioperative hypotension is associated with adverse outcome2)3)
.
Heart rate variability (HRV), the variation over time of the period between consecutive heart beats, is a useful parameter for understanding the status of the autonomic nervous system4)∼6)
. HRV measures provided by power spectral analysis include low frequency (LF) power (0.04―0.15Hz) and high frequency (HF) power (0.15―0.4Hz), where LF reflects sympathetic and parasympathetic influences, and HF represents vagal nerve activity. The ratio of LF to HF (LF!HF) correlates with sympathovagal balance.
Recently, several investigators have reported that HRV can predict the incidence of hypotension caused by the induction of general anesthesia7)∼9)
or spinal anesthesia10)∼13)
. It would be very beneficial in improving out-come to predict the patients predisposed to develop hypotension before the induction of general anesthesia or
spinal anesthesia. Indeed, Hanss et al.10)
reported that they successfully managed the patients at high risk for hypotension during spinal anesthesia by prophylactic treatment.
We hypothesized that prediction with HRV of hypotension after the induction of general anesthesia could be applicable to various anesthetic combinations other than those reported previously7)∼9)
. To date, hypotension elicited by an anesthetic combination of bolus-administered propofol and fentanyl has not been investigated. The objectives of this study were to confirm that HRV could predict hypotension associated with an anesthetic combination of bolus-administered propofol and fentanyl, and to determine specific criteria of parameters of HRV to predict hypotension.
Materials and Methods Patients
After approval of Institutional Research Committee, informed consent was obtained from each patient. We studied 57 patients who were scheduled for either total knee arthroplasty (n=42) or anterior cruciate liga-ment reconstruction (n=15) under general anesthesia.
Patients with rhythm other than sinus, major cardiovascular, pulmonary, neurologic, endocrine, or meta-bolic disorder or recent exposure to medications affecting heart rate (e.g., beta-adrenergic blockers or agonists, antiarrythmic drugs) were excluded from the study.
Anesthesia
All patients were allowed to take food until midnight, and clear fluid until 10 : 00 a.m. Patients received no premedication, and received 500ml of acetate Ringer solution before entering the operating room. The lower limb surgery started at 1 : 00 p.m.
Anesthesia was induced with propofol, 1.5mg!kg, fentanyl, 3µ!kg, and vecuronium, 1.5mg!kg. Three min-utes later, tracheal intubation was performed. Anesthesia was maintained with sevoflurane in 40% oxygen in air and sevoflurane concentration was adjusted to maintain bispectral (BIS) index at 40―60 [approximately 0.5 minimum alveolar concentration (MAC)]. Incidentally, the BIS index is the most validated measure of depth of anesthesia, where 0 represents an isoelectric electroencephalographic and 100 an awake status. The MAC im-plies anesthetic potency; 1 MAC of an anesthetic agent abolishes response to surgical incision. The inhalation of sevoflurane was started just after the intubation. Ventilation was controlled to maintain end-tidal CO2at
30―35mmHg. Non-invasive blood pressure was measured every 2.5 minutes from 5 min before anesthetic in-duction until 10 min after intubation. A decrease in systolic blood pressure (SBP) greater than 30% of the con-trol value or SBP less than 90mmHg was defined as hypotension. Accordingly, subjects were classified into either hypotensive (HYPO) or non-hypotensive (NON-HYPO) group.
HRV measurement
Subsequent to a 10-min stabilization period, we recorded 256 R-R intervals using FM-150 device (Fukuda Denshi, Tokyo, Japan) immediately before induction of general anesthesia with a sampling rate of 1,024Hz. We conformed to the Task Force recommendation4)
. During the HRV measurement, participants were resting in a supine position and breathing was controlled at a rate of 12―15 breathes per minute. Frequency domain analy-sis was based on fast Fourier transformation. Power spectrum densities were calculated for total power (TP), LF (0.04―0.15Hz) and HF (0.15―0.4Hz) by use of a PC-based analysis system (HPS-RRA, Fukuda Denshi, Tokyo, Japan). Artifacts were eliminated by computer-based artifact detection.
Statistical analysis
Intergroup comparisons were performed using Mann-Whitney-U test orχ2test. A p<0.05 was considered
significant. Data were expressed as median (interquartile range). A receiver operating characteristic curve (ROC) was constructed for each of the significant HRV measures, and the areas under the ROC curves (AUR) were determined. StatFlex version 5.0 (Arteck inc., Osaka, Japan) was used for the statistical analysis.
Results
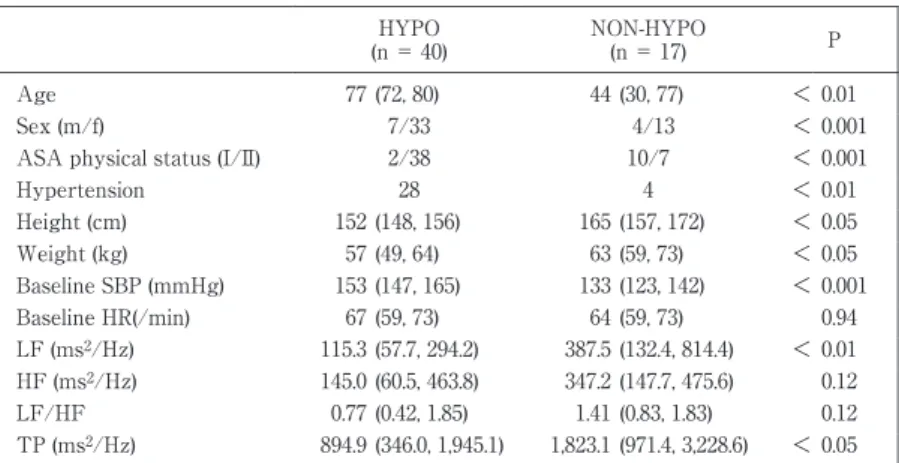
Fifty-seven patients were enrolled, and all patients completed the study. Demographic data are shown in Table 1. Forty patients developed hypotension during induction of general anesthesia. Two groups were not
Table 1 Demographicdata ofthe HYPO and NON-HYPO groups. P NON-HYPO (n= 17) HYPO (n= 40) 0.01 < (30,77) 44 (72,80) 77 Age 0.001 < 4/13 7/33 Sex (m/f) 0.001 < 10/7 2/38 ASA physicalstatus(I/II) 0.01 < 4 28 Hypertension 0.05 < (157,172) 165 (148,156) 152 Height(cm) 0.05 < (59,73) 63 (49,64) 57 Weight(kg) 0.001 < (123,142) 133 (147,165) 153 Baseline SBP (mmHg) 0.94 (59,73) 64 (59,73) 67 Baseline HR(/min) 0.01 < (132.4,814.4) 387.5 (57.7,294.2) 115.3 LF (ms2/Hz) 0.12 (147.7,475.6) 347.2 (60.5,463.8) 145.0 HF (ms2/Hz) 0.12 (0.83,1.83) 1.41 (0.42,1.85) 0.77 LF/HF 0.05 < (971.4,3,228.6) 1,823.1 (346.0,1,945.1) 894.9 TP (ms2/Hz)
Valuesare expressed asmedian (interqurtile range).SBP,systolicblood pressure;HR, heartrate;LF,low frequency;HF,high frequency;TP,totalpower
Table 2 CharacteristicsofHRV measuresaspredictorsofhypotension.
Likelihood ratio Specificity (95% CI) Sensitivity (95% CI) Threshold value AUR (95% CI) 5.5 (4.21― 7.25) 94 (88― 100) 33 (21― 45) 90 0.73 (0.61― 0.85) LF (ms2/Hz) 5.5 (4.21― 7.25) 94 (88― 100) 33 (21― 45) 500 0.71 (0.59― 0.83) TP (ms2/Hz) LF,low frequency;TP,totalpower
comparable with respect to demographic data. The HYPO group was older and had a higher percentage of in-dividuals with hypertension and a higher percentage of inin-dividuals classified with ASA class II. With regard to the American Society of Anesthesiologists physical status classification system, it is for assessing the fitness of patients before surgery, in which 6 categories are comprised. Class I refers to a normal healthy patient, class II a patient with mild systemic disease and so forth. Amongst HRV measures, LF and TP were significantly lower in the HYPO group. Table 2 compares the threshold value, sensitivity, specificity and likelihood ratio of LF and TP. ROC curve analysis revealed a sensitivity of 33% [95% confidence interval (CI), 21―45] and a speci-ficity of 94% (95% CI, 88―100) for LF<90ms2!Hz [area:0.73 (95% CI, 0.61―0.85), likelihood ratio:5.5 (95% CI,
4.21―7.25)] (Fig. 1). The sensitivity and specificity of TP<500ms2!Hz were 33% (95% CI, 21―45), and 94% (95%
CI, 88―100), respectively [area 0.71 (95%CI, 0.59―0.83), likelihood ratio:5.5 (95% CI, 4.21―7.25)] (Fig. 2). ROC curves showed the following AURs for other variables; age [0.77 (95%CI, 0.66―0.92)], ASA physical status [0.77 (95%CI, 0.66―0.92)], hypertension [0.73 (95%CI, (0.61―0.85)].
Discussion
In the present study, heart rate variability was analyzed in patients scheduled to undergo lower limb sur-gery. LF<90ms2!Hz and TP<500ms2!Hz significantly predicted the development of hypotension during
in-duction of general anesthesia. Our findings are in agreement with previous findings8)9)
. Recently, Reich et al.1)
demonstrated that postinduction hypotension is significantly correlated with age" 50 years, baseline hypotension, use of propofol for induction of anesthesia and increasing induction dosage of fentanyl (>1.5µ!kg). However, total avoidance of propofol and fentanyl is presumably impractical. These drugs are indispensable for patients with bronchial asthma or limited coronary reserve. HRV as a predictor of pe-rioperative hypotension has been investigated in various anesthetic combinations, e.g., propofol and fentanyl7)
, midazolam and fentanyl8)
, and propofol and remifentanyl9)
. With respect to the combination of propofol and fen-tanyl, propofol was continuously infused in the previous study7)
. Thus, hypotension elicited by an anesthetic combination of bolus-administered propofol and fentanyl was investigated for the first time by the present study.
Fig.1 Receiveroperatorcharacteristiccurve oflow frequency (LF)forprediction ofhypotension during induction ofgeneral anesthesia.
Fig.2 Receiver operator characteristic curve of total power (TP)forprediction ofhypotension during induction ofgeneral anesthesia.
Fujiwara et al.7)
reported that a nonlinear index of heart rate variability, ultra short term entropy (UsEn), is correlated with blood pressure fluctuation during induction of general anesthesia. In their study, blood pres-sure fluctuations were significantly greater in patients with low LF. Huang et al.8)
found that LF, HF and TP were significantly lower in the patients whose intraoperative blood pressure was instable, and concluded that TP independently predicts the incidence of hypotension. Moreover, Hanss et al.9)
investigated whether HRV predicts hemodynamic events in high risk patients, and demonstrated a greater incidence of hypotension and bradycardia in the patients with TP<500ms2!Hz.
Our study has some limitations. There were significant differences between HYPO and NON-HYPO group in demographic data. Namely, HYPO group was older, and had a higher percentage of individuals with hypertension and a higher percentage of individuals classified as ASA class II compared with NON-HYPO group. The results would reflect the evidence that HRV decreases with age5)14)
. Actually, HRV is not independ-ent of age, and accompanying hypertension or ASA status.
In summary, we investigated the value of HRV for prediction of hypotension in patients undergoing lower limb surgery. Preoperative LF<90ms2!Hz and TP<500ms2!Hz significantly correlated with hypotension after
induction of general anesthesia. We suggest that preoperative measurement of LF and TP is useful for the pre-diction of hypotension during induction of general anesthesia.
References
1) Reich DL, Hossain S, Krol M, et al: Predictors of hypotension after induction of anesthesia. Anesth Analg 101: 622―628, 2005. 2) Lima EQ, Zanetta DM, Castro I, et al: Risk factors for development of acute renal failure after liver transptation. Ren Fail 25:
553―560, 2003.
3) Monk TG, Saini V, Welden BC, Sigl JC: Anesthetic management and one-year mortality after noncardiac surgery. Anesth Analg 100: 4―10, 2005.
4) Task Force of the European Society of Cardiology and the North American Society of Pacing and Electrocardiology: Heart rate variability: standards of measurement, physiological interpretation and clinical use. Circulation 93: 1043―1065, 1996. 5) Acharya UR, Joseph KP, Kannathal N, et al: Heart rate variability: a review. Med Bio Eng Comput 44: 1031―1051, 2006. 6) Laitio T, Jalonen J, Kuusela T, Scheinin H: The role of heart rate variability in risk stratification for adeverse postoperative
cardiac events. Anesth Analg 105: 1548―1560, 2007.
7) Fujiwara Y, Ito H, Asakura Y, et al: Preoperative ultra short-term entropy predicts arterial blood pressure fluctuation during the induction of anesthesia. Anesth Analg 104: 853―856, 2007.
8) Huang CJ, Kuok CH, Kuo TBJ, et al: Pre-operative measurement of heart rate variability predicts hypotension during gen-eral anesthesia. Acta Anaesthesiol Scand 50: 542―548, 2006.
9) Hanss R, Renner J, Ilies C, et al: Does heart rate variability predict hypotension and bradycardia after induction of general anaesthesia in high risk cardiovascular patients? Anaesthesia 63: 129―135, 2008.
10) Hanss R, Bein B, Francksen H, et al: Heart rate variability-guided prophylactic treatment of severe hypotension after suba-rachnoid block for elective cesarean delivery. Anesthesiology 104: 635―643, 2006.
11) Hanss R, Bein B, Ledowski T, et al: Heart rate variability predicts severe hypotension after spinal anesthesia for elective ce-sarean delivery. Anesthesiology 102: 1086―1093, 2005.
12) Hanss R, Bein B, Weseloh H, et al: Heart rate variability predicts severe hypotension after spinal anesthesia. Anesthesiology 104: 537―545, 2006.
13) Chamchad D, Arkoosh VA, Horrow JC, et al: Using heart rate variability to stratify risk of obstetric patients undergoing spi-nal anesthesia. Anesth Aspi-nalg 99: 1818―1821, 2004.
14) Ferrari AU: Modifications of the cardiovascular system with aging. Am J Geriatr Cardiol 11: 30―33, 2002. Reprint request:
Yoshiaki Terao
Department of Anesthesia, Nagasaki Rosai Hospital, 2-12-5, Se-togoe, Sasebo, 857-0134, Japan.
別刷請求先 〒857―0134 佐世保市瀬戸越 2―12―5 長崎労災病院麻酔科 寺尾 嘉彰
全身麻酔導入後の低血圧発生の予測因子としての心拍変動解析の検討
三浦 耕資,寺尾 嘉彰,福崎 誠 長崎労災病院麻酔科 ―キーワード― 心拍変動,全身麻酔,低血圧 近年,心拍変動解析により周術期の低血圧を予測することが可能であるとの報告が散見される.全身麻酔下に整形外 科下肢手術(膝関節全置換術および靭帯断裂形成術)が予定された成人 57 名を対象に心拍変動解析を行い,全身麻酔導 入時の低血圧の発生との関連を検討したので報告する.手術室入室後,256 心拍の心拍変動の測定を行った.low frequency(LF:0.04∼0.15Hz),high frequency(HF:0.15∼ 0.40Hz),LF!HF を測定した.全身麻酔の導入は,プロポフォール 1.5mg!kg,フェンタニル 3µg!kg を用いた.全身麻 酔導入後から気管挿管 10 分後までの血圧を評価し,導入直前に比し 30% 以上の収縮期血圧の低下もしくは収縮期血圧 90mmHg 以下への低下をみたものを低血圧とした.数値は中央値(四分位数間領域)で示した.有意差のみられた心拍 変動解析のパラメータについて受診者動作特性(Receiver Operating Characteristic;ROC)曲線を構築し,その曲線下 面積(Are under curve;AUR)をもとに解析し,それぞれについて,閾値,感度,特異度,尤度比を求めた.57 名中 40 名で低血圧を認めた.非低血圧群,低血圧群でそれぞれ LF は,387.5(132.4,814.4),115.3(57.7,294.2),LF!HF は,1.41(0.83,1.83),0.77(0.42,1.85)であった.LF<90ms2 !Hz の感度は 33%,特異度は 94% であった(面積:0.73, 尤度比:5.5).TP<500ms2!Hz の感度は 33%,特異度は 95% であった(面積:0.71,尤度比:5.5). 術前の心拍変動解析により全身麻酔導入後の低血圧の発生を予測しうる可能性が示唆された. (日職災医誌,58:190─194,2010)