Globalization’s Convergence Effect on Human Quality of Life (QOL) in Asia: Evidence from the KOF Index of Globalization
1Jeet Bahadur Sapkota
Abstract
The impact of globalization on human quality of life (QOL) is an issue highly debated by academics, policy makers, the private sector, social organizations, and even by the general public in Asia and elsewhere in the world. There is no doubt that globalization has had a signifi cant im- pact on the lives of millions of Asian people; however, it is unclear that globalization has reduced or increased the gap in human QOL among the rich and poor countries. This paper examines whether human QOL in the Asian countries is converging (or diverging), and assesses the impact of globalization on QOL trends in the region. Using panel data of selected countries from 1975 to 2005 over fi ve-year intervals, and applying the dynamic panel data model, the study fi nds that human QOL of most countries in the region is moving closer to that of Japan (the benchmark country in this study) and that globalization has signifi cant impacts on this convergence. More specifi cally, overall indicators of human QOL, measured by the human development index (HDI), is converging in Asia and the overall as well as economic, social, and political indicators of glo- balization are highly signifi cant in the convergence process. Similarly, a disaggregated analysis of the sub-constructs of HDI shows that health and education indicators are also converging, and globalization indicators have a significant impact on the convergence process. Although the income aspect of QOL is found to be diverging sharply, the globalization indicators are not signifi cant on the divergence process and the shrinking gap in health and education indicators outweigh the income gap, which leads the overall human QOL convergence in the region. To complement these fi ndings, the paper calls for a study of some country cases, as well as a study of the impact of globalization on human QOL inequality within countries. Such studies, the paper concludes, will facilitate the development of specifi c policy recommendations tailored towards countries in their cultural context, with a positive (or at least neutral) impact of globalization on the reduction of human QOL gaps within them.
1. Introduction
The modern world economy and society are globalizing at a more rapid pace than ever before2 and Asia is one of the regions most affected by the current wave of globalization politi- cally, economically, and socially.3 Consequently, the impacts of globalization and its various di- mensions have been widely debated and examined by academics, politicians, policymakers, the private sector, and even by the general public in Asia. However, there is no consensus regarding how the benefi ts of globalization are distributed among Asian countries and their populations.
Although most of the theoretical and empirical literature on the convergence hypothesis claims globalization should help reduce the gap between the rich and poor,4 the convergence effect of globalization on the human quality of life (QOL) within Asia is still a matter of debate and is rarely explored.
Nonetheless, there are a signifi cant number of studies that assess the impact of globalization within Asia. For instance, a comprehensive study by the World Bank confi rmed that the sustained
and rapid economic growth in East Asia is more equally distributed than in any other region of the world.5 Furthermore, Yusuf claimed that the so-called East Asian Miracle helped global income convergence, as a number of economies from the region grew signifi cantly faster than the average for the member countries of the Organization for Economic Cooperation and Develop- ment (OECD).6 However, these studies mainly focused on income or materialistic achievements following the conventional wisdom of globalization research.7 Of course, income is an important part of QOL, but health and education are as well8; hence, these aspects should receive similar re- search efforts. In this regard, recent works by Kenny assessed empirically the global convergence on QOL variables.9 Kenny also evaluated the case of East Asia.10 However, in his analyses, he did not introduce any aspect of globalization as an explanatory variable, nor did he assess the over- all convergence of QOL. Instead, he measured the convergence of different elements separately and found that some were converging and some were not. The present study attempts to narrow the gap in this area of research by offering an analysis of the current situation of convergence of overall human QOL in terms of human development index and its components within the region, while undertaking an exploration of the effect of globalization in this convergence (or diver- gence) process.
The article is organized as follows: Section 2 introduces the KOF indexes as the working defi nition and measurement of globalization, and the human development index as the measure of human QOL. The section also highlights the current global as well as Asian trends of these key indicators. Section 3 examines the convergence of human development in the region and fi nds clear evidence of convergence. It also briefl y discusses the reasons behind this fi nding. Section 4 empirically tests the impacts of globalization on this convergence process. The section presents the methodology and the results simultaneously and shows, as expected, a signifi cant contribu- tion of globalization to the convergence of human development. Finally, Section 5 offers a brief discussion on the fi ndings and suggests further research.
2. Globalization, Human QOL, and Its Trend in Asia
Since the end of the Cold War and the resurgence of neo-liberal economic policy as the dominant approach to economic development and international economic relations, contempo- rary globalization has not only become a central concern to the donor community and policymak- ers, but it has also drawn due attention from academics, non-governmental organizations, and even from the general public.11 Globalization is one of the most controversial issues whose many aspects are questioned and debated, the discussion including the scope, structure, reality, and meaning of globalization itself.12 Thus, it is very hard to defi ne globalization in a way that satis- fi es all stakeholders. This study takes the most comprehensive defi nition and indicator of global- ization based on academic literature on the impact of globalization.
Most of the empirical studies in relation to the so-called third wave of globalization13 em- ploy proxies such as trade, capital fl ows, and openness as measures of globalization, and they use cross-section data.14 For example, Heinemann showed that more open countries had lower incre- ments in government outlays and taxes15 and Vaubel found more open countries having lower government consumption.16 Rodrik also used cross-section data and found no effects of capital account openness on economic growth.17 Recently, however, some scholars have used panel data to fi nd the effects of globalization and have shown positive impacts of openness on growth and poverty but revealed mixed impacts on income inequality.18
These detailed studies, however, fail to consider the overall effect of globalization, as they focus on individual dimensions of globalization. As all the dimensions of globalization are strongly related to each other and are important in explaining the consequence of globalization,
omitting such important variables from the regression equation can generate severely biased co- effi cients.19 In addition, as mentioned earlier, most of these studies, motivated by conventional wisdom, focus solely on economic growth, income poverty, and income inequality.
To correct these shortcomings, this study uses the KOF Index of Globalization developed by Dreher, which is considered the most comprehensive indicator of globalization available.20 Although there is another measure of overall globalization developed by A.T. Kearney/Foreign Policy Magazine,21 it only ranks the countries in terms of globalization, and the ranking is only available for recent years. Thus, the A.T. Kearney Index of Globalization cannot be used for the purpose of this study.
To defi ne globalization by formulating the KOF Index of Globalization, Dreher referred to the defi nition given by Keohane and Nye, among others,22 and he summarized the defi nition of glo- balization in the following three dimensions:
economic globalization, characterized as the long-distance fl ow of goods, capital, and ser-
•
vices as well as information and perceptions that accompany market exchanges;
political globalization, characterized by a diffusion of government policies; and,
•
social globalization, expressed as the spread of ideas, information, images, and people.
• 23
Dreher then considered all possible elements for each dimension of globalization and de- veloped the indexes of economic, social, and political globalization by employing appropriate weights systematically for each component following the methodology of Gwartney and Law- son.24 The components of each aspect of globalization were transformed on a zero-to-ten scale before the principle components technique was used to construct a weighted summary index for individual dimensions of globalization. Then the indexes of economic, social, and political globalization were combined into a single index of overall globalization, giving the respective weights for each dimension. The single index is named the KOF Index of Globalization, and it is the working defi nition and measure of globalization in the present study. Appendix I presents the elements considered and weights assigned to calculate the KOF Index of Globalization.
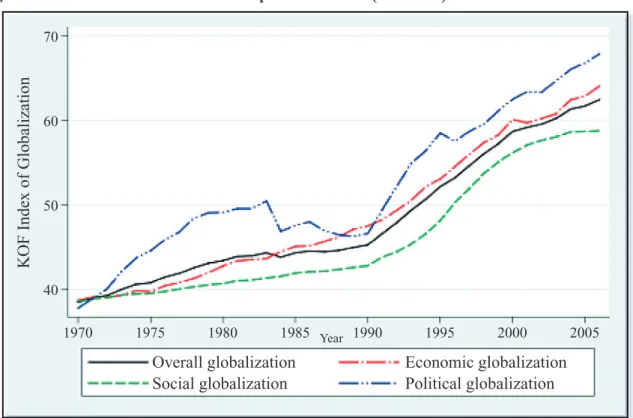
Figure 1, based on the KOF Indexes, presents the trends of the three types of globalization.
Representing the high turmoil in international security as well as an increasing role of global governance, political globalization fluctuates more at higher levels. In comparison, economic globalization has a rather steady upward trend. Although social globalization has the lowest in- dex value, the progress goes along with the pace of other forms of globalization. Overall, global- ization has moved faster since the beginning of the 1990s, when the fi ve-decade long Cold War ended.
The globalization trends in Asia are somehow different from the global trends. As shown in Figure 2, Asian globalization is highly driven by economic factors. Political globalization was very weak before 1990, but it has gained significant momentum since then. The trend of social globalization is much more similar to the trend at the global level.
Figure 1. Global Trends of Globalization as per KOF Indexes (1970-2006)
Overall globalization Social globalization
1970 1975 1980 1985 1990 1995 2000 2005
Economic globalization Political globalization
KOF Index of Globalization
Year 60
70
40 50
Source: Author’s calculation using data from Axel Dreher, Does Globalization Affect Growth? Empirical Evi- dence from a New Index, Applied Economics, Vol. 38, No. 10 (2006).
Figure 2. Asian Trends of Globalization as per KOF Indexes (1970-2006)
Overall globalization Social globalization
Economic globalization Political globalization
KOF Index of Globalization
60
30 40 50
Year
1970 1975 1980 1985 1990 1995 2000 2005
Source: Author’s calculation using data from Axel Dreher, Does Globalization Affect Growth? Empirical Evidence from a New Index, Applied Economics, Vol. 38, No. 10 (2006).
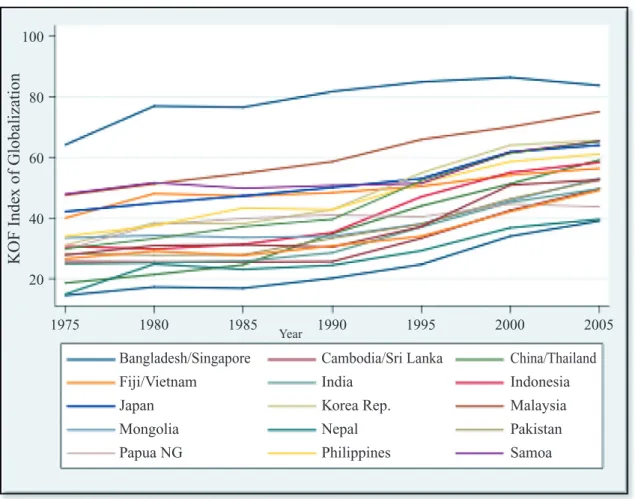
Figure 3 shows the country-level trends of globalization in Asia. As a huge continent lack- ing a clear-cut common defi nition, Asia in this study includes both East Asia and the Pacifi c and South Asia.25 Thus, it includes some Pacifi c countries but excludes Central Asia and Arab regions as these areas are much more integrated with Europe and North Africa than with East and South Asia. The study considers all the countries from East Asia and the Pacifi c and South Asia, for which all required data are available, but excludes Australia and New Zealand because these countries have had nearly the same human development levels as Japan (the benchmark country of this study) since 1975 (the base year).26 As can be seen in Figure 3, globalization trends are not very different among Asian countries. However, poorer countries such as Nepal and Bangladesh appear to be on low levels of globalization. As expected, newly industrialized countries, such as Singapore and the Republic of Korea (South Korea) have higher levels of globalization. Surpris- ingly, these countries are marked by even higher levels of globalization than Japan, the second largest economy in the world in terms of real GDP value.
Figure 3. Globalization Trends of Selected Asian Countries (1975-2005)
1975 1980 1985 1990 1995 2000 2005
Year
Bangladesh/Singapore Fiji/Vietnam
Japan Mongolia Papua NG
Cambodia/Sri Lanka India
Korea Rep.
Nepal Philippines
China/Thailand Indonesia Malaysia Pakistan Samoa
KOF Index of Globalization
80 100
40
20 60
Source: Author’s calculation using data from Axel Dreher, Does Globalization Affect Growth? Empirical Evidence from a New Index, Applied Economics, Vol. 38, No. 10 (2006).
The main dependent variable of this study is human QOL. Considering the popularity as well as availability of data, the present study uses the Human Development Index (HDI) devel- oped by the United Nations Development Program (UNDP). Although HDI does not include all the aspects of human QOL, it broadly summarizes the level of human QOL in a single in- dicator.27 According to the Human Development Report 2007/08, the HDI involves three key sub-constructs with corresponding measures: health or longevity (measured by life expectancy at birth indicators), knowledge or education (measured by adult literacy rates and combined
enrollment ratios), and an adequate standard of living or income (measured by adjusted per capita income in dollar purchase power parity terms).28(See a detailed explanation of the indexes in Appendix II.)
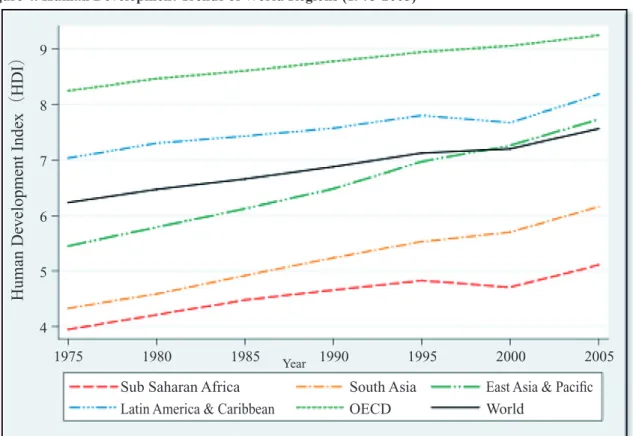
Figure 4. Human Development Trends of World Regions (1975-2005)
1975 1980 1985 Year 1990 1995 2000 2005
Sub Saharan Africa Latin America & Caribbean
South Asia OECD
East Asia & Pacifi c World
Human Development Index(HDI)
7 9
8
5
4 6
Source: Author’s calculation using data from UNDP, Human Development Reports, various years.
Figure 4 presents the trends of HDI across world regions from 1975 to 2005. The general observation is that Sub-Saharan Africa has the lowest HDI, followed by South Asia (SAS). This fact is consistent with globalization trends. Notably, the East Asia and the Pacifi c (EAP) region took a more rapid pace of HDI growth from the beginning of the 1990s and surpassed the global average around the beginning of the 21st century. This is because of its high and shared economic growth as per the World Bank.29
To give a detailed picture of HDI trends in the Asia-Pacifi c region, the trends for each se- lected country are drawn in Figure 5. The graph shows that all the countries have an increasing trend of human development over time, though a few countries show some fl uctuations and oth- ers exhibit steady trends. Interestingly, poor countries have a more rapid growth of HDI. This fi nding gives a general impression of convergence of human QOL in the region. The next section demonstrates the trends of convergence more concretely.
Figure 5. Human Development Trends of Selected Asian Countries (1975-2005)
1975 1980 1985 1990 1995 2000 2005
Year
Bangladesh/Singapore Fiji/Vietnam
Japan Mongolia Papua NG
Cambodia/Sri Lanka India
Korea Rep.
Nepal Philippines
China/Thailand Indonesia Malaysia Pakistan Samoa
Human Development Index(HDI)
6 10
8
2 4
Source: Author’s calculation using updated data from UNDP, Human Development Report 2007/08.
3. Is Human QOL Converging in Asia?
The mainstream literature on convergence argues that globalization raises the living stan- dard of all participants in the globalization process. Theoretically, increased international trade raises the real incomes of all participating countries. Accessing the superior technology embodied in goods or capital, or simply through intellectual exchange, allows greater productivity gains in poorer countries. Similarly, international capital fl ows bring new technology and allow countries to tap into a larger savings pool, which helps the poor more. Finally, the free fl ow of labor force also contributes to convergence, as people from poor countries migrate to richer nations. A num- ber of empirical papers on convergence support this view. For example, Baumol, and Baumol and Wolff tested for the convergence among industrialized countries over the period of a century beginning in 1870.30 Other notable papers are on the convergence among OECD countries and among individual U.S. states,31 among European Community members,32 among European re- gions,33 among Spanish provinces,34 and so forth. As economic theory suggests, all these papers have shown income convergence.
However, many other scholars show diverging trends of income and human QOL. For example, Maddison and Pritchett demonstrated the historical process of income divergence.35 However, they did not fully contradict the mainstream belief of a strong causal link between globalization and income convergence because a major diversion was created by the discrete technological breakthroughs of the Industrial Revolution. Also, the income divergence among countries over the last 20 years was explained by the fact that globalized countries were attempt- ing to reach the same industrial standards, and those who did not globalize were left behind.36 Nevertheless, there are also strong counter-arguments that question the convergence hypothesis
as the world is becoming more unequal in terms of per capita income. Indeed, looking back over the last 100 years or so, initially poorer countries have tended to experience lower subsequent growth rates.37 Poor countries are not catching up with rich ones; rather, it seems the opposite has been happening. For example, Ravalian showed that the average income of the richest countries in the world was about 10 times that of the poorest around the end of the nineteenth century but is closer to 60 times higher today.38 Furthermore, Milanovic argued that inequality between coun- tries increased sharply since the beginning of the 1980s.39
The convergence literature is not very focused on the Asian region. Instead, the focus is generally on groups of countries that have similar characteristics, such as OECD countries, Eu- ropean countries, or American states. In addition, the convergence literature concentrates heavily on the income aspect. Although there are several papers that deal with the convergence of human QOL,40 most of them tend to use disaggregated factors of QOL, which cannot give an overall picture of human QOL. For instance, Kenney analyzed the convergence of income, health, and education separately for the East Asian countries.41 Ram studied the cross-country inequality of calorie supply, life expectancy, and adult literacy, and found that the inequality of these indica- tors across the world was minimal compared to income inequality.42 Ingram found that there was strong evidence of convergence in life expectancy, caloric intake, primary enrollment ratios, and urbanization—fairly strong evidence of convergence.43 All of the studies, however, fail to con- sider the overall human QOL as a dependent variable, even though the single index of human development has been available since 1990.
Conventional methodology for testing the convergence hypothesis is also critically ques- tioned. Ravallian pointed out that methodological differences and data type and quality variations are the main causes of different findings and arguments on convergence.44 More importantly, Quah theoretically rejected using the so-called sigma, coeffi cient of variation and beta conver- gence.45 Sigma convergence is defi ned as decline over time of the cross-sectional dispersion of a variable, which can be measured by looking at the size of standard deviation. For variables that trend upward (or downward) across the world over time, it is argued, the coeffi cient of variation (standard deviation divided by the mean) might provide a better refl ection of convergence or di- vergence. A third conventional approach is the beta convergence, which is used frequently in the literature on cross-country economic growth. Beta convergence is defi ned if the variable displays mean reversion, meaning that the value of a variable at the start is inversely correlated with its growth over that period. Quah’s point is valid as he showed how results were misleading because of the famous Galton’s fallacy of regression towards the mean.46 Thus, as Quah suggests, this study follows an alternative method, which is more transparent about whether convergence oc- curs or does not occur. However, the study does not take Quah’s model as it is; instead, it follows his wisdom.
First, this study directly calculates the human QOL indicator gap between each country and the benchmark country over time. As the most developed country in Asia, the study takes Japan as the benchmark country to calculate the human QOL gaps, which are also taken as the depen- dent variables for regression analysis. Symbolically, the human QOL gaps between Japan and each country are calculated using simple mathematics as follows:
∆γct = γjt ― γct ... (1) where, ∆γct is the difference in a particular human QOL indicator between Japan and country c at year t; γjt is Japan’s human QOL indicator at year t; and γct is country c’s human QOL indicator at time t.
The calculated human QOL indicator gaps between Japan and each country for each fi ve- year interval are plotted as lines-graphs to observe convergence (or divergence). First, the HDI
gaps are calculated as the overall measure of human QOL and then the gaps in individual ele- ments of HDI are assessed. As can be seen in Figure 6, most of the countries are catching up with Japan in terms of human development. The trend line for Japan is constant with 0 value because the line represents the difference of HDI value with Japan itself. For almost all other countries, trend lines of this HDI gap are sloping downward, meaning that the gap with Japan is closing.
Clearly, human QOL in Asia is converging.
Figure 6. Trends of HDI-Gaps of Asian Countries with Japan (1975-2005)
Bangladesh/Singapore Fiji/Vietnam
Japan Mongolia Papua NG
Cambodia/Sri Lanka India
Korea Rep.
Nepal Philippines
China/Thailand Indonesia Malaysia Pakistan Samoa
1975 1980 1985 1990 1995 2000 2005
Year 6
2
0 4
HDI difference between Japan and the respective country
Source: Author’s calculation using data from UNDP, Human Development Reports, various years.
If we see the trends of each individual country, the pace of catching up is rapid for many countries. For instance, Singapore and South Korea are catching up quickly and nearly reaching the full convergence stage with Japan. This can be explained by their very high level of global- ization (see Figure 3 for respective globalization trends). Similarly, countries with a higher initial gap also tend to have a rapid pace of catching up. Nepal and Bangladesh fall in this category.
However, in spite of having a higher initial HDI gap, Cambodia and Papua New Guinea are slow to catch up. On the other hand, the Philippines and Samoa also have very slow trends, despite having relatively low initial HDI gaps with Japan. Thus, based on this analysis, we can conclude that the Asian-Pacifi c countries are converging in terms of HDI.
The remaining part of this section presents the convergence (or divergence) of individual components of HDI. Although there is a clear convergence of HDI, some of the individual variables are converging and some are not. For example, the health indicator, measured by life expectancy at birth, is converging as shown in Figure 7. Similarly, one of the major education in- dicators used to construct HDI, adult literacy, is also found converging (Figure 8). As in the case of HDI, the speed of convergence is higher for some countries, such as Nepal, Bangladesh, and Vietnam. On the contrary, another indicator of education, gross school enrollment from primary
to tertiary level, is neither converging nor diverging (Figure 9). Some countries, such as Singa- pore, the Philippines, Bangladesh, and Nepal, were able to narrow their gaps with Japan, whereas gaps grew for Papua New Guinea, Cambodia, and Mongolia, among others. Interestingly, South Korea fully converged with Japan around 1992 and crossed over the benchmark in terms of gross school enrollments.
Figure 7. Trends of the “Life Expectancy at Birth”-Gaps with Japan (1975-2005)
Bangladesh/Singapore Fiji/Vietnam
Japan Mongolia Papua NG
Cambodia/Sri Lanka India
Korea Rep.
Nepal Philippines
China/Thailand Indonesia Malaysia Pakistan Samoa
1975 1980 1985 1990 1995 2000 2005
Year 40
30
10
0 20
Llife expentancy at birth-gap with Japan
Source: Author’s calculation using data from UNDP, Human Development Reports, various years.
Supporting the existing literature, Figure 10 shows that the income aspect of human QOL is diverging in Asia. The gap between the benchmark country Japan and the other countries is increasing sharply. Exceptionally, Singapore converged with Japan around 1992, and the rapid growth continued so that the gap increased sharply, leaving Japan far behind. Overall, the gap was raised sharply during the period of 1980-1990. Since then, the gap increased continuously for all the countries except South Korea.
Based on this simple and transparent assessment, the overall measure of human QOL in terms of HDI in Asia was found to be converging. The health aspect of QOL was also converging, but the education aspects of QOL showed mixed results, with adult literacy converging and gross school enrollment neither converging nor diverging. On the contrary, the income aspect of human QOL measured by GDP per capita was sharply diverging.
The following section assesses the impact of globalization on these convergence and divergence trends, which is the main question of interest in the present study.
Figure 8. Trends of the “Adult Literacy”-Gaps with Japan (1975-2005)
Bangladesh/Singapore Fiji/Vietnam
Japan Mongolia Papua NG
Cambodia/Sri Lanka India
Korea Rep.
Nepal Philippines
China/Thailand Indonesia Malaysia Pakistan Samoa
1975 1980 1985 1990 1995 2000 2005
Year 80
60
20
0 40
Adult literacy-gap with Japan
Source: Author’s calculation using data from various Human Development Reports by UNDP
Figure 9. Trends of the “Gross School Enrollment”-Gaps with Japan (1975-2005)
Bangladesh/Singapore Fiji/Vietnam
Japan Mongolia Papua NG
Cambodia/Sri Lanka India
Korea Rep.
Nepal Philippines
China/Thailand Indonesia Malaysia Pakistan Samoa
1975 1980 1985 1990 1995 2000 2005
Year 60
20
0
-20 40
Gross school enrollment-gap with Japan
Source: Author’s calculation using data from UNDP, Human Development Reports, various years.
Figure 10. Trends of the “GDP Per Capita”-Gaps with Japan (1975-2005)
Bangladesh/Singapore Fiji/Vietnam
Japan Mongolia Papua NG
Cambodia/Sri Lanka India
Korea Rep.
Nepal Philippines
China/Thailand Indonesia Malaysia Pakistan Samoa
1975 1980 1985 1990 1995 2000 2005
Year 30000
10000
0
-10000 20000
GDP per capita-gap with Japan(USS)
Source: Author’s calculation using the World Development Indicators online database of the World Bank (ac- cessed August 27, 2009)
4. Has Globalization Affected Human QOL Convergence?
This section addresses the main question of this study. It estimates combined cross-section time-series regressions using the human QOL-gaps of each country with Japan for each period (as reported in the previous section) as the dependent variables. These variables are calculated using the HDI values and the individual components of HDI as reported in the UNDP’s Human Development Reports, which are publicly available on the UNDP home page. HDI is based on the achievement of three basic aspects of human QOL: health, education and income. A detailed explanation of HDI and its components is presented in Appendix II. All data are taken over fi ve- year intervals from 1975 to 2005. Similarly, the KOF Index of Globalization is the main explana- tory variable, which is taken from Dreher, 2006. A detailed explanation of the KOF Index is given in Appendix I.
As some data are not available for all countries in the region, only 19 countries have been selected, and the panel is strongly balanced, meaning that most of the data are available for the selected countries for all the periods. However, as the value of all dependent variables (human QOL-gap) for Japan is 0 over the period, Japan is excluded from the regression analysis.
The regression estimation model is as follows:
it t
i it
it it
it y G C
y = α + β −1 + γ ' + η ' + +η + η + ε ... (2) where y represents the difference between the human QOL-gaps between Japan and the specifi c county (i) in specifi c time (t), yit-1 is the lagged dependent variable, G represents the measures of
globalization (negative and positive coeffi cient of G explains the convergence and divergence ef- fect respectively), C represents the vector of control variables, ηi is the country fi xed effect, ηt is the period fi xed effect, and ε is an error term.
The lagged dependent variable is included because HDI-inequality tends to change slowly over time. However, it creates several serious methodological problems. Given the inclusion of the lagged dependent variable and fi xed country effects, the OLS estimator is biased and incon- sistent in short panels.47 To deal with this problem, the analysis uses the system GMM (generalized method of moments) estimator, as suggested by Arellano and Bover, and Blundell and Bond.48 Results are based on the one-step estimator implemented by Roodman, which is explained in de- tail by Roodman in Stata,49 including Windmeijer’s fi nite sample correction.50
In choosing the set of control variables, the study follows standard practice as much as possible. All the control variables and their precise defi nitions and data sources are listed in Ap- pendix III. First, it includes GDP per capita at the initial point of each 5 year-period to capture the effect of the initial level of development on convergence. It also includes the share of the under-15 year-olds and the over-64 year-olds relative to the total population (referred to as the age-dependency ratio ). This ratio controls for demographic factors and is expected to vary positively with the HDI gap with richer countries. Similarly, overall and urban population growth rates are taken as they affect human QOL signifi cantly. It is expected that the overall population growth rate correlates positively and urban population growth rates negatively to the QOL-gaps.
Similarly, irrigated land in percent of total cropland, electricity consumption per capita, and annual growth rate of manufacturing sector value added are also included as control variables.
Irrigated land captures the effect of agricultural infrastructure, which is assumed to be an impor- tant factor to uplift millions of poor that mostly depend on subsistent agriculture. Electricity con- sumption per capita is expected to affect human QOL positively as it is one of the key elements to make human life easier and more efficient. Manufacturing value added is one of the main indicators of industrialization, which is supposed to be crucial in improving people’s lives by cre- ating employment and producing cheaper goods. The data on these variables are taken from the WDI online database of the World Bank.
Finally, democracy indicator is used to gauge the effect of political as well as social liberty on human QOL and is expected to have a converging impact on human QOL. Indeed, there is a positive relationship between democracy and human QOL.51 The measures of democracy are taken from Freedom House and are available for 1972-2008.52 The democracy index consists of two key rights. Firstly, the political rights measure is a subjective indicator that annually ranks each country on a scale from one (the highest level of political rights) to seven (the lowest level).
Secondly, the civil liberties measure is used to capture personal rights such as those to free ex- pression and to organize or demonstrate and is placed on the same scale from one to seven. These two Freedom House measures of democracy are averaged and normalized to range from 0 to 100, with 100 representing full democracy.
The time dummies are included in the equation and it is revealed that time and country fi xed effects are jointly signifi cant but the results are omitted from the result tables. The variables are logged if they have absolute values. The percentage form and index numbers are not logged. The descriptive statistics and the correlation matrix are reported in Appendix IV and Appendix V, re- spectively.
Tables 1 to 5 report the results, each table for each dependent variable. In Column [1], re- sults come from regressing all the three indexes of globalization (economic, social, and politi- cal) including the control and lag dependent variables. In Column [2], a single index of overall globalization is regressed instead of three separate indexes. The magnitude and the sign of the coeffi cients explain the strength and the direction of the effect of regressors, respectively. Thus, the negative sign of a coeffi cient means convergence effect and vice versa. The three, two, and
one asterisks (***, **, and *) denote the signifi cance of the coeffi cients at 1%, 5%, and 10%, respectively. The standard errors are reported in parentheses.
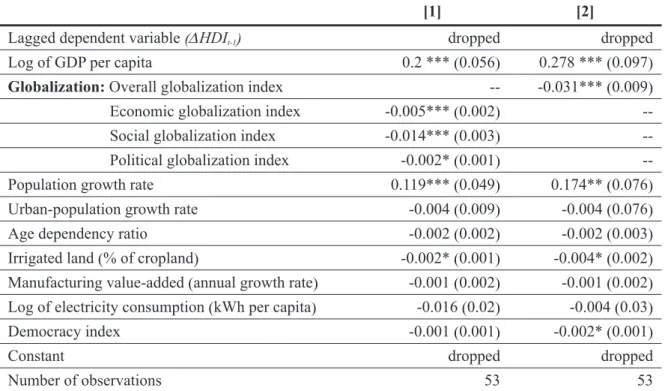
In Table 1, the dependent variable is HDI, which measures the overall human QOL. The results show that the HDI gap narrows with globalization, with the coeffi cient being signifi cant at 1% level for economic, social as well as overall globalization and just at 10% for political globalization. This confi rms that globalization helps to increase the human QOL more in poorer countries than in richer ones, resulting in HDI convergence. This result is consistent with the theoretical arguments by Sirgy et al. and the empirical fi ndings by Tsai on the positive impacts of globalization on human QOL.53
Table 1: Globalization and Human Development Gaps (1975-2005)
Dependent variable: HDI-gap with Japan (∆HDIct﹦HDIjt - HDIct)
[1] [2]
Lagged dependent variable (∆HDIt-1) dropped dropped
Log of GDP per capita 0.2 *** (0.056) 0.278 *** (0.097)
Globalization: Overall globalization index -- -0.031*** (0.009)
Economic globalization index -0.005*** (0.002) --
Social globalization index -0.014*** (0.003) --
Political globalization index -0.002* (0.001) --
Population growth rate 0.119*** (0.049) 0.174** (0.076)
Urban-population growth rate -0.004 (0.009) -0.004 (0.076)
Age dependency ratio -0.002 (0.002) -0.002 (0.003)
Irrigated land (% of cropland) -0.002* (0.001) -0.004* (0.002) Manufacturing value-added (annual growth rate) -0.001 (0.002) -0.001 (0.002) Log of electricity consumption (kWh per capita) -0.016 (0.02) -0.004 (0.03)
Democracy index -0.001 (0.001) -0.002* (0.001)
Constant dropped dropped
Number of observations 53 53
Notes: Dynamic panel one step system GMM estimations are reported. Standard errors are in parentheses. ***,
**, and* denote the signifi cance of the coeffi cients at 1%, 5%, and 10%, respectively.
Sources: Globalization data are taken from Dreher (2006) (http://globalization.kof.ethz.ch/); GDP per capita (current US$), population growth rate, urban-population growth rate, age dependency ratio, irrigated land, manufacturing sector value-added, and electricity consumption per capita are taken from the World Development Indicators (WDI) online database of the World Bank; democracy index is calculated from the data of the Freedom House website (http://www.freedomhouse.org/); and human development index (HDI) is taken from UNDP, Human Development Report (updated online version of HDR 2007/08). The data cover the period from 1975 to 2005 in 5-year intervals.
The impacts of the control variables are mixed and consistent for both columns. The lag dependent variable is dropped due to a high degree of collinearity with the dependent variable.
Unexpectedly, the HDI gap with Japan rises with higher GDP per capita and the coeffi cient is significant at 1%. This correlation might be explained by the increasing income inequality as shown in Figure 10. Other results are as expected. Population growth has a diverging effect on human QOL with the coeffi cients signifi cant at 1% and 5% level for Column [1] and Column [2], respectively. As expected, the population growth and age dependency ratio are found to have diverging effects on human QOL. The effects are statistically signifi cant at the 1% level. This as- sessment shows the importance of controlling the demography of the country to improve human QOL.
On the contrary, although the signifi cance level is weak (at 10%), irrigated land and democ- racy index have converging effects on QOL. This relationship indicates that the agricultural in- frastructure is important in reducing the QOL-gap as most of the poorer countries, and their poor households, are highly dependent on agriculture. If the governments of poor countries cannot provide alternative employment through industrialization, the improvement of the agricultural sector is required to uplift the quality of life of their people. Similarly, democracy provides an opportunity for people to control their own futures and hopefully improve their quality of life.
Indeed, no one can make a better decision than the people themselves about their lives. Democ- racy’s signifi cant impact on the converging process of human QOL further reconfi rms both the theories and empirics that suggest democracy as one of the vital factors in improving the life of poor people in any country.
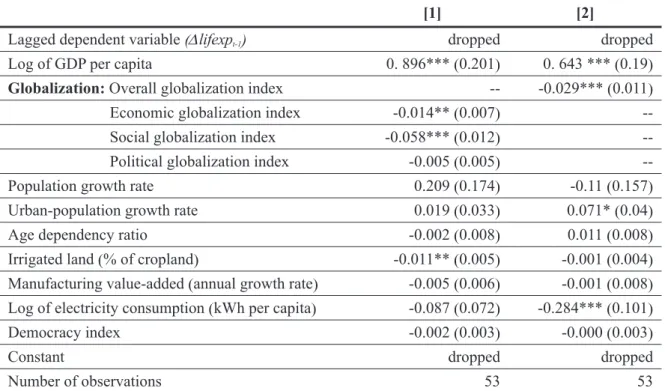
Table 2: Globalization and “Life Expectancy at Birth”-Gaps (1975-2005)
Dependent variable: Log of life expectancy at birth -gap with Japan (∆lifexpct﹦lifexpjt - lifexpct)
[1] [2]
Lagged dependent variable (∆lifexpt-1) dropped dropped
Log of GDP per capita 0. 896*** (0.201) 0. 643 *** (0.19)
Globalization: Overall globalization index -- -0.029*** (0.011)
Economic globalization index -0.014** (0.007) --
Social globalization index -0.058*** (0.012) --
Political globalization index -0.005 (0.005) --
Population growth rate 0.209 (0.174) -0.11 (0.157)
Urban-population growth rate 0.019 (0.033) 0.071* (0.04)
Age dependency ratio -0.002 (0.008) 0.011 (0.008)
Irrigated land (% of cropland) -0.011** (0.005) -0.001 (0.004) Manufacturing value-added (annual growth rate) -0.005 (0.006) -0.001 (0.008) Log of electricity consumption (kWh per capita) -0.087 (0.072) -0.284*** (0.101)
Democracy index -0.002 (0.003) -0.000 (0.003)
Constant dropped dropped
Number of observations 53 53
Notes: Dynamic panel one step system GMM estimations are reported. Standard errors are in parentheses. ***,
**, and* denote the signifi cance of the coeffi cients at 1%, 5%, and 10%, respectively.
Sources: See Table 1.
Disaggregated analyses of the human QOL are presented in Table 2 to Table 5. Each vari- able̶health, education, and income̶is a dependent variable in each table. These analyses not only testify to the impact of globalization on each aspect of human QOL, but also check the va- lidity of the methodology that is applied in this study. In Table 2, log of life expectancy at birth is taken as a dependent variable. As in Table 1, a lag dependent variable is dropped for both columns. The impact of overall and social globalization on the convergence of life expectancy at birth has been found to be signifi cant at 1%, whereas economic globalization is signifi cant at 5%.
Political globalization has no signifi cant effect on the convergence process.
The control variables have mixed impacts. As in Table 1, GDP per capita has a diverging effect at 1% level for both columns. Irrigated land has been found to have a signifi cant converging effect at 5% in Column [1], and the urban-population growth and electricity consumption are also signifi cant in reducing the gap at 10% and 1% in Column [2]. The effects of the remaining control variables are not signifi cant. However, the overall results are consistent with the case of HDI in Table 1.
Table 3: Globalization and “Adult Literacy”-Gap (1975-2005)
Dependent variable: Log of adult literacy -gap with Japan (∆adultlrct﹦adultlrjt - adultlrct)
[1] [2]
Lagged dependent variable (∆adultlrt-1) dropped dropped
Log of GDP per capita 0. 916*** (0.381) 1. 488** (0.644)
Globalization: Overall globalization index -- -0.113** (0.05)
Economic globalization index -0.04*** (0.015) --
Social globalization index -0.035 (0.023) --
Political globalization index -0.023*** (0.008) --
Population growth rate 0.977*** (0.349) 1.93*** (0.667)
Urban-population growth rate -0.018 (0.089) -0.017 (0.129)
Age dependency ratio -0.011 (0.02) -0.011 (0.029)
Irrigated land (% of cropland) -0.008 (0.009) 0.013 (0.014)
Manufacturing value-added (annual growth rate) 0.014 (0.017) 0.022 (0.023) Log of electricity consumption (kWh per capita) -0.436** (0.209) -0.547** (0.283)
Democracy index -0.019*** (0.007) -0.018** (0.01)
Constant dropped dropped
Number of observations 53 53
Notes: Dynamic panel one step system GMM estimations are reported. Standard errors are in parentheses. ***,
**, and* denote the signifi cance of the coeffi cients at 1%, 5%, and 10%, respectively.
Sources: See Table 1.
Table 3 reports the impact of globalization on adult literacy gaps. The main results are con- sistent with the previous two tables. Globalization has a converging effect with high degree of signifi cance. The main difference is that political globalization is signifi cant to reduce the literacy gap at 1%, and social globalization is not signifi cant. This can be attributed to the fact that the el- ements of political globalization, such as international non-governmental organizations (INGOs), multilateral organizations as well as bilateral donor agencies, are playing signifi cant roles in edu- cation, particularly with respect to informal education compared to the role of national govern- ments.
As for the control variables, GDP per capita and population growth have highly signifi cant diverging effects, as expected. Electricity consumption is found to be signifi cant in reducing the literacy gaps at 5% for both columns. In fact, access to electricity, particularly in rural areas, greatly improves the study environment for students.
In the case of democracy, the result reconfi rms the fi ndings of Frey and Al-Roumias; de- mocracy index is signifi cant in reducing the adult literacy gap at 1% in Column [1] and 5% in Column [2]. The effects of the remaining control variables are not signifi cant. These results are also highly consistent with the case of HDI in Table 1.
Table 4: Globalization and “Gross School Enrollment”-Gaps (1975-2005)
Dependent variable: Log of gross school enrollment -gap with Japan (∆enrollct﹦enrolljt - genrollct)
[1] [2]
Lagged dependent variable (∆genrollt-1) 01.116*** (0.297) 1.343*** (0.354)
Log of GDP per capita 0.000 (0.000) 0.000 (0.000)
Globalization: Overall globalization index -- -0.043 (0.029)
Economic globalization index -0.037* (0.019) --
Social globalization index 0.033 (0.025) --
Political globalization index -0.001 (0.006) --
Population growth rate dropped dropped
Urban-population growth rate -0.055 (0.06) -0.093 (0.074)
Age dependency ratio 0.014 (0.009) 0.01 (0.01)
Irrigated land (% of cropland) -0.013* (0.007) -0.004 (0.005)
Manufacturing value-added (annual growth rate) 0.002 (0.009) -0.003 (0.01)
Log of electricity consumption (kWh per capita) dropped dropped
Democracy index -0.01 (0.006) -0.006 (0.005)
Constant dropped dropped
Number of observations 49 49
Notes: Dynamic panel one step system GMM estimations are reported. Standard errors are in parentheses. ***,
**, and* denote the signifi cance of the coeffi cients at 1%, 5%, and 10%, respectively.
Sources: See Table 1.
The dependent variable for Table 4 is gross school enrollment—another education-related indicator—used to construct HDI. Gross school enrollment is the combined enrollment from pri- mary to tertiary level education. In this case, lag dependent variable is signifi cant in increasing the gap at 1% level for both columns. However, GDP per capita is not signifi cant.
Surprisingly, only economic globalization is found to have a converging effect at 10% level.
The other kinds of globalization and overall globalization are insignifi cant. Control variables are also found not to be signifi cant save for irrigated land, which has a signifi cant converging effect at 10% level, but only in Column 1. These results indicate that school enrollment is affected more by the domestic policies rather than globalization. Further analysis is essential to explore this issue.
The result for this particular dependent variable is different from that of previous dependent variables; in fact, gross school enrollment has been found neither converging nor diverging (Figure 9).
However, it is interesting to fi nd the signifi cant converging effect of democracy on school enrollment. This result is consistent with the findings of Brown, who empirically showed the positive impact of democracy on primary school enrollment.54
Table 5: Globalization and “GDP Per Capita”-Gap (1975-2005) Dependent variable: Log of GDP per capita gap with Japan (∆gdppcpct﹦gdppcpjt - gdppcpct)
[1] [2]
Lagged dependent variable (∆gdppcpt-1) 1.022*** (0.009) 1.028*** (0.009)
Globalization: Overall globalization index -- -0.001 (0.001)
Economic globalization index 0.001 (0.001) --
Social globalization index -0.001 (0.001) --
Political globalization index 0.001* (0.001) --
Population growth rate -0.004 (0.019) 0.007 (0.019)
Urban-population growth rate -0.008** (0.004) -0.007** (0.004)
Age dependency ratio 0.001 (0.001) 0.001 (0.001)
Irrigated land (% of cropland) -0.001** (0.001) -0.001*** (0.001) Manufacturing value-added (annual growth rate) -0.002*** (0.001) -0.002*** (0.001) Log of electricity consumption (kWh per capita) 0.009 (0.008) 0.005 (0.009)
Democracy index -0.001** (0) -0.001*** (0)
Constant dropped dropped
Number of observations 53 53
Notes: Dynamic panel one step system GMM estimations are reported. Standard errors are in parentheses. ***,
**, and* denote the signifi cance of the coeffi cients at 1%, 5%, and 10%, respectively.
Sources: See Table 1.
Finally, Table 5 presents the results for GDP per capita, the income measure of human QOL, as a dependent variable. As in Table 4, the lag dependent variable is signifi cant at the 1% level in increasing the income gap. This means that the initial level of GDP per capita is a very good predictor of future income levels. This phenomenon leads to income divergence. In fact, a clear divergence is found by this study (see Figure 10 in the previous section).
However, globalization has no significant impact on the rising income gap in Asia. The result shows that only political globalization has a diverging effect at the 10% level. This is consistent with many existing studies, which claim that although the world income inequality is rising sharply, it is not the effect of globalization that is changing it; instead, it is the lack of globalization in poorer countries.55
The impact of control variables, however, is quite interesting. As expected, urban population growth has a signifi cant convergence impact on GDP per capita at the 5% level for both columns.
Indeed, urbanization leads to better living conditions, offering better facilities and opportunities compared to rural areas. Irrigated land and manufacturing sector value-added are also highly signifi cant in reducing income gaps in both cases. Expanding irrigated land generates higher ag- ricultural productivity and increasing the share of manufacturing value-added to GDP enhances technological advancement, industrial productivity and also generates more employment in poor- er countries, which ultimately leads to reduced income gaps. Finally, as the existing literature suggests,56 democracy is highly signifi cant in reducing income gaps. It is signifi cant at the 5%
and 1% levels for Column [1] and Column [2], respectively.
Overall, although the converging effect of globalization is found insignificant for gross school enrollment and GDP per capita, the effects are highly signifi cant for the other variables.
More importantly, the effect is highly significant in reducing the overall human QOL conver- gence in terms of HDI. Although the income inequality is rising, the growing level of globaliza- tion helps to reduce the gap in the overall quality of life for the people of Asia.
5. Conclusion
In the context of contradicting arguments on the convergence hypothesis, the results of this study reveal that globalization has signifi cantly reduced the gap between the rich country Japan and the rest of the selected Asian and some Pacifi c countries in terms of human QOL. The results reconfi rm the convergence hypothesis as far as the human development index and the health and education indicators are concerned. The results are also supported by Sab and Smith’s fi ndings about education and health convergence from 1970 to 1996.57 Even though GDP per capita is found diverging, globalization does not have a signifi cant effect on this diverging trend. Instead, most of the control variables are found to have converging effects. Thus, what are the factors that are playing a vital role in income divergence? Further analysis is needed to explore this issue.
Similarly, in spite of the sharply diverging trend of GDP per capita, there is a visible con- vergence of HDI. It is more dichotomous when considering the literature on the relationship of income with health and education. However, the economic theory of diminishing marginal return of the health and education expenditure explains this dichotomy. Furthermore, even if poorer countries gain less income than richer ones, they can improve their people’s health and education level at a faster pace.
It is more important to fi nd the signifi cant impact, as we did in this study, of globalization on this convergence process because many politicians, policymakers, social organizations, ac- tivists, and some academics criticize globalization for increasing income inequality. Of course, income is one of the leading measures of human QOL, but health and education are also equally,
and sometimes more, important. Income is just a means of life, but arguably, health and educa- tion are ends or goals in life. Therefore, it is argued here that convergence in human QOL matters more than convergence in income.
Furthermore, in the context of growing discussion as well as initiatives for Asian regional integration and debate on regionalism versus globalization, the fi ndings of this study support the view that globalization accelerates regional integration by reducing the human QOL gap between the rich and poor countries in the region. Intuitively, the high level of developmental gap is one of the main obstacles for regional integration in Asia. Thus, anything that is converging has a favor- able impact on the regional integration process.
What are the policy implications of these findings? Clearly, both rich and poor countries should promote globalization. In view of the questions being raised about the effectiveness of development aid,58 and the clear fi ndings of the converging effect of globalization, rather than providing more aid, richer countries should be more open towards poorer countries, particularly the low-income countries.
This study is not enough to offer specifi c policy recommendations, and to do so the author calls for a study of some country cases; more specifi cally, for an assessment of the impact of glo- balization on human QOL convergence within countries. Such studies will facilitate the develop- ment of policy recommendations tailored towards countries in their own cultural contexts for the purpose of promoting their globalization with a positive (or at least neutral) impact on the reduc- tion of human QOL gaps within them.
Notes
1 The preliminary version of this paper was presented at the Summer Institute on Regional Integration 2009, organized by the Global Institute for Asian Regional Integration (GIARI), Waseda University.
The author is highly indebted to the professors and participants whose comments and suggestions dur- ing and after the presentation have been instrumental in writing and refi ning this article. Sincere thanks go to Prof. Shujiro Urata, Prof. Shunji Matsuoka, Prof. Tsuneo Akaha, Prof. Vinod K. Aggarwal, Prof.
Kazuhiko Yokota, Prof. Kyosuke Kurita, Dr. Giovanni Capannelli, Dr. Stephen R. Nagy, and also to the anonymous referees for thorough comments. The author also thanks Ms. Sonia Aggarwal, an intern at GIARI, for proofreading and English editing. Finally, wholehearted thanks go to the Waseda University Global COE Program, GIARI, and its Program Leader Prof. Satoshi Amako for the generous funding and encouragement for conducting this research project.
2 Shujiro Urata, Globalization and the Growth in Free Trade Agreements, Asia-Pacifi c Review, Vol. 9, No. 1 (2002), pp. 20-32; Axel Dreher, Neol Gaston, and Pim Martens, Measuring Globalization - Gaug- ing Its Consequence, New York: Springer, 2008.
3 Dennis A. Rondinelli and John M. Heffron, Adjusting to Globalization: Change and Transformation in Asia, in D.A. Rondinelli and J. M. Heffron, eds., Globalization and Change in Asia, Boulder, Colo- rado: Lynne Rienner, 2007, pp. 1-13.
4 Branko Milanovic, Worlds Apart: Global and International Inequality, 1950–2000, Princeton, NJ:
Princeton University Press, 2005.
5 World Bank, The East Asian Miracle: Economic Growth and Public Policy, Washington, D.C.: World Bank, 1993.
6 After the publication of East Asian Miracle by the World Bank in 1993, the phrase became one of the best known in development studies. It is because of the region’s fast growth in the past three decades.
The economies of Japan and the Newly Industrializing Economies (NIEs) of Hong Kong, Singapore, Korea, and Taiwan are still considered models of development for other countries. For details, see Sha- hid Yusuf, The East Asian Miracle at the Millennium, in Joseph E. Stiglitz, and Shahid Yusuf, eds., Rethinking the East Asian Miracle, Oxford University Press, 2001, pp. 1-39.
7 Geoffrey Garrett, The Causes of Globalization, Comparative Political Studies, Vol. 33, No. 6-7 (2000), pp. 941-991; Emmanuel Nyahoho, Globalization and Economic Goals, The Journal of Social, Political, and Economic Studies, Vol. 26 (2001), pp. 543-568; Axel Dreher, Does Globalization Af-
fect Growth? Empirical Evidence from a New Index, Applied Economics, Vol. 38, No. 10 (2006), pp.
1091-1110.
8 Joseph E. Stiglitz, Making Globalization Work, New York: W.W. Norton, 2006, pp. xxvi and 358; Ama- rtya Sen, A Decade of Human Development, Journal of Human Development and Capabilities: A Multi-Disciplinary Journal for People-Centered Development, Vol. 1, No. 1 (2000), pp. 17-23.
9 Charles Kenny, There’s More to Life Than Money: Exploring the Levels/Growth Paradox in Income and Health, Journal of International Development, Vol. 21, No. 1 (2009), pp. 24-41.
10 Charles Kenny, What’s Not Converging? East Asia’s Relative Performance in Income, Health, and Education, Asian Economic Policy Review, Vol. 3 (2008), pp. 19-37.
11 John Beynon and David Dunkerley, eds., Globalization: The Reader, New York: Routledge, 2000;
Emma Bircham and John Charlton, eds., Anti Capitalism: A Guide to the Movement, London: Book- marks, 2001; Department for International Development (DFID), Making Globalization Work for the Poor, DFID White Paper, London: HMSO, 2000; Kevin Watkins and Penny Fowler, Rigged Rules and Double Standards: Trade, Globalization and The Fight Against Poverty, Oxford: Oxfam publishing, 2002.
12 Howard J. Wiarda, ed., Globalization: Universal Trends, Regional Variations, Lebanon, NH: University Press of New England, 2007.
13 According to Luke Martell, some recent contributions to globalization literature have identifi ed three waves or perspectives in globalization theory—the globalists, skeptics, and transformationalists or postskeptics. For detail, see Luke Martel, The Third Wave in Globalization Theory, The International Studies Review, Vol. 9, No. 2 (2007), pp. 173-196.
14 Dreher, op. cit.
15 Friedrich Heinemann, Does Globalization Restrict Budgetary Autonomy? A Multidimensional Ap- proach, Intereconomics, Vol. 35 (2000), pp. 288-298.
16 Roland Vaubel, Enforcing Competition among Governments: Theory and Application to the European Union, Constitutional Political Economy, Vol. 10 (1999), pp. 327-338.
17 Dani Rodrik, Who Needs Capital Account Convertibility? in Stanley Fischer et al, eds., Should the IMF Pursue Capital Account Convertibility?, Princeton, NJ: Department of Economics, Princeton Uni- versity, 1998, pp. 55-65.
18 David Dollar and Aart Kraay, Trade, Growth, and Poverty, The Economic Journal, Vol. 114, No. 493 (2004), pp. F22 - F49; Hali J. Edison, Ross Levine, Luca Ricci, and Torsten Slok, International Finan- cial Integration and Economic Growth, IMF Working Paper 02/145, Washington, D.C.: IMF, 2002;
David Greenaway, Wyn Morgan, and Peter Wright, Exports, Export Composition, and Growth, Jour- nal of International Trade and Economic Development, Vol. 8 (1999), pp. 41-51.
19 Dreher, p. 1092.
20 Ibid.
21 Foreign Policy Magazine, Globalization Index, http://www.foreignpolicy.com (accessed July 22, 2009).
22 Robert O. Keohane and Joseph S. Nye Jr., Governance in a Globalizing World: Introduction, in Joseph. E. Nye and John D. Donahue, eds., Governance in a Globalizing World, Washington, D.C.:
Brookings Institution, 2000, pp. 1-44.
23 Dreher, p. 1092.
24 For details see Dreher; and James Gwartney and Robert Lawson, Economic Freedom of the World: An- nual Reports, Vancouver: The Fraser Institute, 2001 and 2002.
25 The regions are based on the World Bank classifi cation of countries and regions.
26 Japan is taken as the benchmark country because it is the pioneer of industrialization in Asia and has had the highest HDI values since the base year 1975. The data required for the study are available from the base year, 1975.
27 Sen, op. cit.
28 UNDP, Human Development Report 2007/08, New York: Oxford University Press, 2008.
29 World Bank, Globalization, Growth, and Poverty: A Review of International Evidence, Washington, D.C.: World Bank, 2002.
30 William J. Baumol, Productivity Growth, Convergence, and Welfare: What the Long-Run Data Show, American Economic Review, Vol. 76 (1986), pp. 1072-1085; William J. Baumol and Edward N.
Wolff, Productivity Growth, Convergence, and Welfare: Reply, American Economic Review, Vol. 78 (1998), pp. 1155-1159.