RESEARCH
Correspondence to:
Dr Yuki Teranishi Department of Oral Implantology Osaka Dental University 8-1, Kuzuhahanazonoch, Hirakata, Osaka, Japan Fax: +81-06-6910-1048 Email:
teranishi-y@cc.osaka-dent.ac.jp Submitted July 10, 2018;
accepted July 18, 2018.
©2019 by Quintessence Publishing Co Inc.
Cost-Utility Analysis of Molar Single Implant
Versus Fixed Dental Prosthesis
Yuki Teranishi, DDS Korenori Arai, PHD, DDS Shunsuke Baba, PHD, DDS
Department of Oral Implantology, Osaka Dental University, Hirakata, Japan.
Medicine has reached a revolutionary stage worldwide in recent years, and the values of medical technologies are being questioned. In Japan, as in other countries, there are fears regarding breakdowns in the market mechanisms of health care and the sustainability of various types of insurance. It is said that un- favorable cost increases and benefit decreases will be unavoidable. Therefore, Health Technology Assessment (HTA) initiatives are being introduced.1 HTA is an academic field that investigates the impact of medical technology on health from economic, organizational, social, and ethical perspectives, accounting for possible treatment op- tions. The purpose of HTA is to provide information for formulating safe and effective patient-centered medical policies and realizing optimal values. This academic disci- pline, whose underlying academic basis is medical economics, evaluates the medi- cal effects of indicated medical technologies (ie, benefit) as comparatively weighed against the cost. It is a science that quantifies the relative value offered by medical technology in order to verify the value of medicine in monetary terms.2 Accordingly, the main purpose of economic valuation is not only to reduce medical costs but to take a fair approach doing so from the viewpoint of value-based public policy. This is then said to enable the rational evaluation of medical innovation.3 While many studies have been conducted in pharmacoeconomics in the field of medicine, few have inves- tigated the field of dentistry. Therefore, this study focused on the costs of dentistry in
Purpose: To calculate the incremental cost-effectiveness ratio (ICER) of prosthetic treatment of a single missing intermediate molar by performing cost-utility analysis on implants, insurance fixed dental prostheses (IFDPs), and private fixed dental prostheses (PFDPs). Materials and Methods: Transition probability (based on the results of past research) and the Markov model were used for cost-utility analysis, and Monte Carlo simulations were performed for sensitivity analysis. The utility values for various types of missing teeth were collected in September 2017, and dental prosthetic treatment was performed in general members of the Japanese population, distributed by sex and age. The time trade-off (TTO) method, which is an index scale (0–1), was used for measuring the utility values. Results: The utility value was the highest when measured at the state in which implant treatment was performed and the lowest when measured in the untreated missing-tooth state. This model showed that compared to FDPs, implant treatment resulted in higher quality-adjusted life years (QALYs). However, the estimated cost over 30 years was lower for IFDPs. The results also showed that PFDPs were in a more extended, dominant state than both IFDPs and implants. The implant-to-IFDP ICER was €2,454.37. Conclusion: The results suggest that implants can be used to obtain higher utility values in comparison to IFDPs and PFDPs. The ICER threshold for 1 QALY in Japan is approximately €37,037 to €44,444, and the implant-to-IFDP ICER was found to be below that found in this study. Accordingly, it appears that implants offer superior cost-effectiveness. Int J Prosthodont 2019;32:75–81. doi: 10.11607/ijp.6040
is to calculate the ratio of incremental cost associated with producing one unit of incremental effects/benefits gained from the new technology and compare it to the control medical technology. This is called the incremen- tal cost-effectiveness ratio (ICER). Therefore, to compare implants and FDPs from the viewpoint of cost and utility value, the present study aimed to conduct a cost-utility analysis on dental prosthetic treatment for a single miss- ing intermediate molar and to calculate the ICER.
MATERIALS AND METHODS General Methods
Target Population. The subjects for measurement of cost-utility values, which was the index for effects, were members of the general Japanese population. The sur- vey was conducted using a computer. Cost-utility value responses were obtained from each subject using the time trade-off (TTO) method for the virtual oral state (missing teeth and therapeutic intervention for each tooth) displayed on the computer. Responses regarding the subjects’ demographic characteristics (marital sta- tus, educational history, employment type, household income, etc) and oral state (current number of teeth, us- age experience of dentures, degree of satisfaction with oral state, etc) were also obtained.
Setting and Model. This study was a model study in which transition probability was used based on the results of past research. It was approved by the institu- tional ethics committee of the Osaka Dental University (approval no. 110816). Analysis was performed from the standpoint of public medical care, with the aim of attempting to optimize patient decision-making in medical practice. As implant and PFDP treatment op- tions are not currently covered by insurance in Japan, this investigation was conducted from the viewpoint of determining whether investing in implants or PFDPs vs IFDPs would be the superior choice for individual pa- tients considering investment in treatment for a missing intermediate molar. Therefore, data for this evaluation were computed using the Markov model.
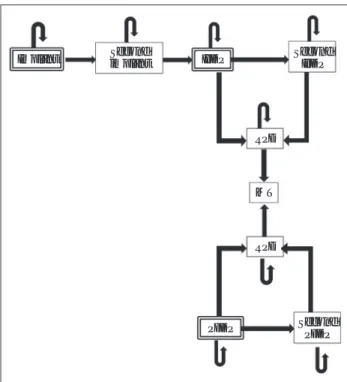
Comparators. In this model, implants, PFDPs, and IFDPs were examined with dental prosthetic treat- ment for a single missing mandibular first molar as the decision node. If the implant was lost, the prosthesis was changed to an IFDP, and if the IFDP failed, it was changed to a removable partial denture (RPD). If no RPD was fitted, the missing tooth was left untreated (Fig 1).
Time Horizon. In the 2011 Survey of Dental Diseases published by the MHLW, the mean number of miss- ing teeth for individuals aged 45 to 49 years was 1.5.8 Therefore, in the present model, the starting age for dental prosthetic treatment for a missing mandibular first molar was set to 50 years. In addition, because the mean life expectancy for both men and women in Japan is over 80 years, the analysis period was set to 30 years.
Japan. According to a report by the Ministry of Health, Labour and Welfare (MHLW) of Japan, when medical treatment was broken down into treatment points per day, dental prosthetic treatment accounted for a greater percentage than other types of treatment.4 Therefore, in the present study, it was decided to economically evalu- ate dental prosthetic treatment for a missing intermedi- ate molar.
Implants are an important treatment option in mod- ern dental care. In Japan, dental prosthetic treatment for a missing molar is generally performed with an in- surance fixed dental prosthesis (IFDPs; material: metal containing gold-silver-palladium). Private fixed dental prostheses (PFDPs; material: hybrid ceramics and ceram- ic cast crowns), which are not eligible for insurance cov- erage, are also a treatment option. Medical economic evaluation of implants has been conducted in the past.5 A previous study in which cost-benefit analysis was per- formed using an original questionnaire found that im- plants were the dominant treatment strategy compared to fixed dental prostheses (FDPs).6 A study conducted in South Korea in which the survival rate for dental prosthe- ses was analyzed found that if the cost of implants could be reduced by 20%, they would be dominant compared to FDPs.7 However, there have been few medical eco- nomic evaluation studies using oral health–related qual- ity of life (OHRQoL) scales, which are extensively used worldwide to measure effects. The standard method for economic evaluation of a new medical technology
Implant IFDP
PFDP RPD
RPD MT Second
implant Second
IFDP
Second PFDP
Fig 1 State of treatment transition diagram. The double-outlined boxes indicate initial treatment. IFDP = insurance fixed dental prostheses; PFDP = private fixed dental prostheses; RPD = removable partial denture; MT = missing teeth.
September 2017. As it was difficult to obtain the respon- dents’ understanding regarding lost implants and FDPs that had to be removed, such questions were not added to the questionnaire. Therefore, utility values were calcu- lated using the obtained General Oral Health Assessment Index (GOHAI) values as a reference for patients who pre- sented at the Department of Oral Implantology, Osaka Dental University (ie, state of lost implants and removed FDPs). GOHAI values are normally calculated in a range of 12 to 60; however, for this study, these values were converted to a range of 0–1.
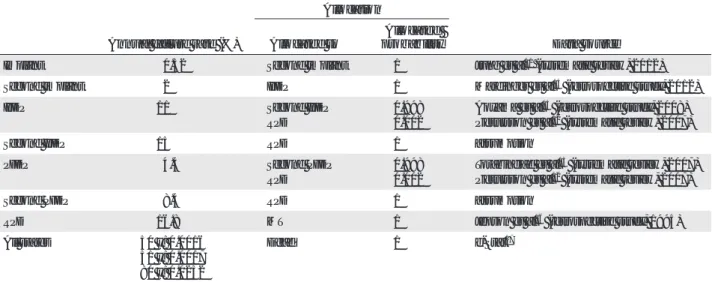
Synthesis-Based Estimates. Data from previous studies were used for transition probability. The data sources were three systematic reviews11–13 and three retrospective cohort studies.14–16 The annual mortality rate was calculated on the basis of the 2013 abridged life table published by the Statistics Bureau of the Ministry of Internal Affairs and Communications, Japan.17 One is- sue (repeat FDP treatment failure rate) was based only on expert opinion. The annual failure rate for each type of dental prosthesis, postfailure treatment allocation and allocated probability, annual mortality rate, and data source parameters are shown in Table 1.
Costs. For the decision-making process in this study, cost parameters were based on Japan’s medical insur- ance system because this study was conducted in Japan.
Using a conversion rate of €1 = ¥135.0 (as of 28 January 2018),18 costs for each treatment were converted to a gamma distribution. As PFDPs are not covered under the public health insurance system and therefore do not have a determined fee, costs were interpolated from general treatment costs in Japan. Some implants are covered by insurance in Japan (extensive jawbone loss due to an ill- ness or accident, etc); therefore, the cost for one missing tooth in this study was interpolated on the basis of costs under health insurance.
Discount Rate. Both costs and outcomes were dis- counted by 2% per year in accordance with guidelines in Japan.9
Outcomes
Choice of Outcomes. The cost-utility analysis was used to calculate the ICER. The cost-effectiveness acceptabil- ity curves (CEACs) of implants, CFDPs, and IFDPs were converted to figures and tables, and probabilistic sensi- tivity and decision-theoretic sensitivity analyses were per- formed to analyze sensitivity. TreeAge Pro 2015 (TreeAge Software) was used for data modeling and analyses.
Measurement of Effectiveness. The guidelines10 in Japan recommend using quality-adjusted life years (QALYs) as an outcome index. To calculate QALYs, QoL is measured using a ratio scale where death = 0 and per- fect health = 1. Subsequently, for cost-utility values of this cost scale to reflect values of people in the general popu- lation, it is recommended that an index scale be used.9 Accordingly, in the present study, responder preferences were directly measured and a questionnaire was devel- oped using TTO, which is an index scale. The cost-utility values (0 = no satisfaction, 1 = full satisfaction) of various missing tooth states and states in which dental prosthetic treatment had been performed were measured and used as an index for effects. To calculate cost-utility values with the TTO, the respondents were asked whether they would prefer n years at the health state for evaluation or x years at perfect health. X years was changed, and when almost the same degree of preference was reached, x/n was measured as the cost-utility value. For example, if 20 years without any missing teeth and 10 years with no teeth were found to be equivalent for an individual, the cost- utility value of having no teeth for that individual would be measured as 10/20 = 0.5. Sample data collection was conducted through a research company (ANTERIO) in
Table 1 Distribution of Annual Failure Rates and Allocation to Several Stages Used in the Model
Annual failure rate (%)
Allocation
Data source Allocated to Allocated
probability
Implant 0.52 Second implant 1 Jung et al11 (systematic review, 2012)
Second implant 2 IFDP 1 Mardinger et al14 (retrospective study, 2012)
IFDP 11 Second IFDP
RPD
0.998 0.002
Aoyama et al15 (retrospective study, 2008) Pjetursson et al12 (systematic review, 2007)
Second IFDP 15 RPD 1 assumption
PFDP 4.4 Second PFDP
RPD
0.998 0.002
Torabinejad et al13 (systematic review, 2007) Pjetursson et al12 (systematic review, 2007)
Second PFDP 8.4 RPD 1 assumption
RPD 16.8 MT 1 Jepson et al16 (retrospective study, 1995)
All states 50 y: 0.0016
51 y: 0.0017 80 y: 0.0252
Dead 1 e-Stat17
IFDP = insurance fixed dental prostheses; PFDP = private fixed dental prostheses; RPD = removable partial denture; MT = missing teeth.
to be excluded; to do so, the median response time was calculated, and the respondents who took longer than that time to respond were set as the target population for analy- sis. The median response time was 8 minutes, and 234 respondents took 8 minutes or longer to respond. Of these 234 respondents, 116 under- went implant treatment and wore an FDP for a missing mandibular first molar. A total of 128 respon- dents on the questionnaire reported mandibular free-end defect RPDs and untreated missing teeth, 32 re- ported implants that had been lost, and 66 reported FDPs that had to be removed. The highest utility val- ue was noted as the state in which implant dental prosthetic treatment was performed, and the lowest util- ity value was the state in which the missing tooth was left untreated.
Table 3 shows dental prosthetic treatment costs and posttreatment maintenance costs.
Incremental Costs and Outcomes. Figure 2 shows a scat- terplot of the costs and effects for the implant, PFDP, and IFDP groups.
RESULTS
Study Parameters
Table 2 shows the results for the utility values used in this study. The total number of respondents was 883. Subjects who responded too quickly had
Fig 2 Scatterplot of results of cost-effectiveness analysis.
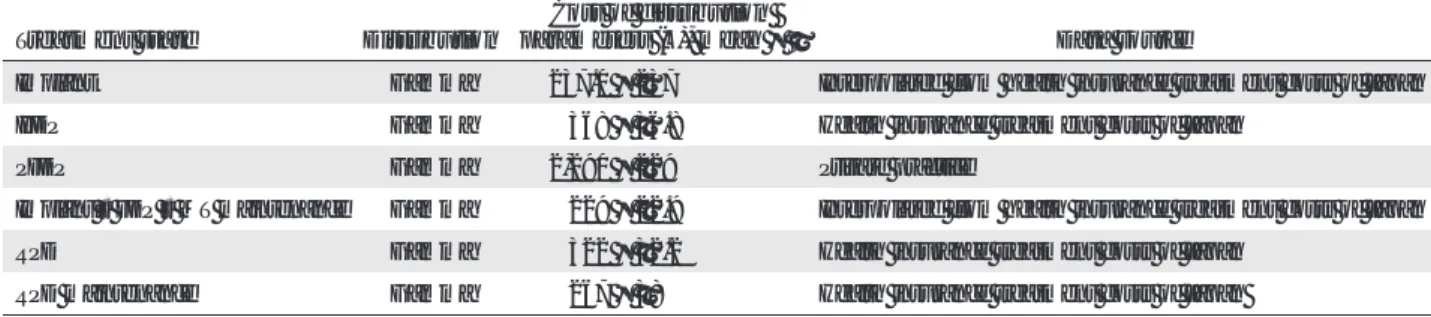
Table 3 Cost Surveys of Several Stages (€) Treatment
state Kennedy
classification Eichner
classification Distribution No. of
patients Age (y),
mean ± SD Distribution parameters, mean ± SD
Implant III B1 Beta 116 59.6 ± 5.9 0.74 ± 0.36
Lost implant III B1 Beta 32 61.1 ± 9.4 0.60 ± 0.36
FDP III B1 Beta 116 59.6 ± 5.9 0.72 ± 0.36
Lost FDP III B1 Beta 66 54.8 ± 11.5 0.59 ± 0.36
RPD II B2 Beta 128 60.9 ± 5.2 0.69 ± 0.33
MT II B2 Beta 128 60.9 ± 5.2 0.58 ± 0.36
Table 2 Patient Satisfaction Survey at Several Stages Treatment state Distribution Cost of distribution
parameters (€), mean ± S Data source
Implant Gamma 237.0 ± 237 Interpolated from health insurance treatment costs of Japan
IFDP Gamma 368 ± 36.8 Health insurance treatment costs of Japan
PFDP Gamma 2,290 ± 229 Private practice
Implant • FDP • MT maintenance Gamma 229 ± 22.9 Interpolated from health insurance treatment costs of Japan
RPD Gamma 322 ± 32.2 Health insurance treatment costs of Japan
RPD maintenance Gamma 267 ± 38 Health insurance treatment costs of Japan
IFDP = insurance fixed dental prostheses; PFDP = private fixed dental prostheses; RPD = removable partial denture; MT = missing teeth;
SD = standard deviation.
Effectiveness of utility scores for 30 y 11,0000
10,000
9,000
8,000
7,000
6,000
0 8.0 10.0 12.0 14.0 16.0 18.0 20.0 22.0
IFDP Implant PFDP
//
//
Cost (€)
the present study, the utility values were obtained with the TTO and are considered to be appropriate for QoL measurement from the viewpoint of The fact that PFDPs were positioned
further to the left than the straight line observed for IFDPs and implants indicates that they were in an ex- tended, dominant state. Table 4 shows ICER calculation results. On the basis of cost-effectiveness esti- mation, the cost difference between implants and IFDPs was €1,604.47.
As the differential effect was 0.65, the ICER was €2,454.37.
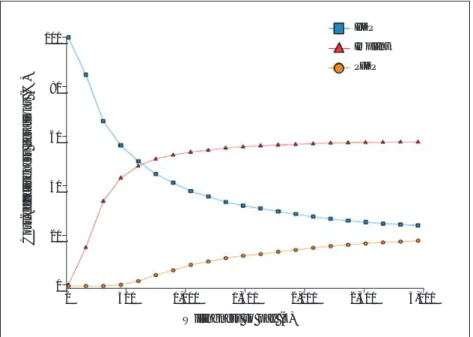
Characterizing Uncertainty To analyze probabilistic sensitiv- ity, 5,000 Monte Carlo simulations were computed. The results were entered into a scatterplot in the cost- effectiveness plane (Fig 3). Although IFDP and PFDP points were widely distributed, implants were more fo- cused on the right side of the plane than the other two groups. Figure 4 shows the CEACs. When the willingness-to-pay threshold was low, IFDPs exhibited higher accept- ability than other treatment options.
Acceptability for PFDPs from above
€600 was observed.
DISCUSSION
To the best of the present authors’
knowledge, this is the first study to conduct a medical economic evalu- ation using Japanese medical data (costs, utility values) to investigate dental prosthetic treatment op- tions for a single missing mandibu- lar first molar. Moreover, although cost-effectiveness investigations in the field of dentistry often use the survival period as the effect to be studied,7,19 the present study evalu- ated effects from the viewpoint of QoL. A previous study investigated cost-effectiveness using an original questionnaire to measure QoL.20 In
Fig 3 Cost-effectiveness plane (Monte Carlo simulation).
Fig 4 Cost-effectiveness acceptability curves.
Table 4 Incremental Cost-Effectiveness Ratio (ICER) of Implant vs Insurance Fixed Dental Prostheses (IFDP) Treatment
Category Treatment Cost (€) Incremental cost (€) Effectiveness Incremental effectiveness ICER
Excluding dominated
Undominated IFDP 5,797.70 15.57
Undominated Implant 7,402.17 1,604.47 16.22 0.65 2,454.37
Willingness to pay (€) 100
80
60
40
20
0
0 500 1,000 1,500 2,000 2,500 3,000
IFDP Implant PFDP
Cost-effectiveness iterations (%)
Effectiveness (Total of utility scores for 30 y) 9,0000
8,000
7,000
6,000
0 15.6 15.8 16.0 16.2
IFDP Implant Dominated PFDP Undominated
//
//
Cost (€)
However, estimated costs over 30 years were lower for IFDPs than for the other two groups. PFDPs were found to be in an extended, dominant state in relation to IFDPs and implants. These results are similar to those of previ- ous studies on the cost-effectiveness of implants and FDPs.6,7,20
These results suggest that implants enable more QALYs than IFDPs or PFDPs. The ICER threshold for 1 QALY in Japan is approximately €37,037 to €44,444.
The implant-to-IFDP ICER was found to be below that obtained in this study. Accordingly, it appears that im- plants offer superior cost-effectiveness. According to research by the MHLW, implant treatment ranks second behind preventive dentistry as a medical field for which demand is predicted to increase in the future. This may be due to improved QoL and an increase in the elderly population. Therefore, the use of implants is expected to become more popular, which may result in improved knowledge regarding implants among the general pop- ulation. The present calculation of utility values reflect- ing the values of Japanese people could help patients select dental prosthetic treatment options.
In terms of future directions, the study subjects may not have sufficiently understood the method of re- sponse in this study. The validity and reliability of the questionnaire must be investigated, and further re- search using an interview method with one researcher for each respondent must be considered.
CONCLUSIONS
Determining the extent to which the oral health state affects QoL and then setting national standards accord- ing to the oral health state can contribute to further development of medical economic evaluation in Japan.
ACKNOWLEDGMENTS
The authors would like to extend their deepest gratitude to Ms Yuka Tone of ANTERIO, who cooperated in many aspects of this study. The authors report no conflicts of interest.
REFERENCES
1. Meiji Institute for Global Affairs. Kamae I. The medical revolution in the world. https://www.
meiji.ac.jp/miga/6t5h7p00000ec1v4-att/20141009profkamae_1.pdf.
Accessed 27 September 2018.
2. Kamae I. Perspective on Pharmacoeconomic Approaches to Health Technology Assessment: Recent Development in Assessing Innovation.
Pharmaceutical and Medical Device Regulatory Science Society of Japan 2012;43:39–44.
3. Kamae I. Perspective on Pharmacoeconomic Approaches to Health Technology Assessment: A Key to Proper Interpretation of the QALY and the ICER. Pharmaceutical and Medical Device Regulatory Science Society of Japan 2012;43:686–692.
validity. Such results may be useful not only for improv- ing patient satisfaction, but also for formulating insur- ance system policies.
The limitations of this study include the fact that treatment transition probability results relied on three retrospective cohort studies and that the same type of dental prosthetic treatment could only be conducted once following implant and FDP failure. Currently, in the field of medicine in Japan, medical facilities targeted for the Diagnosis Procedure Combination (DPC) system are available, and databases for national health insurance and cooperative insurance medical receipts have been prepared. Observational studies that are comparable to randomized controlled trials (RCTs) have been conduct- ed by establishing the characteristics of these numer- ous data and creating reminders.21,22 However, in the field of dentistry, particularly in the field of implants, data are not being collected at multiple facilities. When engaging in clinical research, it is essential to determine necessary data as quickly and concisely as possible and to construct a database through which certain data can be obtained in order to promote the development of implantology.
Cost-effectiveness
Japan has a universal health care system under which medical care required to maintain each individual’s life and health is covered by public health insurance.
This may include recovery from illness or impairment, prolonged progression of illness or impairment, and/
or maintenance of physical and mental functions. The amount of medical fees covered by individual patients is 30% for those aged 6 to 69 years, 20% for children aged 0 to 5 years (separate public fee assistance also available from local municipal bodies), and 10% for el- derly individuals aged 70 years or more (or 30%, de- pending on the income). These fees are paid at the medical institution by the patient. Other types of care, such as cosmetic surgery, orthodontics, and sex reas- signment surgery, are considered to be private proce- dures that are not covered by public health insurance, and expenses are completely covered by the individual patient. In this study, the IFDPs were covered by pub- lic health insurance, but the PFDPs were not. Although implants are also generally not covered by public health insurance, some implants in this study were covered by public health insurance, and thus, the figures used for the analyses were interpolated from such cost data.
The cost of implant treatment not covered by public health insurance in Japan is approximately €2,747.50 to
€3,927.50.
Main Result
In the present study, dental prosthetic treatment for a single missing mandibular first molar with an implant re- sulted in more QALYs than those for an IFDP or a PFDP.
13. Torabinejad M, Anderson P, Bader J, et al. Outcomes of root canal treat- ment and restoration, implant-supported single crowns, fixed partial dentures, and extraction without replacement: A systematic review.
J Prosthet Dent 2007;98:285–311.
14. Mardinger O, Ben Zvi Y, Chaushu G, Nissan J, Manor Y. A retrospective analysis of replacing dental implants in previously failed sites. Oral Surg Oral Med Oral Pathol Oral Radiol 2012;114:290–293.
15. Aoyama T, Aida J, Takehara J, Morita M. Factors associated with the longevity of restorations in posterior teeth. Koku Eisei Gakkai Zasshi 2008;58:16–24.
16. Jepson NJ, Thomason JM, Steele JG. The influence of denture design on patient acceptance of partial dentures. Br Dent J 1995;178:296–300.
17. e-Stat homepage. https://www.e-stat.go.jp/SG1/estat/GL08020103.
do?_toGL08020103_&listID=000001120139&requestSender=dsearch.
Accessed 27 September 2018.
18. Foreign Exchange Rates. https://info.finance.yahoo.co.jp/fx/. Accessed 28 January 2018.
19. Schwendicke F, Graetz C, Stolpe M, Dörfer CE. Retaining or replacing molars with furcation involvement: A cost-effectiveness comparison of different strategies. J Clin Periodontol 2014;41:1090–1097.
20. Chun JS, Har A, Lim HP, Lim HJ. The analysis of cost-effectiveness of implant and conventional fixed dental prosthesis. J Adv Prosthodont 2016;8:53–61.
21. Murata K, Hinotsu S, Hamada S, Ezoe Y, Muto M, Kawakami K. The changing patterns of dispensing branded and generic drugs for the treatment of gastroesophageal reflux disease between 2006 and 2011 in Japan: A retrospective cohort study. BMC Health Serv Res 2015;15:76.
22. Katada H, Yukawa N, Urushihara H, Tanaka S, Mimori T, Kawakami K.
Prescription patterns and trends in anti-rheumatic drug use based on a large-scale claims database in Japan. Clin Rheumatol 2015;34:949–956.
4. Ministry of Health, Labour, and Welfare of Japan.
The situation of the dental treatment. http://www.
mhlw.go.jp/toukei/saikin/hw/sinryo/tyosa14/dl/sika.pdf. Accessed 27 September 2018.
5. Beikler T, Flemmig TF. EAO consensus conference: Economic evaluation of implant-supported prostheses. Clin Oral Implants Res 2015;26(suppl 11):s57–s63.
6. Zitzmann NU, Krastl G, Weiger R, Kühl S, Sendi P. Cost-effectiveness of anterior implants versus fixed dental prostheses. J Dent Res 2013;
92(suppl 12):s183–s188.
7. Kim Y, Park JY, Park SY, et al. Economic evaluation of single-tooth replacement: Dental implant versus fixed partial denture. Int J Oral Maxillofac Implants 2014;29:600–607.
8. Statistical Tables of the Survey of Dental Diseases (2011) Part 1.
Table III-2-1. http://www.mhlw.go.jp/toukei/list/dl/62-17c23-1.pdf.
Accessed 27 September 2018.
9. Fukuda T, Shiroiwa T, Ikeda S, et al. Guideline for economic evaluation of healthcare technologies in Japan. J Natl Inst Public Health 2013;62:
625–640.
10. Fukuda T. An overview of the methods of economic evaluation in health care. J Natl Inst Public Health 2013:62:584–589.
11. Jung RE, Zembic A, Pjetursson B, Zwahlen M, Thoma D. Systematic review of the survival rate and the incidence of biological, technical, and aesthetic complications of single crowns on implants reported in longitudinal studies with a mean follow-up of 5 years. Clin Oral Implants Res 2012;23(suppl 6):s2–s21.
12. Pjetursson BE, Brägger U, Lang NP, Zwahlen M. Comparison of survival and complication rates of tooth-supported fixed dental prostheses (FDPs) and implant-supported FDPs and single crowns (SCs). Clin Oral Implants Res 2007;18(suppl 3):s97–s113.
Literature Abstract
Non-Carious Cervical Lesions and Risk Factors: A Case-Control Study
The aim of this study was to evaluate whether the presence of noncarious cervical lesions (NCCLs) was related to the considered risk factors and to show the corresponding odds ratios (ORs) in a predictive model. The sample was comprised of 280 dentistry students. In an initial clinical examination, 140 cases who presented one or more teeth with noncarious cervical wear were selected. For each case, a sex- and age-matched control without any teeth with NCCLs was selected. An occlusal examination and periodontal probing were performed in all cases and controls by skilled dentists. All the subjects answered a questionnaire referring to risk factors such as brushing, bruxism, preferred chewing side, consumption of extrinsic acids, and the presence of intrinsic acids. Data were analyzed by means of univariate and multivariate logistic regression. Of all the study variables, only the protrusion interferences, interferences on the nonchewing side, the brushing force, Community Periodontal Index of Treatment Needs (CPITN) value, and the consumption of salads increased the risk of NCCLs in the univariate regression. The best predictive model was formed by the combination of CPITN variables > 1, the consumption of acidic salads, self-reported bruxism, brushing force, and attrition. However, it only correctly classified in 68.75% of subjects. This study supports the multifactorial etiology of NCCLs, as the combination of several factors is necessary to explain their presence. The risk factors that make up the predictive model alone are not sufficient to explain the appearance of NCCLs. Dentists should take into account all these risk factors in prevention, diagnosis, and treatment.
Alvarez-Arenal A, Alvarez-Menendez L, Gonzalez-Gonzalez I, Alvarez-Riesgo JA, Brizuela-Velasco A, deLlanos-Lanchares H.
J Oral Rehabil 2019;46:65–75. References: 42. Reprints: Angel Alvarez-Arenal, arenal@uniovi.es —Carlo Marinello, Switzerland