INTRODUCTION
There are numerous studies on EEG (electroen- cephalogram) activity during seizures, natural sleep, and administration of central nervous system (CNS)- acting drugs such as antiepileptics, antipsychotics, adrenergic agonists, and anesthetics
1-8Two common methods of analyzing EEG activity under such condi- tions are power spectrum analysis and aperiodic analysis.
5-8There are certain important differences between these two methods of EEG analysis. With power spectrum analysis, frequency information about the EEG is provided by applying high order mathematical treatment to reduce the complex analog waveforms to equivalent sine waves. Several seg- ments of analog information taken over short time in- tervals are averaged to provide graphic and/or digital
information for the entire time interval over which the several segments were obtained.
With aperiodic analysis, no averaging is performed and, instead, each individual waveform is detected and displayed graphically and/or digitally. That the es- sential natures of the information provided by these two methods of EEG analysis are dissimilar suggests that the two methods may differ with respect to utility for monitoring certain EEG patterns. For example, aperiodic analysis more easily and accurately identi- fies spike activity in the EEG.
9This is true, at least in part, because it is the only technique with a built-in spike detection algorithm. Power spectrum analysis may fail to discriminate significant spike activity be- cause the power contained in the spike activity is rela- tively low and is overshadowed by the low-frequency components which accompany the spike activity. On
Comparison of EEG analysis systems during lidocaine-induced seizure activity and administration of valproic acid in rabbits
Masayo Nakata
1and Yoshihiro Momota
21
Graduate School of Dentistry (Department of Anesthesiology) and
2Department of Anesthesiology, Osaka Dental University, 8-1 Kuzuhahanazono-cho, Hirakata-shi, Osaka 573-1121, Japan
Based on algorithm differences between aperiodic and power spectrum analysis of the elec- troencephalogram (EEG), we hypothesized that the effects on the EEG of an antiepileptic drug would be equally well detected with either lidocaine-induced seizure by aperiodic analy- sis or by power spectrum analysis. However, the former is superior.
EEG activity was recorded in anesthetized rabbits prior to intravenous infusion of valproic acid and lidocaine and after the onset of EEG activity. Values for delta, theta, alpha, beta, and total activity, as well as edge frequency were compared within each group, and were ex- pressed as percent change from baseline for comparison between aperiodic and power spec- trum analysis. With valproic acid, EEG changes were modest and the two methods of EEG analysis were significantly different from one another for only two of the 12 comparisons.
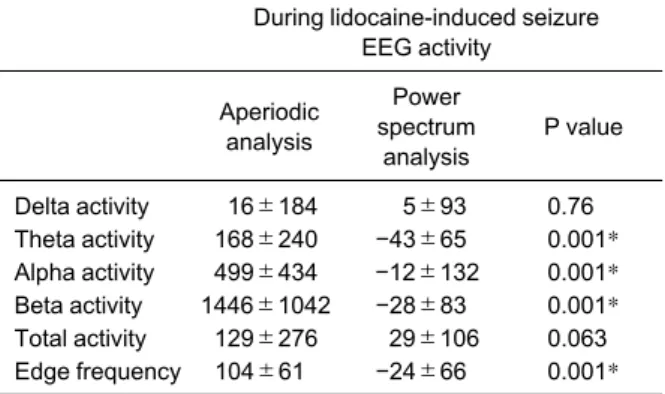
With lidocaine, the lidocaine-induced seizure activity was associated with widespread EEG changes which were better detected by aperiodic analysis than by power spectrum analy- sis. Comparison between the two methods of analysis indicated significant differences for theta, alpha, and beta activity and edge frequency. These results indicate that both methods of analysis may be suitable to detect modest drug-induced EEG changes, whereas aperiodic analysis is superior for detection of widespread seizure activity. (J Osaka Dent Univ 2016 ; 50 : 23-29)
Key words : Aperiodic analysis ; Power spectrum analysis ; Lidocaine ; Valproic acid
the other hand, power spectrum analysis would pro- vide excellent discrimination of small, high-frequency components contained in a predominantly low-fre- quency components.
9There are no studies in which the EEG was ana- lyzed simultaneously by both power spectrum analy- sis and aperiodic analysis during seizures or during administration of antiepileptic drugs. Because aperi- odic analysis includes a built-in spike detection algo- rithm whereas power spectrum analysis does not, and because with power spectrum analysis the low power contained in spike activity is overshadowed by the low -frequency components accompanying spike activity, we hypothesized that the effects on the EEG of an an- tiepileptic drug, valproic acid, would be detected equally well with either technique. However, detection of EEG seizure activity by aperiodic analysis would be superior to that by power spectrum analysis. Accord- ingly, the present study was designed to monitor EEG activity simultaneously with both power spectrum analysis and aperiodic analysis during intravenous (iv) infusion of valproic acid in doses previously re- ported in rabbits to achieve antiepileptic brain tissue concentrations
10and during iv infusion of lidocaine in doses previously reported in rabbits to initiate EEG seizure activity.
11MATERIALS AND METHODS Animal Preparation
All procedures were carried out under the Guidelines for Animal Research at Osaka Dental University and with the approval of the Animal Experiment Commit- tee of Osaka Dental University (Approval number 06- 04001). These guidelines were in accordance with the criteria outlined in the “Guide for the Care and Use of Laboratory Animals” prepared by the National Acad- emy of Science. Forty-one Japanese white rabbits (JW/CSK ; Shimizu Laboratory Supplies, Kyoto, Ja- pan) weighing 2.8-3.5 kg, were anesthetized by mask induction with sevoflurane (gradually increased from 0.5 to 3.5%, inspired) and nitrous oxide (50%, in- spired) in oxygen. A tracheostomy was performed, a 3.0-4.0 mm endotracheal tube was inserted 1.5-2.0 cm into the trachea, and ventilation was controlled with a small animal respirator (Model 680, Harvard
Apparatus, South Natick, MA, USA). Ventilation was adjusted to maintain PaCO2 at 32±5 mmHg. There- after, expired carbon dioxide was measured continu- ously via a Capnococheck plus (BCI International, Waukesha, WI, USA) and ventilation was regulated by a servo-controller to maintain expired carbon diox- ide at normocapnia.
A femoral vein was cannulated for drug administra- tion, and a left femoral was cannulated for determina- tion of systemic arterial blood pressure and heart rate, and to permit blood sampling for determination of blood gas tensions. Mean arterial blood pressure (MAP) was determined by electronic integration of systolic and diastolic blood pressures. An ear vein was cannulated for administration of saline and pan- curonium (0.5 mg/h) to maintain muscle relaxation.
Temperature was monitored by a rectal thermistor probe and maintained at 38.0±0.5°C by a heating mat (ATC-101, Unique Medical, Tokyo, Japan). The animal was then turned to the prone position and the head slightly elevated and fixed in a stereotaxic frame. A midsagittal scalp incision was made to ex- pose the calvarium. A pair of gold cup electrodes was placed over one cerebral hemisphere, with one elec- trode over the frontal cortex and one over the parietal cortex. A second pair of gold cup electrodes was also placed over the contralateral cerebral hemisphere at the corresponding frontal and parietal locations. With one frontal-parietal pair of electrodes the EEG was re- corded using a Lifescan Brain Activity Monitor System (Diatel Medical Technology, San Diego, CA, USA) with a bandpass of 0.5-29.9 Hz. This system uses aperiodic analysis to convert the analog EEG signal into a set of digital parameters.
Computer analysis of the EEG and expression as
quantitative values was performed using a Lifescan
Research program. With the second pair of frontal-pa-
rietal electrodes the EEG was recorded using an ER-
NIE System (Spacelabs, Redmond, WA, USA) with a
bandpass of 0.5-32.0 Hz and a stop band cutoff at 30
Hz. This system uses power spectrum analysis to
convert the analog EEG signal into a set of digital pa-
rameters. Computer analysis of the EEG and expres-
sion as quantitative values is included in the ERNIE
System program. In half of the rabbits within each of
the two experimental groups (valproic acid or lido- caine) the right hemisphere EEG was analyzed using aperiodic analysis and the left hemisphere EEG was analyzed using power spectrum analysis. In the re- maining rabbits aperiodic analysis was performed on the left hemisphere EEG and power spectrum analy- sis was performed on the right hemisphere EEG.
Blood pressure and heart rate were continuously re- corded on a strip chart recorder.
After the surgical preparation, the inspired concen- tration of halothane was decreased and anesthesia was maintained with fentanyl and halothane (0.7- 0.9%, expired) and nitrous oxide (66%, inspired) in oxygen. Fentanyl was given as an initial dose of 16 μg /kg iv over 10 min and then as iv infusion at 0.18 μg/
kg/min and was continued until the end of the study.
Experimental Period
In one group of rabbits (n=17) the EEG and systemic values, such as blood gas tensions, and hemodynam- ics, were recorded at baseline (i.e., before iv infusion of valproic acid) and at 30 min and 210 min of iv infu- sion of valproic acid. Valproic acid was given as an in- itial dose of 7.5 mg/kg followed by continuous infusion at 125 μg/kg/min. In the second group of rabbits (n=
24) the EEG and systemic values were recorded at baseline (i.e., before iv infusion of lidocaine) and at the occurrence of lidocaine-induced epileptiform EEG activity. Lidocaine was given at an initial infusion rate of 4 mg/kg/min until the onset of epileptiform EEG ac- tivity. Epileptiform EEG activity was defined as high- voltage spikes with amplitude of 10-20 μV (power spectrum analysis) or power of 400 μV
2(aperiodic analysis).
12, 13After the onset of epileptiform EEG ac- tivity, lidocaine was continued at 1-3 mg/kg/min as needed to maintain epileptiform EEG activity until data collection was complete.
Statistical Analysis
Statistical comparisons within the two groups were made using the geometric mean,
14Student’s t-test for paired samples, and one-way repeated measures analysis of variance (ANOVA ; Sigma State, Jandel Scientific, San Rafael, CA, USA) as follows. For aperi- odic analysis the Lifescan Research System was set
to display EEG data at 60 sec intervals. Within each interval the data recorded were cumulative power (μV
2) within each frequency bin (delta, 0.5-3.0 Hz ; theta, 3.1-8.0 Hz ; alpha, 8.1-12.0 Hz ; and beta, 12.1- 29.9 Hz), total power, and edge frequency (95%).
Data were recorded for 10 min at each experimental condition. The geometric mean for each EEG pa- rameter was calculated from the 3 min epoch with the least variability.
The ERNIE System program for power spectrum analysis updates displayed EEG data every 2 sec.
Data for power spectrum parameters were collected over 18 sec intervals. Within each interval the data re- corded were cumulative amplitude (μV) within each frequency bin (delta, 0-4 Hz ; theta, 4-8 Hz ; alpha, 8-13 Hz ; beta-1, 13-20 Hz ; and beta-2, 20-30 Hz), total amplitude, and edge frequency (95%). Data were recorded for 10 intervals at each experimental condi- tion. The geometric mean for each EEG parameter was calculated for each 3 min epoch. The values gen- erated by power spectrum analysis could not be com- pared statistically to the values generated by aperi- odic analysis because the two systems differed with respect to their definition of bandwidth and the time in- terval at which EEG data was analyzed.
In order to permit statistical comparison between
the two analysis systems, data at 30 min and 210 min
of iv infusion of valproic acid, and data at occurrence
of lidocaine-induced epileptiform EEG activity were
expressed as percent change from baseline (i.e., pre
-valproic acid and pre-lidocaine) values. Power spec-
trum analysis data for beta-1 and beta-2 frequency
bins were combined to permit comparison to aperiodic
analysis data for the beta frequency bin. Data in the
group receiving valproic acid were analyzed first by
one-way repeated measure ANOVA (baseline, 30
min, and 210 min) and then by Student’s t-test for
paired samples where indicated. Data in the group re-
ceiving lidocaine (baseline and lidocaine-induced epi-
leptiform EEG activity) were analyzed using Stu-
dent’s t-test for paired samples. Comparison between
the two methods of EEG analysis was made using
Student’s t-test for unpaired samples. For all data
analyses, p<0.05 was considered significant. Values
were tabulated as mean and standard deviation.
RESULTS
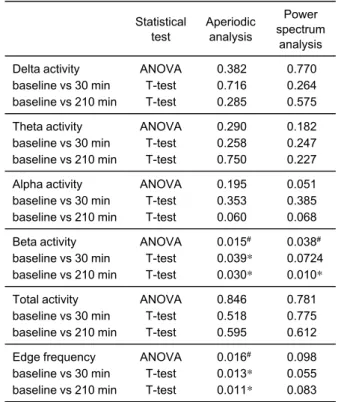
Combined mean values for amplitude or power (total and in each frequency bin) and edge frequency for each of the two analysis systems prior to administra- tion of valproic acid (group 1) or lidocaine (group 2) are presented in Table 1. In group 1, one way ANOVA indicated that aperiodic analysis detected statistically significant changes in beta power (p=0.015) and edge frequency (p=0.016), and power spectrum analysis detected statistically significant changes in beta amplitude (p=0.038) following administration of valproic acid (Table 2). Subsequent T-tests indicated that aperiodic analysis detected statistically signifi- cant decreases in beta activity and edge frequency at both 30 min and 210 min after valproic acid as com- pared to pre-valproic acid values. Power spectrum analysis detected statistically significant decreases in beta activity only at 210 min after valproic acid as
compared to pre-valproic acid values. The percent change from pre-valproic acid values for each EEG parameter with aperiodic analysis and power spec- trum analysis are presented in Table 3. Comparison between the two analysis systems of the percent change from pre-valproic acid values indicated statis-
Table 1 Combined baseline EEG values as determined by aperiodic analysis and power spectrum analysis
Aperiodic analysis*
Power spectrum analysis**
Delta activity Theta activity Alpha activity Beta activity Total activity Edge frequency, Hz
68.3±42.1 28.9±24.8 10.4±8.8
7.4±5.2 129.0±60.4
16.2±2.5
57.8±21.1 23.7±7.3
7.8±6.2 6.8±2.2 60.9±20.0 11.4±3.5 EEG : Electroencephalogram, *Activity expressed as power, μV
2・10
3・ min
−1, **Activity expressed as amplitude, μV ・ 2 sec
−1, n=41, Mean±SD.
Table 2 P values resulting from comparison of geometric mean EEG values for each method of EEG analysis within the group of rabbits receiving valproic acid
Statistical test
Aperiodic analysis
Power spectrum
analysis Delta activity
baseline vs 30 min baseline vs 210 min
ANOVA T-test T-test
0.382 0.716 0.285
0.770 0.264 0.575 Theta activity
baseline vs 30 min baseline vs 210 min
ANOVA T-test T-test
0.290 0.258 0.750
0.182 0.247 0.227 Alpha activity
baseline vs 30 min baseline vs 210 min
ANOVA T-test T-test
0.195 0.353 0.060
0.051 0.385 0.068 Beta activity
baseline vs 30 min baseline vs 210 min
ANOVA T-test T-test
0.015
#0.039*
0.030*
0.038
#0.0724 0.010*
Total activity baseline vs 30 min baseline vs 210 min
ANOVA T-test T-test
0.846 0.518 0.595
0.781 0.775 0.612 Edge frequency
baseline vs 30 min baseline vs 210 min
ANOVA T-test T-test
0.016
#0.013*
0.011*
0.098 0.055 0.083
#