山形県立米沢女子短期大学
『生活文化研究所報告』
第47号 抜刷 2020年3月
in College Students
伊豆田 義人
IZUTA Giido
Factors Triggering Sightseeing Behavior in College Students
伊豆田 義 人
IZUTA Giido
Abstract
The aim of this paper was to examine by means of statistical quantitative analyses how the environmental factors, advertising and personal factors as individual feelings and psychological state of mind either influence or trigger Japanese college students’ willingness to go out for a drive or a short hanging around sightseeing trip. The research consisted of a survey study that was carried out in a women’s junior college located in the region called ‘Tohoku region’ in Japan. In all, 180 female students, aged 19-20 years old participated voluntarily in the investigation. The survey was designed on the basis of a 7 point Likert questionnaire and comprised 30 questions evaluating factors that, according to a preliminary probing, either influence or trigger the willingness to go out for a drive or a short trip. The cluster analysis provided a model with four clusters, each expressing the rating levels of the evaluated factors. The factor analysis led to a model with 7 factors, whereas the structural equations modeling analysis gave a path model based on the statistical correlation of the factor in the sense of factor analysis, which showed that the respondents will in fact set out to these places if not only they have enough money and time, but also as long as they are sure that the place has good access and is safe. From the academic point of view, these results allow us to shed some light on this ‘outing’ behavior commonly seen among Japanese college students. From a practical standpoint, they allow, for example, policy makers to develop their regions to attract young people as tourists. The key point of this work is the establishment of a statistical model focusing on the environment related conditions and individual psychological state of mind to understand the factors involved in the willingness to go out.
Key words: Assessment, Sightseeing Behavior, College Students’ Behavior, Tourism Behavior, Quantitative Analysis
1. INTRODUCTION
It is a very natural scene and part of our daily lives to see, during the summer breaks and holidays, young college students going out of their towns or their living places with their backpacks on the shoulders riding a bicycle or motor bike, or on a bus or train, or even in their own cars for, off course, those who can afford one. Not to mention that a few, for one reason or another, make use of air services companies to reach their destinations. Surely, some of them are just going back home to spend the whole season in their home towns with families and friends, while others rather prefer to take these opportunities to visit different places. Nevertheless this is no different in Japan, there are differences between those Japanese college students living, whether temporarily or permanently, in big cities and those residing in places far from metropolis in what concerns to how they plan and go out for traveling and sightseeing during the vacation seasons. For example, in addition to accessibility to the destination, female college students living in regional areas are relatively much concerned about personal safety and security of the place than their peers in big cities.
This kind of behavioral pattern motivated us to question whether there exists a statistical model that can provide some insight into the factors that drive young people to act in this way. Actually, the search for such a model grew
out of a bigger research project aimed to study the tourism development that regional governments are carrying out in order to vitalize economically their towns. Thus, this paper assesses environmental factors - as the existence of historical and cultural sites, hot-springs and castle among other things, advertising elements, and individual feelings and state of mind that influence college students’ willingness to go out for a drive or a short hanging around trip. The sampling population is limited to female students enrolled in humanities course living in ‘Tohoku region’, which refers to the northeastern region of Japan. The aim here is to pursue statistical modeling on the grounds of the cluster analysis, factor analysis, and structural modeling analysis.
As for the previous reports on the influence of environmental factors on the travelers, in particular in Japan, they can be found compiled in a single book and references there in (Maeda, 2006). Basically, the papers focus on the motivation for traveling and traveler-host interaction on the basis of interviewing travelers and local businesses.
There is also a work done by (Yashiro & Oguchi, 2006) who conducted a survey investigation on 98 students in all to examine how some good preferences and interests related to traveling that they experienced during their childhood would influence present choices of travel destinations. In addition, Yamamoto targeted specifically at a relatively popular destination to see how factors as historical sites, natural landscape, spa and local food would drive college students to visit the place (Yamamoto, 2016).
This work is also related to regional tourism, which has in the last decades received a great deal of attention not only from policy makers and local industries, but also academicians. Recently, an analysis report of nationwide initiatives taken by regional cities to be recognized as an attractive destination has been published (Tanaka, 2017).
There, recent activities and the variables that are being emphasized in order to establish a sort of ‘regional brand’ are analyzed by means of the principal component analysis.
As any endeavor, these challenges call for marketing practices aimed to widespread the ‘brand’. In fact, since the beginning of this decade, we have witnessed an ever growing approach based on digital technology in addition to the traditional advertising business. Among them, the social media has played the key role in this process as to boost Japanese businesses to international travelers (Hawkinson, 2013), and to analyze the travelers’ reactions to promotion related contents posted on Facebook (Suzuki & Kurata, 2018). On the other hand, it has been pointed out that social media services help create tourist spots and sightseeing areas which are merely by-products of ‘media induced tourism’ phenomenon (Tao & Kodate, 2017). It is also worth noting that social media affects local people‘s perception toward their own environment (Kawamorita, Anzai & Kazam, 2017).
With regard to the data analysis, statistical models have long been one of the main options to study tourist behavior. In the Japanese context, there are for example investigations based on probabilistic approach to study destination choices (Morikawa, Takeuchi & Kako, 1991), and inbound flux of tourists (Kameyama, 2017); and the factor analysis was used to analyze the destination seeking behavior (Okamoto & Sato, 2015). Nevertheless more complex statistical tools are available, in this paper, unlike the works based on PLS-SEM (Uysal, Schwartz &
Sirakava-Turk, 2017; Kumar & Purani, 2018), we use the structural equations modeling in its basic form (Hox &
Bechger, 1998).
Finally, this paper is organized as follows. The details of experimental procedure are described in section
‘Methodology’; and the results are given in section ‘Results’. Discussions and final comments are presented in the last two sections, respectively.
2. METHODOLOGY 2.1 Sampling and Survey
The field work took place at a college and junior college located in ‘Tohoku region’, which is composed by six prefectures in the northeastern part of Japan. Prior consent to carry out the survey during the classes were obtained
from teachers, and after given the students the explanations related to the research and the questionnaires, we asked them for voluntary cooperation in the work, so those not agreeing to it were asked to not fill out the survey sheet. The students were all female coming from all over ‘Tohoku region’ and, reportedly, they have lived their entire lives so far in this part of countryside. Their ages ranged from 19 to 20 years old, and they were first and second year students majoring in humanities fields; i.e., courses of social and information science, Japanese history, Japanese language and literature, and English language and literature. In all, we collected during the period between June and July of 2017, 180 answer sheets including 10 invalid ones - either incomplete, or multiple markings, or else. Thus, the valid sampling population consists of 170 students. The survey had, in addition to basic questions regarding personal data, 30 questions that basically asked to evaluate on the basis of a 7 point Likert questionnaire format - rank 1 standing for the weakest influence, whereas rank 7 the strongest - factors (measured variables) that either influence or trigger Japanese college students’ willingness to go out for a drive or a short hanging around sightseeing trip. These questions were selected after proceeding a narrowing down task in a preliminary and simplified study performed on 20 students by interviewing them. The main part of the survey questionnaires is given in table 1.
How do the following factors influence or trigger your willingness to go out for a drive or a short hanging around sightseeing trip? Please, evaluate each factor with the number that most likely represent your standpoint. Mark 1 if not at all; 2: low; 3: slightly low; 4: neutral; 5: moderately high; 6: high; 7: very high.
Q1 friends and acquaintances Q2 local specialty and foods Q3 distance and travel distance Q4 family and relatives Q5 just feeling like going out Q6 avocation and/or interest Q7 for refreshing purpose Q8 contents on social media Q9 budget and costs
Q10 availability of time Q11 convenience of access Q12 mass media information Q13 popularity of the place Q14 ongoing shows and events
Q15 whether it has been a location for film/movie making Q16 pilgrimage destination
Q17 an important historical site Q18 an important cultural site
Q19 townscape, scene and view of the place Q20 natural environment of the place Q21 whether it is a hot spring town
Q22 whether there are leisure and event facilities Q23 whether there are shrines and temples
Q24 whether there is an old castle Q25 whether it is close to the sea
Q26 whether there are products not found anywhere else Q27 security situation of the place
Q28 whether there are curious things to enjoy in the place Q29 it makes me feel special
Q30 it allows one to spare time comfortably Table 1: Main part of the survey sheet
2.2 Data Processing
After checking out the collected data for validity, which left 10 answers out, the remainder 170 answers were further processed on a computer equipped with the OS Microsoft Windows 10. The ratings of the question were tabbed and stored in a file with Microsoft Excel 2016; and the processing per se was performed with statistical freeware R 3.5.1 (R Core Team, 2018). Firstly, ‘amap’ (Lucas, 2018) and ‘cluster’ (Maechler, Rousseeuw, Struyf, Hubert & Hornik, 2018) packages were added to the core of R to perform the cluster analysis, which allows one to generate clusters that express the rating levels of the evaluated factors. Secondly, ‘psych’ package was included to accomplish the exploratory factor analysis, from which factors (latent variables) were generated. These factors basically allows us to characterize the respondents according to communality. Lastly, but not least, the package
‘semPlot’ (Epskamp & Stuber, 2017) dedicated to the structural equations modeling was used to obtain a path model based on the statistical correlation of the latent variables (factors).
3. RESULTS 3.1 Cluster Analysis
In this work, we performed a non-hierarchical cluster analysis on the data set. As a result we obtained the dendrogram shown in Fig. 1. After some trials and errors, it was then concluded that 4 clusters would split the dendrogram in such a way that the composing data of each cluster would have similar attributes leading to clusters with relatively distinctive characteristics from each other.
Fig. 1: Partitioned dendrogram with four clusters.
Table 2 gives the proportions of respondents in each cluster. Cluster#1 is the largest one with 31.2% of answerers, which accounts for 53 subjects; the second largest group is cluster#3 with 25.8% (43 students); and the remainder of participants splitting nearly equally between cluster#2 (21.8%) and cluster#4 (21.2%). Since we do not have a cluster too big or too small relatively to others in this clustering, none of the clusters represents the majority or the minority of students.
cluster#1 31.2%
cluster#2 21.8%
cluster#3 25.8%
cluster#4 21.2%
Table 2: Proportion of respondents in each cluster
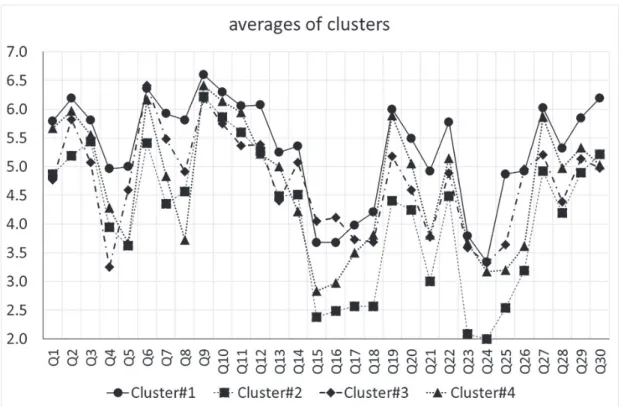
The averages of each question for each cluster are given in Fig. 2. Cluster#1 has the highest average values for almost all the items. In fact, for [Q15 whether it has been a location for film/movie making] and [Q16 pilgrimage destination], the averages rank right below cluster#3, which at these points have the second highest averages. The four clusters as a group have a behavior characterized by peaks and valleys with the first peak occurring at [Q2 local specialty and foods], followed by [Q6 avocation and/or interest], [Q9 budget and costs], [Q19 townscape, scene and view of the place], [Q22 whether there are leisure and event facilities], [Q27 security situation of the place] and [Q30 it allows one to spare time comfortably]. On the other hand, conspicuous valleys can be noticed at around [Q4 family and relatives] and [Q5 just feeling like going out], [Q8 contents on social media], [Q15 whether it has been a location for film/movie making] through [Q18 an important cultural site], [Q21 whether it is a hot spring town], and [Q23 whether there are shrines and temples] through [Q26 whether there are products not found anywhere else]. Moreover, multiple clusters have averages at these points falling short of the reference [4: neutral] used to evaluate the items.
Fig. 2: Characterization of clusters by means of averages of the measured variables (assessed items).
3.2 Factor Analysis
Figure 3 shows the result of factor analysis achieved by means of the command line ‘factanal’ in R.
Fig. 3: Output of ‘factanal’. Upper section gives the uniqueness values, the loadings are given in the main table, and the cumulative variances are given in the lower table.
The number of factors was established after some trials and errors taking the usual parameters into consideration.
From this, we can see that the cumulative variance summed up to 0.445 for p-value of 0.000136 and was the best we could obtain here. Nevertheless a greater value of cumulative variance is expected, this model is hereafter adopted to
get some insight into the problem focused on here. Note also that on taking into account only variables with factor loadings larger than 0.40, some of the assessed elements were left out of the factor analysis model; namely, measured variables [Q6 avocation and/or interest], [Q13 popularity of the place], [Q4 family and relatives], [Q21 whether it is a hot spring town], [Q29 it makes me feel special], [Q20 natural environment of the place], [Q22 whether there are leisure and event facilities], and [Q1 friends and acquaintances].
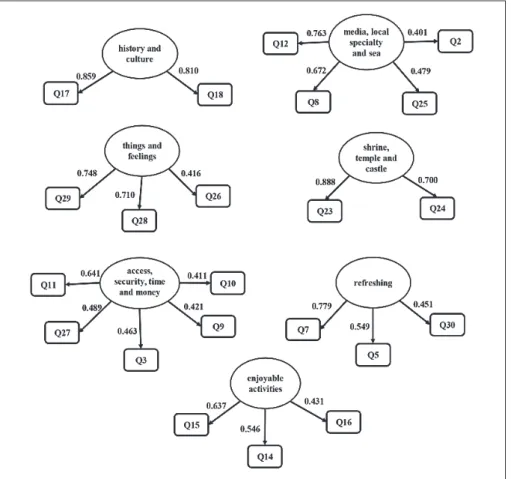
Figure 4 illustrates the factor analysis model with the factors (latent variables) renamed. Factor (latent variable) 1 was renamed factor <history and culture> because it is correlated with measured variables [Q17 an important historical site] and [Q18 an important cultural site], and the respective loadings are 0.859 and 0.810. The remainder of the factors and the loadings are as follows.
Latent variable <media, local specialty and sea> correlated to measured variables [Q12 mass media information]
(0.763), [Q8 contents on social media] (0.672), [Q25 whether it is close to the sea] (0.479), and [Q2 local specialty and foods] (0.401); latent variable <things and feelings> to measured variables [Q29 it makes me feel special]
(0.748), [Q28 whether there are curious things to enjoy in the place] (0.710), and [Q26 whether there are products not found anywhere else] (0.416); latent variable <shrine, temple and castle> to measured variables [Q23 whether there are shrines and temples] (0.888), and [Q24 whether there is an old castle] (0.700); latent variable <access, security, time and money> to measured variables [Q11 convenience of access] (0.641), [Q27 security situation of the place]
(0.489), [Q3 distance and travel distance] (0.463), [Q9 budget and costs] (0.421), and [Q10 availability of time]
(0.411); latent variable <refreshing> to measured variables [Q7 for refreshing purpose] (0.779), [Q5 just feeling like going out] (0.549), and [Q30 it allows one to spare time comfortably] (0.451); and latent variable <enjoyable activities> to measured variables [Q15 whether it has been a location for film/movie making] (0.637), [Q14 ongoing shows and events] (0.546), and [Q16 pilgrimage destination] (0.431).
Fig. 4: Factor analysis model with factor loadings of the measured variables.
3.3 Structural Equations Modeling (SEM) Analysis
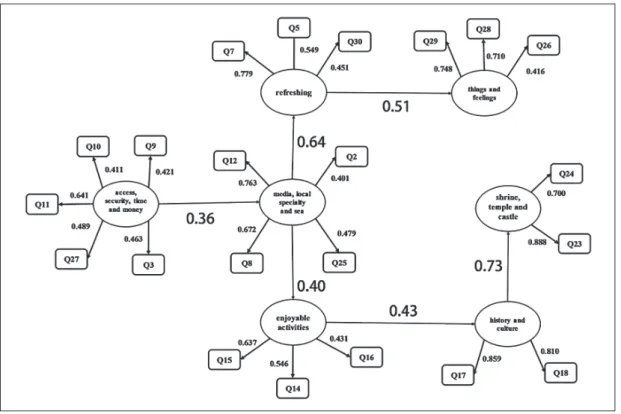
Figure 5 shows the model obtained from structural equations modeling analysis. The measured variables related to the latent variables (factors) are, apart from some slight variations in the loading factors, as established in the factor analysis performed in the previous section.
Fig. 5: Model generated by the structural equations modeling analysis.
The starting point of the model is the leftmost variable latent <access, security, time, money>, from which we reach the latent variable <media, local specialty and sea>. The standardized coefficient of correlation between these two variables reads 0.36. The model then ramifies into paths from the latent variable <media, local specialty and sea>. Following the upper branch, the next latent variable is <refreshing> and the coefficient of correlation between the latent variables is 0.64. Finally, the last upper branch links <refreshing> and <things and feelings> and the coefficient of correlation between them is 0.51. Now, focusing on the lower branch, we see that there is a path departing from the latent variable <media, local specialty and sea> down to latent variable <enjoyable activities>
with coefficient of correlation marking 0.40; and stretching from the latter to the latent variable <history and culture>
with correlation scoring 0.43; and finally from <history and culture> down to the latent variable <shrine, temple and castle> with coefficient of correlation pointing 0.73.
4. DISCUSSION
Focusing on the factor analysis results, the measured variables [Q17 an important historical site] and [Q18 an important cultural site] are relatively strongly correlated to the latent variable <history and culture>. On the other hand, clustering analysis shows that these variables have average values below rank [4: neutral]. Thus these suggest that young female students are in general unlikely to think of going out for a trip if the place does not offer any other option than these choices.
As a matter of fact, this interpretation is supported by the measured variables [Q23 whether there are shrines and temples] and [Q24 whether there is an old castle], which make up the latent variable <shrine, temple, castle>, since
these variables have also relatively small averages. In addition, the latent variable <enjoyable activities> is another factor that apparently does not influence the respondents’ willingness to go out. This assertion holds if we see that the measured variables [Q15 whether it has been a location for film/movie making], [Q14 ongoing shows and events], and [Q16 pilgrimage destination] have average values at valley points in Fig. 2.
At the other end, we have that measured variables [Q11 convenience of access], [Q27 security situation of the place], [Q3 distance and travel distance], [Q9 budget and costs], and [Q10 availability of time], which make up the latent variable <access, security, time and money>, have positive influence on the willingness to go out. The same can be said about the measured variables [Q12 mass media information], [Q8 contents on social media], [Q25 whether it is close to the sea], and [Q2 local specialty and foods], which are correlated to the latent variable <media, local specialty and sea>.
The remainder of the factors have mixed variables, with some of them being larger than rank [4: neutral] and others not. Moreover, variables not making up factors are also worth being considered. Indeed, measured variables [Q1 friends and acquaintances], [Q19 townscape, scene and view of the place], and [Q22 whether there are leisure and event facilities] affect the students’ willingness to go out.
These findings are also endorsed by the structural equations model shown in fig.5, whose latent variable <access, security, time and money> shows that it all comes down to whether the students have time and money, and sense of security regarding the destination, because accessibility is in most cases associated with transportation fares and time to reach it.
Supposing that this latent variable is somehow secured, the latent variable <media, local specialty and sea>
indicates that the respondents are likely to go out to some place if it is being or has been a target of media coverage or on the social media with the former having stronger influence than the latter. Now, the bifurcation in the model means that the students are more susceptible to going out aiming at the latent variable <refreshing> rather than
<enjoyable activities>, which includes the measured variable [Q16 pilgrimage destination].
Moreover, the coefficient of correlation of the lower branch between the latent variables <enjoyable activities>
and <history and culture> is somewhat relatively weaker, so that the lower path of the model is not so influential an option for these respondents. However, once they embark on this model path driven by the latent variable <history and culture>, then the next latent variable <shrine, temple and castle> turns out to be an indispensable factor.
5. FINAL COMMENTS
From the academic point of view, these results allow us to shed some light on the willingness to go out for a drive or a short hanging around sightseeing trip behavior commonly seem among Japanese college students. From a practical standpoint, they allow, for example, policy makers to develop their regions to attract young people as tourists.
In fact, the contribution of this paper is that it provides useful data for policy makers and local tourist industry if they are interested in developing their region by promoting the regional tourism as a mean of reinvigorating the local economies.
Indeed, it is a quite known fact that, in general, shrines, castles and spas are among the many famous tourist destinations in regional areas; but it is also a fact that not many young people visit these places on their own, unless on certain special occasions.
Now, the findings so far suggest that if one is interested in targeting young female students as potential tourists or visitors then measured variables [Q19 townscape, scene and view of the place], and [Q22 whether there are leisure and event facilities] composing latent variables <media, local specialty and sea> should be considered as ways of improving the current conditions.
LIMITATION AND STUDY FORWARD
The results here should be considered with care since this investigation focused only on female college students residing in the ‘Tohoku region’. Moreover, preferences and tastes change with age and also across genders, so if one is targeting females in their late twenties or older, a different model should be considered. The same is true if the region is intending to develop something family oriented. The first step is to build up a model reflecting their life styles. Thus, we recommend that anyone with the intention to profit from this work redo the modeling study adapted to their own conditions.
ACKNOWLEDGMENT
The authors would like to express their gratitude to students of the college for their cooperation and help. They also thank all their colleagues and staff members at Yonezawa Women’s College as well as the institution for the support and incentives to pursue this work.
REFERENCES
1. Maeda (2006). Social psychology of tourism, Kitaohji press (Tokyo) (in Japanese).
2. Yashiro, K. & Oguchi, T. (2006). Individual preferences for sightseeing destinations determined by ‘individual Primal Scene’ and Psychological Differences, The Tourism Studies Quarterly, 15(1), 27-33.
3. Yamamoto, M. (2016). A comparative study on travelers’ intentions to visit sightseeing areas and its factors, The Nagoya Gakuin Daigaku Ronshu - Social sciences, 54(4), 165-173.
4. Tanaka, K. (2017). Analysis of elements of regional attractiveness based on “regional brand research”, E-journal GEO, 12(1) 30-39.
5. Hawkinson, E. (2013). Social media for international inbound tourism in Japan: A research model for finding effective eWOM mediums, Proceedings of Japan Foundation for International Tourism, 20, 41-48.
6. Suzuki,S. & Kurata, Y (2018). An analysis of reaction data to tourist information post on Facebook, The international journal of tourism science, (11), 27-34.
7. Tao, A. & Kodate, A. (2017). The influence analysis of social media on tourism: Case study of Instagram posted contents, IEICE technical report, 116(488), 117-122.
8. Kawamorita, S., Anzai S. & Kazama, S. (2017). Social science analysis using social media data to evaluate public interest in river, Journal of Japan Society of Hydrology and Water Resources, 30(4), 209-220.
9. Morikawa, T, Takeuchi & H., Kako, Y. (1991). Destination choice analysis of vacation trips considering attractiveness of regions and probabilistic choice sets, Infrastructure Planning Review, 9(11), 117-124.
10. Kameyama Y. (2017). Inbound from East Asia region and overseas business developments by local governments, The Japanese Journal of Transportation Economics, 60, 55-62.
11. Okamoto, T & Sato, H. (2015). Tourist destinations and information-seeking as a function of sightseeing motives, Chiiki burando kenkyuu, 10, 13-27.
12. Uysal, M, Schwartz, Z. & Sirakaya-Turk, E. (2017). Management Science in Hospitality and Tourism: Theory, Practice, and Applications, Apple Academic Press.
13. Kumar, D. & Purani, K. (2018), Model specification issues in PLS-SEM, Journal of Hospitality and Tourism Technology, 9 (3), 338-353. https://doi.org/10.1108/JHTT-09-2017-0105
14. R Core Team (2018). R: A language and environment for statistical computing. R Foundation for Statistical Computing, Vienna, Austria. Retrieved from https://www.R-project.org/, accessed on 2018/1/28.
15. Lucas, A. (2018). amap: Another Multidimensional Analysis Package. R package version 0.8-16. Retrieved from https://CRAN.R-project.org/package=amap, accessed on 2018/1/28.
16. Maechler, M., Rousseeuw, P., Struyf, A., Hubert M. & Hornik, K. (2018). Cluster: Cluster Analysis Basics and Extensions. R package version 2.0.7-1. Retrieved from https://cran.r-project.org/web/packages/cluster/cluster.pdf, accessed on 2018/1/28.
17. Revelle, W. (2018) psych: Procedures for Personality and Psychological Research, Northwestern University, Evanston, Illinois, USA. Retrieved from https://CRAN.R-project.org/package=psych Version = 1.8.12, accessed on 2018/1/28.
18. Epskamp, S. & Stuber, S. (2017). semPlot: Path Diagrams and Visual Analysis of Various SEM Packages' Output. R package version 1.1. Retrieved from https://CRAN.R-project.org/package=semPlot, accessed on 2018/1/28.
19. Hox, J.J., & Bechger, T.M. (1998). An Introduction to Structural Equation Modeling, Family Science Review, 11, 354-373.