博士学位論文
Study on the influence of the hop cultivation factors
on its growth, development and qualities
博士学位論文
Study on the influence of the hop cultivation factors
on its growth, development and qualities
2017 年 11 月 20 日
ACKNOWLEDGEMENTS
I would like to express the deepest appreciation to Dr. Shigeru Shigeoka,
Professor of Faculty of Agriculture, Kindai University, for his kind guidance, valuable
advice, and critical review throughout the work including the manuscript of this thesis.
I would like to express my gratitude to Dr. Masahiro Tamoi, Associate
Professor of Faculty of Agriculture, Kindai University, for reading text in its original
form.
I am thankful to Dr. Takahiro Hayashi, Professor of Faculty of Agriculture,
Kindai University, and Dr. Tsutomu Kawasaki, Professor of Faculty of Agriculture,
Kindai University, for their precious suggestions and comments.
I am deeply grateful to Dr. Yoshikazu Tanaka for his continuous support,
beneficial advice and helpful discussions throughout the work.
I extend our deep gratitude to Mr. Isao Onoda, who died on April 10, 2016. He
always supported me for not only my research activities but also my private life in
Czech Republic. And he connected me to many key persons from Czech hop industry.
I am deeply grateful to the members of Czech Hop Research Institute s.r.o., Dr
Jiří Kořen, Dr. Karel Krofta, Dr. Josef Patzak, Dr. Vladim
ír Nesvadba, Mr. Petr Svoboda,
Mr. Josef Vostřel, Mr. Miroslav Brybda, Mr. Pavel Kozlovsky, Dr. Josef Ježek, Dr.
Jaloslav Pokorny for excellent technical help to execute cultivation tests.
I thank hop growers, Mr. Karel Šramek, Mr. Cyprian, Mr. Pavel
Řepík, Mr. Petr
Škoda, Mr. Vladim
ír Hlavsa, Mr. Radek Vostřel, Mr. Bohumil Pazler, Mr. Josef Fric, Mr.
Zdenek Rosa, Mr. Jan Soukup for permission to observe their hop gardens and to use
their hops for analyses and brewing trials.
I would like to offer my special thanks to the members of Zatec Hop Company
s.r.o., Mr.Jiri Sedivy, Mr Zdenek Sokol, Mr. Petr Hynek, Mr. Jan Solc, Ms.
Libuse
Prasilová, Ms. Katerina Fejfarova and the director of V. F. Humulus s.r.o., Dr. František
Kroupa for arrangement experimental plans and support works.
I would also like to express my gratitude to my colleagues from Suntory, Mr.
Koji Kojima, Mr. Shinsuke Sengi, Mr. Noboru Ito, Mr. Nobuyuki Fukui, Dr. Kaneo Oka,
Dr. Takako Inui for their kind supports and many useful advices for the promotion my
research works.
Finally, I owe my deepest gratitude to my family members, especially to my
wife, Sakiko. Without her persistent support, this thesis would not have been possible.
CONTENTS
CHAPTER I Introduction……….1
CHAPTER II The influence of pruning and harvest timing
on the growth, development, yield, and qualities of hop………5
CHAPTER III The influence of the age of a hop plant
on the growth, development, yield, and qualities of hop………...…29
CHAPTER IV The influence of Apple Mosaic Virus
on the growth, development yield, and qualities of hop………....47
REFERENCES ………...67
1 CHPTER 1
INTRODUCTION
Hop (Humulus lupulus L.) is a perennial, dioecious, and climbing plant. In plantations, and
while still underground, hop sprouts from the root during spring and goes up the wires by twining. It
reaches a height of 6–8 m only three months after sprouting and in early summer it blooms; hop then
develops cones, which are generally harvested within one to two months after blooming. Hop provides bitterness, fullness, and flavor to beer, all derived from the α-acids,
polyphenols, terpenes, etc. present within it (Inui et al., 2013). In order to control beer taste and
flavor, different cultivars (Kovacevic et al., 2015) and different processed hop products, such as
pellets or hop extracts (each containing different components) are generally used. And controlling
the brewing process, especially the boiling process, is another effective means of determining beer
quality. In general, hops are added at the beginning of the wort boiling stage to isomerize alpha acid
to iso-humulone in order to adjust the bitterness of the beer. However, the addition of hops at the
beginning of the wort boiling stage also causes a loss of hoppy aroma due to the increase in
evaporation of aroma compounds such as terpenoids. Thus, the timing and the amount of hops added
needs to be adjusted in order to achieve the target bitterness and the desired aroma qualities. In
addition, the fermentation conditions, the yeast strains used and the temperature, pressure and tank
size are also important and must be controlled because they can affect the transition ratio of
2 Opstaele et al., 2006; Schönberger, et al., 2011).
To some extent, it is possible to achieve the desired beer quality simply by selecting
specific cultivars, adding hop products, and brewing it properly. However, hop is an agricultural crop
and its quality is itself unstable, varying according to climate (Krofta and Kucera, 2010), root
properties (e.g. age, viral infections), and cultivation conditions such as fertilizing, pruning, and
harvest (Sharp et al., 2014). Therefore, it is important to control cultivation conditions in order to
obtain high quality hop.
Many researchers have studied the relationship between hop quality and its cultivation
conditions. Krofta and Kucera (2010) reported that hop quality could be affected by the climatic
conditions in the cultivation region and year. Mozny et al. (2009) also reported that recent climate
changes led to earlier flowering and reduced α-acid content. Kishimoto et al. (2008) reported that the
changes observed in the amounts of hop aroma compounds were due to the use of agrochemicals to
prevent downy mildew. In addition, the prohexadione calcium treatment applied during blooming
period is known to affect some of the secondary metabolites (Kavalier et al., 2014). It has also been
reported that viral and viroidal infections reduce the vegetative growth of hops (Pethybridge et al.,
2008; Fussy et al., 2012; Sano, 2012). Various cultivation factors can affect hop photosynthesis
(Pokorny et al., 2011). Hop root age also affects the aroma quality in hop and beer (Pluhackova et al.,
2011). Hence, several cultivation factors can affect hop quality.
Cultivation factors can be classified into three types: 1) ‘natural origin’, such as the kind of
3
timings; 3) ’ climatic origin’, such as temperature, rainfall, and the amount of sunlight.
Table I-1 Classification of cultivation factors
In this thesis, we investigated the influence of pruning, blooming and harvest timings
(culture-controlled), plant age(natural origin) and virus(culture-controlled and natural origin) on
the hop growth, development, qualities and beer qualities for Saaz variety cultivated in Saaz region
in Czech Republic. Saaz variety is mainly cultivated in three areas - Saaz, Aucha, and Tirschitz in
Czech Republic. Saaz region was selected for this study because it is the largest of the three (Fig.
I-1).
Fig. I-1. The three hop cultivation areas in the Czech Republic
factor type variety
Soil Plant age
Disease (Fungi, Bacteria, Virus, Viroid)Fungi etc. Pruning time Harvest time Fertilizer application etc. Temperature Rainfall Amount of sunlight etc. 1) Natural origin 2) Culture-controlled 3) Climatic origin
5 CHPTER II
The influence of pruning and harvest timing
on the growth, development, yield, and qualities of hop
Introduction
In this chapter, we investigated the culture-controlled factors, pruning, blooming, and
harvest timings, and analyzed the relationship between these three variables and hop aroma quality.
Pruning and harvest were considered as the start and end processes of hop cultivation, respectively.
Regarding cultivation timing, the behavior of chemical compounds after blooming has been
analyzed previously (Skinner et al., 1974; Menary and Doe, 1983; Murphey and Probasco, 1996).
The optimal harvest timing for each hop variety can be estimated from indicators such as yield and
appearance (Lutz et al., 2009). It was also confirmed that harvest timing influences hop chemical
components, such as terpenes, and these affect the beer’s sensory quality (Sharp et al., 2014). In
addition, hop storage index (HSI), an indicator of hop’s deterioration, was found to increase with a
delay in harvest timing (Cocuzza et al., 2013). On the other hand, functional flavonoids, such as
6
Although the above-mentioned studies considered hop maturity and harvest timing, none
of them included pruning and blooming timing as variables. In the present study, hop quality (α-acid,
essential oils, and terpene compounds) and beer sensory quality were studied with the Saaz variety
from Saaz area, Czech Republic. In the Saaz variety, pruning is performed during April in order to
guide the twining of the new sprout above ground, and it lasts about 20 days; harvest of hop cones
occurs from the middle of August to the beginning of September, within about 25 days (Fig. II-1).
Fig. II-1. Flow of Saaz hop cultivation in Czech Republic
Pruning and harvest seasons are thus longer than those of other varieties in the world, which might
be related to the fact that over 90% of the cultivation area in the Czech Republic is occupied by one
variety (Saaz). This is a very wide range and might result in the fluctuation of hop and beer quality.
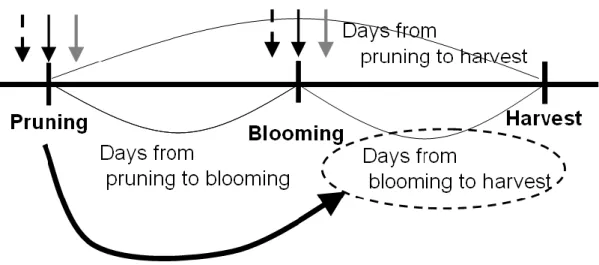
Because pruning timing may affect blooming timing, it may also affect the vegetative and
reproductive periods as a result (Fig. II-2.), which is the main reason for including the effect of
pruning timing on blooming timing and hop quality, and the effect of the time span between
7
Fig. II-2. Point of view and hypothesis in this study about hop cultivation period
Materials and Methods
Test conditions
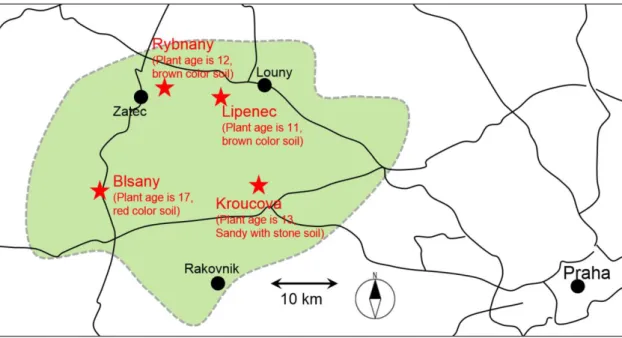
Four villages—Rybnany, Lipenec, Blsany, and Kroucova—in the Saaz region were
selected and used for experimental cultivation (test gardens). These four are located in the north-west,
north, south-west, and south-east side of the Saaz region, respectively (Fig.II-3), and are at distance
of about 10 km from each other. The kind of soil and plant age differed between the test gardens
(Fig.II-3). As shown in Table I-1, in 2012, 15 combinations of pruning and harvest timings were
tested within each garden: three pruning (Apr. 5, 15, and 25) conditions were combined with five
harvest timings (Aug. 15 and 25, Sep. 3, 10, and 20); eight vines were harvested for each
combination of pruning and harvest conditions. The influence of harvest timing was also examined
8
Fig.II-3. Geographic distribution of the four test locations. Saaz region is shown by green color.
Table II-1. Experimental design
Location Year Pruning Harvest
15-Aug 24-Aug 3-Sep 12-Sep 20-Sep 15-Aug 24-Aug 3-Sep 12-Sep 20-Sep 15-Aug 24-Aug 3-Sep 12-Sep 20-Sep 15-Aug 22-Aug 29-Aug 5-Sep 12-Sep 19-Sep 18-Aug 24-Aug 30-Aug 7-Sep 14-Sep 21-Sep 16-Apr 2011 14-Apr -Rybnany 2010 -Rybnany -Lipenec -Blsany -Kroucova 2012 5-Apr(±1day) 15-Apr(±1day) 25-Apr(±1day) -Rybnany
9 Climatic data
Temperature and precipitation data were obtained from the climate observation systems
administrated by the Hop Research Institute Co., Ltd., for four locations near the four experimental
gardens (Rybnany, Lipenec, Blsany, and Kroucova).
Hop blooming and cone formation
Reproductive development characteristics i.e., flowering and cone formation were
recorded every week from the end of June to the middle of August. Flowering and cone formation
seasons were defined by the 50 % flowering/ cone formation ratio, calculated from the average of
that observed in the eight vines collected in each experiment.
Calculating the yield
A picking machine was used to collect all the raw hop cones and their weight and moisture
content were determined. Shortly after harvest, they were kilned at 55 ºC for about eight hours until
their moisture content reached 10 ± 1%. After kilning, the dry weight of each hop cone was
determined in order to calculate the accurate yield.
10
Hop samples were collected soon after kilning was finished. Kilned hop samples were
packed by nitrogen purge and stored below their freezing point until used in chemical analyses and
brewing trials.
Chemical analyses of hop samples
The chemical analyses of hop samples were conducted at the Hop Research Institute Co.,
Ltd. in Saaz, Czech Republic. Hop α-acid was measured using the EBC 7.7 liquid chromatography
(High Performance Liquid Chromatography) method with a Nucleosil RP C18 column
(Macherey-Nagel, Germany, 5 μm, 250 × 4 mm) and a SHIMADZU LC 20A chromatograph
(Shimadzu, Japan) with diode array detectors (DAD).
Hop essential oils were obtained by steam distillation and the terpene content of the distilled oil was
determined by gas chromatography (GC) on a DB 5 capillary column (Chromservis, Czech Republic,
30 m × 0.25 mm × 0.25 μm film thickness) using a Varian 3400 gas chromatograph together with a
Finnigan ITD 800 mass detector. Qualitative criteria were based on a comparison of GC retention
indices and mass spectra with those of pure compounds. A semi-quantitative evaluation of the
composition of hop oils was performed on the basis of the peak area of individual components and
expressed in relation to the total integrated area of all substances involved.
Hop color measurement
11
A dried hop cone was pulverized using a coffee mill (Melita Japan Ltd.) Milling was
adjusted to get identical particle sizes. The color of pulverized hop was evaluated using colorimetric
values in a CIE L*a*b system measured with a CM-2022 spectrophotometer (Minolta Co., Ltd,
Tokyo, Japan), and the data were calculated under a 10º observer and D65 illuminants. Color data
were analyzed using SpectraMagicTM color-control software (Minolta). The closest RHSCC
number to hop’s cone color, based on its CIE L*a*b value, was obtained by visual discrimination
and measurement with the device mentioned above. RHSCC number is a standard reference for plant
color identification in the horticultural industry selected by the Color Classification System version
2.1.1 (The Japan Research Institute Co., Ltd.) and can be used for objective selection of the closest
RHSCC number by color data.
Hop preparation for sensory evaluation
A dried hop cone was pulverized using a coffee mill (Melita Japan Ltd.), adjusting the
milling power in order to get identical particle sizes. One gram of pulverized hop was added to 100
ml of 10 mM citrate buffer solution (pH 5.3) at 100 ºC. This mixture was kept at this temperature,
without heating, for 5 min and cooled on ice water afterwards. Hop grounds were then removed
using a 0.45 μm filter and 5 ml of the resulting filtrate was diluted in 20 ml of distilled water for
sensory evaluation.
12
Trials were conducted in a pilot scale brewery (100 L) with a malt ratio of 100 %. Hops
were added twice: at the beginning (kettle hopping) and at the end (late hopping) of wort boiling. In
order to compare differences in hop aroma characteristics, an identical amount of each hop sample
was added during the late hopping stage, and only at this stage. The amount of hop extracts added at
kettle hopping was decided to be the same, in order to provide identical bitterness to beer samples.
Worts were fermented at 10 ºC using lager yeasts.
Linalool analyses in beer
Exactly 2.0 g of beer were poured into a 10 ml crimp-top vial; 20 μl of 50 mg/l
beta-Damascone were then added (final concentration = 0.5 mg/l) and a Mono trapTM (GL Sciences
Inc.) was introduced in the vial, before attaching the cap (Ф 20 mm). The vial was strongly shaken
for 30 min, the Mono trapTM was taken out and put into a MT Extract Cup, and 200 μl of methylene
chloride were added to the vial as the extraction solvent; water was added outside the glass
containers and the MT Extract cup was again set in the vial. Samples were sonicated for 5 min. and
0.2 μl of the extraction solvent were then used in Gas Chromatography-Mass Spectrometry and
quantified by the Single Ion Monitoring mode.
Sensory evaluation
Seven well-trained panelists conducted beer sensory evaluation based on hop aroma
13
(woody). Hop aroma in beer was compared to that of hop essential oil produced by Botanix Ltd. and
panelists scored each characteristic on a scale from 0 to 5. All scores were then normalized to
remove any panelist bias. 4 or 5 samples from same location and same year were conducted at a
single session and it was done at least 2 times in different date. Their order was randomized for each
panelist.
Statistical analysis
Statistical tests were conducted using the JMP 10.01 software (SAS, Cary, NC, United
States). Statistical differences between means were determined by two-way ANOVAs (Analysis of
Variance), considering three significance levels: P < 0.05, P < 0.01, and P < 0.001.
Results and Discussion
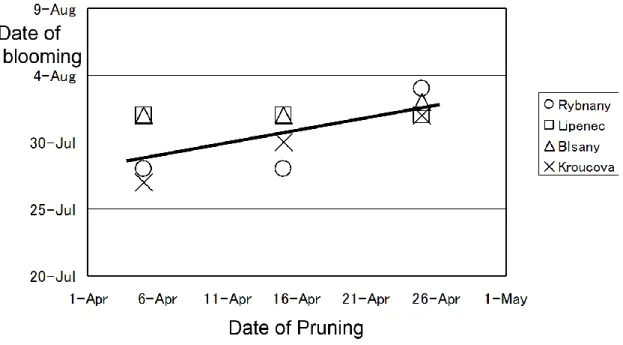
Influence of the pruning date on the blooming date
Fig. II-4 shows the relationship between pruning and blooming (cone formation) dates at
the four locations, in 2012. It can be seen that pruning date does not influence blooming date as the
slope of the line corresponding to their correlation is very small. There was no correlation between
the date of pruning and the date of cone formation. However, shorter pruning intervals corresponded
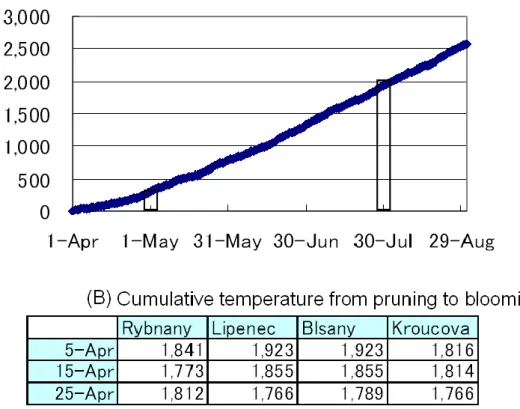
to shorter blooming intervals. The cumulative temperature calculated from the average temperature
14
(blooming period). Hence, the ratio of cumulative temperature in April is only 15 %, suggesting that
the 20 days difference in pruning dates in April did not affect the blooming dates.
Fig. II-4. Relationships between pruning and blooming times. Both horizontal and vertical axes have
15
Fig. II-5. Cumulative temperature calculated from daily average temperature, from Apr.
1 to Aug. 31 (A) and from pruning to blooming (B).
Influence of the pruning date on hop quality and yield
The relationships between pruning date and hop yield, chemical components, and aroma
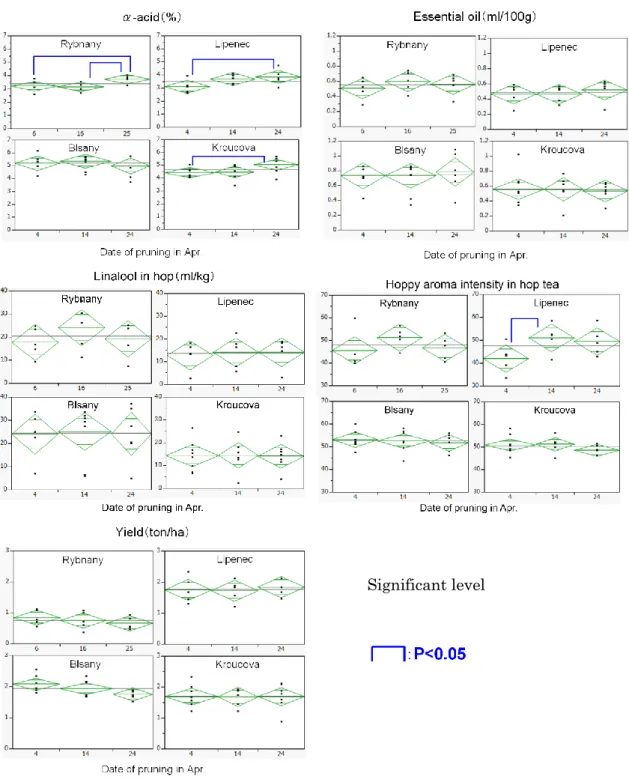
intensity in beer investigated at the four locations in 2012 are shown in Table II-2. There were no
significant effects of pruning date on hop essential oils, linalool, sensory score, and yield; α-acid was
significantly affected (P < 0.05). Results confirmed that the amount of essential oils and linalool in
hop did not change according to the pruning dates in all four locations (Fig. II-6). Hop aroma
16
later tended to have a slightly higher amount of α-acid, and thus significant differences were found
(Fig. II-6). The length of the vegetative period, from pruning to blooming, may therefore affect
hop’s secondary metabolism. However, the data on α-acid behavior presented here is derived from
only one year of observations, and the same should be confirmed for several cultivation years. As
described before, blooming time may not vary with pruning time, so pruning may not affect the
period from blooming to harvest (Fig. II-6). This is reflected in the results of this section, as pruning
date rarely affected hop quality.
Table II-2. Results of the Two-way ANOVAs performed, considering locations (A) and years (B). F-
values and their significance are shown for each test. L=location, P=pruning date, B=blooming date,
B-H=time period between blooming and harvest, Y=year
* Significance level at the 95.0 % level; ** Significance level at the 99.0 % level; *** Significance
17
Fig. II-6. Influence of the pruning date on hop quality, yield, and aroma in beer.
Influence of the harvest date on hop quality and yield
The influence of different harvest times was examined at the four locations in 2012 and at Significant level
18
Rybnany in three consecutive years (Table II-1). Significant effects at the 99.9% level were detected
in the period from blooming to harvest for essential oils, linalool, and sensory score (Table II-2).
Fig.II-7A shows the behavior of α-acid, oil content, and linalool in hop. As blooming timings were
almost identical for all gardens (within 1 week), horizontal axes in Fig.II-6 correspond to days from
the 1st of August. The amount of essential oil and linalool increased at all locations until the middle
of September; these increases only continued until the end of September in Blsany and Kroucova. It
is difficult to understand why these two patterns exist. In association with the increase in essential
oils and linalool, hop aroma intensity also increased; α-acid and yield were almost stable during the
harvest period. Six mono-terpenes (linalool, geraniol, myrcene, ocimene, β-pinene, D-limonene) and
four sesqui-terpenes (β-farnesene, bergamotene, α-humulene, β-caryophyllene) in hop were analyzed
(Fig.II-8) In the four locations, sesqui-terpenes were generated early in the harvest period and
mono-terpenes were generated later. These results suggest that harvest timing affects both intensity
and balance of the hoppy aroma in beer.
We also investigated the influence of the harvest date through three consecutive years
(2010, 2011, and 2012) at Rybnany (Table II-2B). Significant effects at the 99.9% level were found
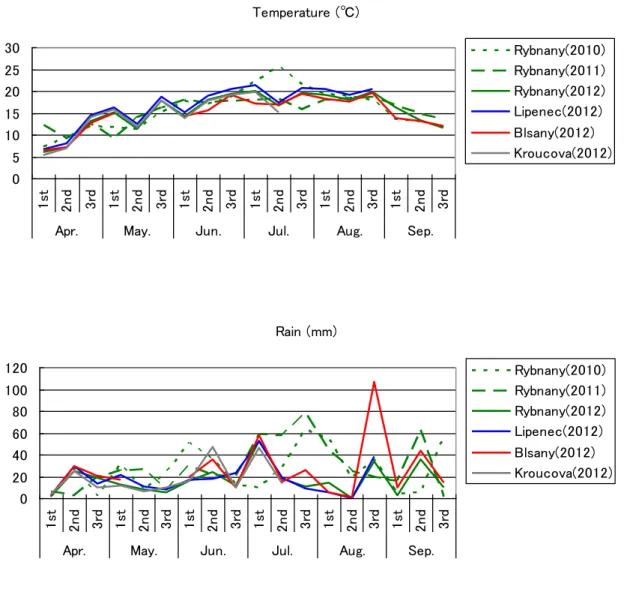
in the period from blooming to harvest for essential oils and linalool. According to the climatic data,
differences in temperature and rainfall between the three years in one location are larger than those
observed between the four locations in one year (Fig. II-9). Essential oils and linalool content in hop
increased during the harvest period in all years; while sesqui-terpenes were mainly generated in the
19
This behavior is therefore similar to that found for the four locations in 2012 (Figs. II-7 and II-8).
A
20 B
Fig.II-7. Influence of hop harvest time on beer hop quality, yield, and aroma, at the four locations,
during 2012 (A) and at one location (Rybnany) in 2010, 2011, and 2012. α -acid(%) 0.0 1.0 2.0 3.0 4.0 5.0 0 10 20 30 40 50 60
Days from 1-Aug.
2010 2011 2012 Oil(ml/100g) 0.0 0.2 0.4 0.6 0.8 1.0 0 10 20 30 40 50 60
Days from 1-Aug.
2010 2011 2012 0 20 40 60 80 100 0 20 40 60
Days from 1-Aug. linalool in hop (ml/kg) 2010 2011 2012 Yieldil(ton/ha) 0.0 0.5 1.0 1.5 2.0 2.5 3.0 0 10 20 30 40 50 60
Days from 1-Aug.
2010 2011 2012
22
Fig.II-8. Variation of terpenes during hop harvest period. The composition of the radar chart is
shown on the top of the figure. The six mono-terpenes are indicated in bold characters; the other four
compounds are sesqui-terpenes, Numbers show the ratio of each terpene towards the average amount
calculated for each year. The average amount was calculated from 60 samples in 2012 and from five
samples in 2010 and 2011.
Fig. II-9. Climate data for the four locations studied in 2012 and for the three years (2010, 2011,
2012) in Rybnany. Temperature (℃) 0 5 10 15 20 25 30 1 st 2nd 3rd 1st 2nd 3rd 1st 2nd 3rd st1 2nd 3rd 1st 2nd 3rd 1st 2nd 3rd
Apr. May. Jun. Jul. Aug. Sep.
Rybnany(2010) Rybnany(2011) Rybnany(2012) Lipenec(2012) Blsany(2012) Kroucova(2012) Rain (mm) 0 20 40 60 80 100 120 1 st 2nd 3rd 1st 2nd 3rd 1st 2nd 3rd st1 2nd 3rd 1st 2nd 3rd 1st 2nd 3rd
Apr. May. Jun. Jul. Aug. Sep.
Rybnany(2010) Rybnany(2011) Rybnany(2012) Lipenec(2012) Blsany(2012) Kroucova(2012)
23 Influence of the harvest date on beer hoppy aroma
We brewed beer using the hops harvested in Rybnany in 2011 and 2012. Results confirmed
that the intensity of hoppy aroma was stronger in beer brewed with later harvested hop compared to
that in beer brewed using the hop harvested in an early period. Beer linalool content showed the
same tendency as aroma intensity (data not shown). The balance of hoppy aromas is different
between harvest times and these aromatic characters also differ between years (Fig. II-10). This
tendency is generally consistent with that of other varieties (Sharp et al., 2014). Therefore, although
hoppy aroma intensity may be an indicator for suitable harvest timing, it may be difficult to predict
24
Fig. II-10. Scores of beer sensory evaluation for hoppy aroma.
Change in hop color during the harvest period (Rybnany in 2011)
Historically, many brewers evaluating hop color might prefer bright green color to the
brown color from the overall view point. And there are some post-harvest methods to maintain its
bright green color such as sulfur treatment at kilning process. In this study, hop color changed during
the harvest period and the results of hop color measurements are shown in Fig. II-11 Early harvested
hops showed a bright green color, which gradually changed to yellow-brown towards the end of the
period. As shown in Fig. II-11, the a-value (indicating color change from green to red) tended to
increase during the harvest period whereas the hue angle ‘h’ (indicating the direction of the
rectangular coordinates - the horizontal axis is from green to red, the vertical axis is from blue to
yellow) decreased during the harvest period. Although the data shown in Fig. II-11 are only from
25
Rybnany and four locations in 2012). These results suggest hop color could be a good indicator to
estimate hop aroma quality. The brown colored hop harvested later in September was analyzed for
infections by downy mildew using qRT-PCR, but downy mildew infection was not confirmed (data
not shown). It can therefore be assumed that the change in hop color is due to the oxidation of
polyphenols or to the decrease of chlorophyll in hop bract during the harvest period.
a*(D65) -3 -1 1 3 5 7
15-Aug. 22-Aug. 5-Sep. 12-Sep. 19-Sep. 15-Aug. 24-Aug. 3-Sep. 12-Sep. 20-Sep. 2011 2012
(A)
(B)
26
Fig. II-11. Appearance of hop, according to its harvest date. Raw hop cones (A), ground hop cones
(B), a-value, showing the direction from green to red (C), and hue angle, showing the direction of
the rectangular coordinates (the abscissa is from green to red, the ordinate is from blue to yellow)
(D).
Conclusion
In this study, we have evaluated the influence of the pruning and harvest timing on hop
aroma characteristics, chemical components, appearance, yield, and beer quality in four locations
and in three years. The results indicated that the period from blooming to harvest had the significant
impact on the amount of essential oils, mono-terpenes and intensity of beer hoppy aroma in all
locations and in all years. On the other hand, pruning timing affect neither hop nor beer quality.
These findings should make it possible to select the best time for harvesting in order to give beer
h(D65) 75 80 85 90 95
15-Aug. 22-Aug. 5-Sep. 12-Sep. 19-Sep. 15-Aug. 24-Aug. 3-Sep. 12-Sep. 20-Sep. 2011 2012
27 products target aroma in accordance with the type of beer.
In future work, further studies need to be conducted to elucidate how secondary
metabolism are influenced by cultivation conditions such as temperature and rainfall. From these
studies, we could select the best time of harvest more logically and strategically. Recent studies such
as hop’s draft genome (Ono et al., 2014) and its secondary metabolism (Nagel et al., 2008; Wang et
al., 2008; Li, et al., 2014) would give support to develop genuine cultivation technologies those
contribute to hop and beer products.
Acknowledgements
The authors would like to thank all the members of the Hop Research Institute Co., Ltd. in
Saaz, Czech Republic for their contribution to hop analyses, and all the members of Zatec Hop
Company Ltd. for their kind support to this study. The authors would also like to thank all farmers
29 CHAPTER III
The influence of the age of a hop plant on the growth, development, yield, and qualities of hop
Introdcution
In this chapter, we investigated the natural origin factor, the age of hop plant. Hop is a
perennial plant. Same root stock has been used for 20-30 years until it could secure original yield for
its variety. Root continues growing after plantation and spread its root area in the soil year by year
and its vegetative growth and reproductive development may change in its condition. Although the
composition of secondary metabolites such as bitter compounds (humulones) and aroma compounds
(terpenes) may change according to hop plant age, such study have not been done by now. In this
chapter, we investigated the influence of hop plant age on vegetative growth, blooming time, hop
quality and beer quality for Saaz variety cultivated in Saaz region, Czech Republic.
Materials and Method
Test samples
Eight hop gardens (variety Saaz) in the Saaz region of the Czech Republic were selected to
30
clone (‘Osvald’s clone 72’). Samples from all 8 hop gardens were tested in 2 consecutive years, 2010
and 2011.
Table III-1 Test samples
All hops are ‘virus free’ and consist of ‘Osvald’s clone 72’.
Observations of hop growth and development
Nine different hop plants were selected in each test garden, and observations were carried
out on vegetative growth characteristics such as hop height (m), stem diameter (mm) and leaf size
(cm) at a height of 1.5 m, every 2 weeks from April to August. Reproductive development
characteristics such as flowering and cone formation were recorded every week from the end of June
to the middle of August. The dates of flowering and cone formation were defined by the date of
50 % flowering/cone formation.
Cultivation history
Farmers at each of the 8 test gardens recorded the cultivation history - including the date of
2010 2011 a 2010 1 2 b 2009 2 3 c 2008 3 4 d 2007 4 5 e 2006 5 6 f 2001 10 11 g 1996 15 16 h 1991 20 21 Age Year of planting Garden Variety Area Saaz Saaz in CZ
31
pruning, harvest, fertilizer and agrochemical application, and kilning condition after harvest.
Storage conditions for hop samples
Hop samples were collected from each farm as soon as kilning had finished after harvest.
They were then vacuum packed and stored at below freezing point until the chemical analysis and
brewing trials were ready to be carried out.
Chemical analyses of hop samples
Chemical analyses of hop samples were conducted by the Hop Research Institute Co., Ltd.
Saaz in the Czech Republic. Hop resins were measured using the EBC 7.7 liquid chromatography
(HPLC) method with a Nucleosil RP C18 column (Macherey-Nagel, Germany, 5 μm, 250 × 4 mm)
and a SHIMADZU LC 20A chromatograph (Shimadzu, Japan) with diode array detectors (DAD).
Hop essential oils were obtained by steam distillation and the terpene content of the distilled oil was
determined by gas chromatography (GC) on a DB 5 capillary column (Chromservis, CR, 30 m ×
0.25 mm × 0.25 μm film thickness) using a Varian 3400 gas chromatograph together with a Finnigan
ITD 800 mass detector. Qualitative criteria were based on a comparison of GC retention indices and
mass spectra with those of authentic compounds. A semi-quantitative evaluation of the composition
of hop oils was performed on the basis of the peak area of individual components and expressed
32 Brewing conditions
The batch size used for brewing was 100 liters, with a malt ratio of 100 %. Hops were
added twice – once at the beginning (kettle hopping) and again at the end (late hopping) after 90
minutes of wort boiling. Only test hops were used for the late hopping and, in order to compare any
differences in hop aroma characteristics, the same amount of each test hop sample was added during
the late hopping stage. The amount of alpha acid added at the first hopping was decided to be the
same bitterness between each beer sample. Each cold wort was fermented at 10 degrees Celsius
using lager yeast.
Sensory evaluation
Sensory evaluation was conducted by 7 well-trained panelists, using set criteria. Hop
aroma characteristics in the beer were evaluated using 5 generic hop aroma descriptions: floral,
fruity, citrusy, herbal and sylvan (woody). These characteristics were compared to the fraction of hop
essential oil produced by Botanix Ltd. Beer taste was evaluated in terms of 6 generic beer
characteristics: malty, sweet body, mild, sour and astringent. Panelists scored each characteristic on a
scale from 0 to 5. All scores were then normalized to remove any panelist bias.
Chemical analyses of terpenes in beer
Each beer sample was prepared by solid phase extraction, using Bond Elut ® JR-C18 500
33
addition of borneol, as an internal standard. CH2Cl2 was used for elution and the eluent obtained
was concentrated using a vacuum evaporator.
A 0.2 µl sample of extraction liquid was injected into a GC-MS (Agilent 7890 GC &
5975C GC/MSD) and analyzed under the following conditions.
Capillary column: DB-WAX (J&W Co. Ltd, 60 mm ×∅ 0.25 mm ×0.5 μm), oven temperature:
40-240 degrees Celsius (6 degrees Celsius/min.), [rising to 240 degrees Celsius for 20 min.,][240
degrees Celsius, 20 min.,] carrier gas: He, 1.5 ml/min., transfer line: 240 degrees Celsius, MS ion
source: 230 degrees Celsius, MS 4 polar: 150 degrees Celsius, front inlet: 240 degrees Celsius.
Results and Discussion
Growth and development behavior
There was little difference between 8 test gardens in terms of the date of pruning and
harvest or kilning condition after harvest. Vegetative growth data (just before harvest) are shown in
Fig. III-1 In younger hops (except for the 1-year-old sample in 2010), the stem diameter and leaf
size at 1.5 m height were larger than in the older hops in both 2010 and 2011. The lower vegetative
growth of the 1-year-old hop sample may indicate that the plants were in a transition phase, resulting
in smaller size. Reproductive development data are shown in Fig. III-2. In younger hops, the
number of days from pruning to cone formation was greater than that in older hops, in both years.
34
development starts late. Therefore, hop plant age may affect hop secondary metabolism and the
generation of aromatic substances such as terpene compounds.
Fig. III-1 Vegetative growth of hops: height (x), stem diameter at 1.5 m (y) and leaf size at 1.5 m
35
Fig. III-2 Reproductive development - days from pruning to cone formation
Chemical composition of hops
Alpha acid concentrations in the hops sampled are shown in Fig. III-3. In younger hops,
the alpha acid concentration was higher than that in older hops in both 2010 and 2011.
Fig. III-4 shows the relative concentration of 10 terpenes at different hop plant ages. In these radar charts, monoterpenes such as linalool, geraniol, myrcene, ocimene, β-pinene and
d-limonene are shown on the right-hand side. In general, these substances contribute to hoppy
aromas that can be described as floral, fruity and citrusy. Sesquiterpenes such as β-farnesene,
bergamotene, α-humulene and β-caryophyllene are shown on the left-hand side of the radar chart. In
general, these substances contribute to mild aromas that can be described as sylvan. The numerical
values shown on the radar charts express the relative ratio compared to the average percentage of
each compound in each essential oil. Average values were calculated from about 30 different
samples from each crop. The amount of essential oil and the relative percentage of each terpene
compound in the hops sampled are shown in Table III-2. It is obvious that in young hops, under 5
years old, monoterpenes that may contribute to hoppy aromas are found at lower levels (except for
ocimene) whereas sesquiterpenes that may contribute to a mild aroma are present at much higher
levels.
Vegetative growth was more luxuriant and flowering was later in the younger hops
36
secondary metabolism in younger hops may be different to that in older plants.
Fig. III-3 Content of α-acid in hops harvested from 8 different gardens in 2 consecutive harvest
37
Fig. III-4 Comparison of terpene profiles in hop samples. The 6 compounds indicated on the
right-hand side of the chart are monoterpenes (linalool, geraniol, myrcene, ocimene, β-pinene and
d-limonene). The 4 compounds indicated on the left-hand side of the chart are sesquiterpenes
(β-farnesene, bergamotene, α-humulene and β-caryophyllene). The charts show the relative content
of each compound in each age of hop, compared to the average of about 30 different hop samples
collected each harvest year.
Table III-2. Amounts of essential oils and the relative % of each terpene in hops from 8 different
gardens
Beer analyses
Brewing trials were carried out using 4 randomly selected samples (‘b’, ‘d’, ‘g’ and ‘h’ in
Table III-1) over 2 consecutive cropping years, 2010 and 2011. The results of beer sensory
evaluation are shown in Fig. III-5 and Fig. III-6. These radar charts show the average of the
normalized values obtained from all 7 panelists. Beers brewed from younger hops such as ‘b’ and ‘d’
tended to have less floral, fruity and citrusy characteristics (except for ‘d’ in 2011), as shown in Fig.
a b c d e f g h a b c d e f g h Oil amount ml/100g 0.64 0.49 0.62 0.52 0.54 0.75 0.53 0.54 1.04 0.44 0.61 0.64 0.58 0.71 0.57 0.58 Linalool rel. % 0.33 0.28 0.42 0.20 0.28 0.70 0.61 0.57 0.32 0.36 0.38 0.45 0.54 0.54 0.51 0.54 Geraniol rel. % 0.13 0.09 0.07 0.03 0.04 0.28 0.28 0.25 0.05 0.06 0.04 0.11 0.12 0.22 0.16 0.17 Myrcene rel. % 23.90 15.60 33.30 15.40 21.40 37.70 31.70 34.00 28.30 25.50 27.30 28.30 44.70 40.55 37.00 42.50 Ocimene rel. % 0.08 0.07 0.11 0.10 0.10 0.09 0.11 0.13 0.12 0.13 0.09 0.09 0.16 0.11 0.15 0.15 β -Pinene rel. % 0.47 0.34 0.48 0.28 0.36 0.55 0.50 0.55 0.39 0.44 0.33 0.46 0.66 0.52 0.54 0.63 D-Limonene rel. % 0.11 0.05 0.12 0.07 0.10 0.19 0.13 0.14 0.11 0.11 0.10 0.13 0.18 0.15 0.16 0.16 β -Farnesene rel. % 22.40 28.60 24.10 34.80 25.30 24.50 25.90 22.10 20.00 18.90 11.60 21.50 16.70 18.45 17.60 16.50 Bergamotene rel. % 0.94 1.00 0.77 1.02 1.02 0.87 0.93 0.78 0.80 0.88 0.83 0.94 0.71 0.77 0.75 0.75 α -Humulene rel. % 18.20 20.90 16.90 17.60 22.20 15.70 16.50 17.00 27.30 30.10 37.80 25.40 18.20 18.15 22.30 19.40 β -Caryophyllene rel. % 8.10 9.80 6.80 9.50 9.20 6.00 6.70 7.50 7.86 8.63 6.62 7.38 5.25 4.93 6.42 5.47 2011 2010
38
III-5. As shown in Fig. III-6, beers brewed from younger hops such as ‘b’ and ‘d’ also tended to have more malty and sweet characteristics (except for ‘d’ in 2011). In the case of ‘d’ in 2011, it may
have been difficult for panelists to recognize any malty and sweet taste in the beer because of its
floral aroma. Since the hops used in ‘d’ were 5 years old in 2011, it may no longer have been a
‘young’ hop sample. These results indicate that, in general, beers brewed from younger hops tend to
have weaker hoppy aromas that can be described as floral, fruity and citrusy, while malty and sweet
characteristics can be easily recognized.
Fig. III-5 Sensory results for hop aroma characteristics in beer. The charts show the average
39
Fig. III-6 Sensory results for beer taste. The charts show the average normalized sensory score from
7 panelists.
A comparison of the terpene compounds found in the hop and beer samples is shown in Fig.
III-7 and Fig. III-8. In these graphs, the relative amounts in each of the 4 samples are shown, with
the maximum value set at 1.0. The concentrations of aroma compounds in each beer are listed in
Table III-3, for reference. As mentioned in the ‘chemical composition of hops’ section,
monoterpenes such as linalool, geraniol, myrcene and d-limonene were found at relatively low levels in younger hops such as ‘b’ and ‘d’, with the exception of ‘d’ in 2011 (see Fig. III-7). In contrast,
sesquiterpenes such as β-farnesene, α-humulene and β-caryophyllene were found at higher levels in
younger hops. The results show that beers brewed from younger hops such as ‘b’ and ‘d’ had a lower
monoterpene content, with the exception of linalool in 2011 ‘d’ (see Fig. III-8). In the case of
sample ‘d’ in 2011, concentrations of linalool, geraniol, myrcene and d-limonene in hops were
higher than those found in 2010 (see Fig. III-7), and the linalool content in the beer produced was
also relatively high (see Fig. III-8). These results indicate that concentrations of monoterpenes in
beer could be correlated with those found in hops. However, it was not clear whether sesquiterpene
concentrations showed a similar correlation. It was assumed that most sesquiterpenes were difficult
to be brought into wort and were easy to be oxidized and hydrolized to other compounds. Therefore,
considering the behavior and changes of terpene compounds of hop during brewing process, it is
very important to precisely define any differences in hop quality caused by various cultivation
40
Fig. III-7 Terpene profiles in hop samples. The charts show the relative content of each terpene,
compared to the maximum content found in each of the 4 different root ages.
Fig. III-8 Terpene profiles in beer samples. The charts show the relative content of each terpene
compared to the maximum content found in each of the 4 different root ages.
41
A comparison between the sensory evaluation and chemical analyses carried out on the
2010 crop is shown in Fig. III-9 and Fig. III-10. Fig. III-9 shows the results of the sensory
evaluation for hoppy aromas in beer in 2010 (reproduced from Fig. III-5). Fig. III-10 shows the
results for the hoppy aroma compounds that contribute to floral, fruity, citrusy, herbal and sylvan
aromas, respectively. Table III-4 shows the aroma compounds that may affect hoppy aromas (such
as floral, fruity, citrusy, herbal and sylvan). The relationships between hop aroma characteristics and
compounds in beer derived from hops were compared with the results from our past study using
GCXGC-TOF/MS (ASBC congress in 2011). The values shown in Fig. 10 are relative values, with
the maximum value from the 8 samples (‘b’, ‘d’, ‘g’ and ‘h’ from 2 separate years) set at 1.0. As
shown in Fig. 9 and Fig. 10, there is a positive correlation between the sensory results and the
analytical results. The levels of compounds contributing to floral, fruity and citrusy aromas were
lower in younger hops such as ‘b’ and ‘d’ and the data showed a good match with the sensory results
obtained separately, whereas beer brewed with hop ‘g’ (15 years old) had more of these aroma
compounds. In the case of herbal aromas, there was no significant difference between the various
b d g h b d g h Linalool 8.27 7.40 24.80 18.66 9.62 27.20 31.08 30.96 Geraniol 3.96 3.59 9.91 6.04 3.15 5.34 9.18 8.58 Geranyl acetate 0.40 0.36 1.24 0.65 0.18 0.25 0.63 0.58 Myrcene 4.42 3.36 7.03 5.91 5.50 7.35 9.33 10.35 D-Limonene 1.50 1.32 2.37 2.03 1.91 2.00 2.75 3.66 β -Citronellol 6.47 6.54 15.27 10.70 6.51 11.11 21.66 18.21 α -Terpineol 2.63 2.58 4.29 4.23 2.96 4.80 4.92 5.74 Nerol 1.77 1.61 2.49 2.43 1.27 1.99 2.70 2.45 Ethyl 2-methyl butanoate 0.24 0.27 0.28 0.24 0.36 0.32 0.39 0.42 Iso Varelic ethyl ester 0.45 0.44 0.42 0.35 0.58 0.54 1.25 0.56 β -Caryophllene 0.49 0.52 0.60 0.83 0.29 0.17 0.23 0.19 Caryophyllen oxide 1.68 1.48 1.34 2.39 0.13 0.16 0.09 0.13 β -Farnesene 13.46 11.21 12.10 12.90 8.15 6.27 7.21 6.26 α -Humullene 2.38 5.19 2.14 2.54 1.28 1.03 1.36 1.27 β -Ionone 0.26 0.24 0.13 0.19 0.15 0.11 0.09 0.13 Neroridol 0.69 0.65 0.43 0.75 0.27 0.36 0.22 0.37 2011 2010
42
trials in terms of either sensory or analytical results. However, fewer compounds contributing to
sylvan aromas were found in beer ‘g’ (15 years old). The sensory evaluation produced the same
result. Overall, beers brewed from younger hops such as ‘b’ and ‘d’ had lower levels of compounds
that could contribute to floral, fruity and citrusy aromas. The same trends were found in the results
of the 2011 crop trials (data not shown). These findings confirm that sensory results correspond well
with the results obtained from chemical analyses.
Fig. III-9 Sensory results for hop aroma characteristics in beer samples from 2010 (as shown in Fig.
43
Fig. III-10 Comparison of total relative contents of the hop aroma compounds that are related to
floral, fruity, citrusy, herbal and sylvan aromas in beer (using hops from the 2010 crop). The values
on the bar graphs show the total relative amounts of hop aroma compounds compared to the
maximum amount of each compound found in the 8 hop samples (‘b’, ‘d’, ‘g’ and ‘h’ from 2 crops).
Table III-4. Hop aroma characteristics in beer and estimated chemical composition and odor
descriptions.
Relationships between cultivation, hops and beer quality
As shown in the previous chapter, younger hops (less than 5 years old) have less
monoterpenes that contribute to floral, fruity and citrusy aromas. Conversely, they have more
44
also contain less monoterpenes - confirming the correlation between aroma compounds in the hops
used and the beer produced from them. The chemical analysis results correspond well with the
sensory results, showing that beers brewed from young hops have less pronounced hoppy aromas
(such as floral, fruity and citrusy).
The levels of monoterpenes and sesquiterpenes present in the hops varied with hop plant
age. These results may have been caused by cultivation differences. In younger hops, vegetative
growth (both stem and leaf) was luxuriant and was associated with later flowering than hops grown
from older roots. This difference in vegetative growth and reproductive development may influence
lupulin gland formation and secondary metabolism. And if flowering is late, maturity must be also
late. This means that younger hops may sometimes be harvested before they are fully mature.
Overall, these studies confirm that ‘hop plant age’ is an important cultivation factor that
may have a significant effect on hop and beer quality. It is, therefore, important to control the various
cultivation factors involved in hop production in order to achieve the target beer quality.
Conclusions
The hop plants produced from young roots possess some unique characteristics. Vegetative
growth of both stems and leaves is luxuriant, flowering is later than usual, and less monoterpenes
(which contribute to floral, fruity and citrusy aromas) are produced. In contrast, more sesquiterpenes
are present - contributing to mild aromas (such as sylvan). Beers produced from hop plants growing
45 attributes.
Therefore, in order to achieve the target beer quality, it is important to consider the influence of
various factors related to cultivation - including the effects of hop hop plant age on hop aroma
47 CHAPTER IV
Influence of Apple Mosaic Virus on the Growth, Development, Yield, and Qualities of Saaz hop
Introduction
In this chapter, we investigated the natural origin factor, Apple Mosaic Virus (ApMV) on
the growth, development, yield, and qualities of Saaz hop. It has been reported that viral and viroidal
infections reduce the vegetative growth of hops (Pethybrdge et al., 2008; Fussy et al., 2012; Sano,
2012; Fussy et al., 2013). Pethybridge et al. (2008) summarized the effects of virus and viroids on
hops relative to quantity, quality and epidemiology. It has also been reported that the hop stunt viroid
detrimentally affects hop growth and quality, and so this viroid has become a significant problem in
hop-producing regions of the world (Sano, 2012; Fussy et al., 2013; Matousek et al., 2013). The
influences of the hop latent virus (HpLV), hop mosaic virus (HpMV), and apple mosaic virus
(ApMV) on hop varieties (Nugget, Opal, Pride of Ringwood, and Victoria) have been studied in
Australian hop producing areas. These viruses weaken hop growth and decrease the content of
humulone, a key component for beer bitterness (Pethybridge and Wilson et al., 2002). The incidence
and spatial distribution of viruses have been studied in hop-producing areas in both the United States
48
by agricultural machinery) (Pethybridge and Hay et al., 2002; Pethybridge and Madden et al., 2002;
Pethybridge and Nelson et al., 2002).
The Czech hop variety, Saaz, is known as a fine-aroma hop owing to its high qualities of
bitterness and aroma. A comparison of the chemical profiles between virus-free and infected Saaz
hop showed that infection may decrease the amounts of humulone and essential oils produced by the
plant (Jelinek et al., 2012), but the specific effects of ApMV and HpMV are not yet known. Both
viruses are among the most consequential for reducing yield and quality for many varieties of
industrial hops (Pethybridge et al., 2008). However, the influence of ApMV and HpMV viruses on
plant growth and beer quality have not been investigated for Saaz hops in Europe. Therefore, in this
study we investigated infections by ApMV and HpMV in Saaz hop and the influence of ApMV on
vegetative growth, yield, chemical profile, and beer aromatic qualities. We also observed the spatial
pattern of ApMV and HpMV occurrence in Saaz hop plants in 17 commercial gardens in the Saaz
region of the Czech Republic.
Materials and methods
Virus test garden
Two block areas in a test garden in Deštnice village, Saaz, Czech Republic (managed by V.
F. Humulus Ltd., Žatec, Czech Republic) were used for this study. Each block contained 40 Saaz hop
49
nematodes, such as Xiphimena and Longidorus, were found in the experimental blocks. Virus-free
shoots produced by V. F. Humulus Ltd. in accordance with the standards of European and
Mediterranean Plant Protection Organization (Certification Schemes, Pathogen Tested material hop,
PM 4/16(1)), were planted in one experimental block. ApMV-infected shoots, derived from ApMV
infection roots also produced by V. F. Humullus Ltd., were planted in the other experimental block.
The two blocks were separated by six meters to prevent the infected plants from infecting the
virus-free plants.
All hop plants were subjected to virus and viroid tests in spring 2, 000, described later in
the paper. ApMV, HpMV, Arabis mosaic virus (ArMV), cherry leafroll virus (CLRV), hop latent
virus (HLV), cucumber mosaic virus (CMV), petunia asteroid mosaic virus (PAMV), tobacco
necrosis virus (TNV), and hop latent viroid (HLVd) were not detected in the virus-free plants.
ApMV was maintained in all the infected plants, 70 % of which was also infected by HpMV.
However, the plants were not infected with ArMV, CLRV, HLV, CMV, PAMV, TNV, or HLVd. The
plants in both blocks were prevented from becoming infected by additional viruses by applying
mechanical procedures, such as pruning and harvesting. After the year 2000, 10 randomly-sampled
plants in each block were subjected to the virus test to confirm that no additional infections had
occurred in the blocks. Random sampling, and virus and viroid infection checks described above
were undertaken every year to ensure that the initial experimental conditions were preserved
throughout the study.
50
spatial distribution patterns of virus infection. Young shoots were collected in 2010 from the 10
plants (Fig. IV-1) from each production garden for virus assay.
Fig. IV-1. Spatial layout of hop gardens. ApMV and HpMV infection distributions were investigated
at 17 commercial hop gardens. Numbers indicate the root position of sampled hop plants. Black dots
show poles of hop trellises. Solid and dotted lines represent rows of hop plants.
Commercial gardens
We randomly selected 15 commercial gardens planted with Saaz hop plants (Osvald’s
clone 72 variety) in the Saaz region to compare the general hop quality with virus infection. We also
51 profiles.
Climatic data
Temperature and precipitation data were obtained from weather observation systems
managed by the Hop Research Institute Co., Ltd., located 10 km south of the test garden, at
Kneževes village.
Assays for viruses
Young shoots were collected in early April and homogenized in a 1.0-ml solution of 0.01
M phosphate-buffered saline (PBS) containing polyvinylpyrrolidone (20 g/L). The extracts (100 µl)
were tested in duplicate by double-antibody sandwich enzyme-linked immunosorbent assay
(DAS-ELISA), using polyclonal antisera to ApMV, HpMV, ArMV, CLRV, HLV, CMV, PAMV, TNV,
and HLVd (Loewe Ltd., Sauerlch, Germany). Light absorbance at 405 nm was measured for each
sample, and compared with the measurements for positive, negative, and buffer-only controls. The
positive/negative threshold was set at twice the absorbance of the control wells. This threshold value
was consistently higher than the value obtained using the average absorbance of control wells (plus
three standard deviations) and so produced a more conservative estimate of virus incidence.
Measurement of hop growth and development
52
growth characteristics were measured every 2 weeks from April to August. Measurements included
hop height, bine (main stem of hop plant) diameter, and leaf length (at 1.5 m above ground).
Transition from the vegetative to the reproductive phase at a height of 5.0 m from the ground was
observed every week from the end of June to the middle of August.
Yield calculation in virus test garden
Raw hop cones from all plants were collected by a pilot-scale picking machine and their
weights and moisture contents were determined. Shortly after harvest, the picked hop cones were
dried in a kiln at 55°C for approximately 8 h until their moisture content fell to 10% of wet weight.
The weight of dried hop cones was measured to calculate an accurate yield.
Storage conditions for hop samples
Dried hop cones were packed in shaded plastic bags with gaseous nitrogen and stored at
-20°C in a dark place prior to being used in chemical analyses and brewing trials.
Chemical analyses of hop samples
Chemical analyses of hop samples were conducted at the Hop Research Institute Co., Ltd.
(Žatec, Czech Republic). Hop humulone content was measured by the EBC 7.7 liquid
chromatography (HPLC) method with a Nucleosil RP C18 column (Macherey-Nagel GmbH & Co.
53
corporation, Kyoto, Japan) with a diode array detector (DAD).
The essential oils of hops were extracted by steam distillation, and the composition of
terpene content of the distilled oil was determined by gas chromatography (GC) using a Finnigan
ITD 800 mass detector (Matsui et al., 2016). The detected compounds were identified from the
comparison of GC retention indices and mass spectra with those of pure compounds. A
semi-quantitative evaluation of the composition of hop oils was performed on the basis of the peak
area of individual components and expressed in relation to the total integrated area of all
components.
Brewing
Small-scale brewing mimicking commercial beer production was conducted in a 100-L
pilot scale brewery (Suntory Beer Ltd., Tokyo, Japan) with a malt ratio of 100%. Hops were added
twice: at the beginning (kettle hopping) and at the end (late hopping) of wort boiling. To compare
differences in the characteristics of hop aromas, an identical amount of each hop test sample
harvested in 2011 (milled hop) was added only at the late hopping stage. The amount of the hop
extract typically used in the commercial brewing process was added at the time of kettle hopping to
achieve an identical bitterness among beer samples. Worts were fermented at 10°C, using lager
yeasts.
54
Seven well-trained panelists conducted sensory evaluations, based on hop aroma intensity,
of the beers brewed using infected and uninfected hops. The hop aroma in each beer was compared
to that of hop oil produced by Botanix Ltd (UK). Five generic descriptions of hop aroma were used
as characteristics: floral, fruity, citrusy, herbal, and sylvan (woody). Panelists scored each aroma
characteristic on a scale from 0 to 5. All scores were then normalized to remove biases of panelists.
An evaluation of each sample was carried out at least twice on different dates. The order in which
beers were sampled was randomized for each panelist, and all evaluations were conducted with
panelists blind to the status of the hops (infected vs. uninfected) they were testing.
Statistical analysis
Statistical tests were performed using the JMP 10.01 software (SAS, Cary, NC, United
States). Statistical differences between means were determined by two-way ANOVAs (analysis of
variance), by examining significances at p < 0.05, 0.01, and 0.001.
Results
Incidence of infection in the virus test garden
The presence of viruses and viroid were examined in the test garden in Deštnice. Ten hop
plants were randomly selected from each test block. ApMV infection rates accounted for 0% and
55
comparatively low, at 0% and 10%, in uninfected and infected blocks, respectively. Other viruses,
ArMV, CLRV, HLV, CMV, PAMV, TNV, and HLVd were not detected both in uninfected and
infected blocks.
Growth and development of hop plants
Heights of ApMV-infected plants were 10 to 15% shorter than those of uninfected plants
(Fig. IV-2a). Significant differences were first observed between the two groups by the middle of
June in 2010 and by the end of May in 2011. Bine diameter at 1.5 m height of ApMV-infected plants
was not significantly different in 2010 (Fig. IV-2b1). However, in 2011, a significant reduction
(20%) in infected plants was observed throughout the cultivation period (Fig. IV-2b2). Length of
leaves at 1.5 m height from the ground was 10% less in ApMV-infected plants than in uninfected
plants in both 2010 and 2011 (Fig. IV-2c), with significant differences appearing earlier in 2011 than
2010. Changes in leaf appearance, such as chlorotic rings and necrotic spots, caused by ApMV were
not observed in these tests (data not shown). The time between when plants sprouted in spring to the
appearance of cones on 50% of plants did not differ between ApMV-infected and uninfected plants
56
Fig. IV-2 Behaviors of vegetative growth (height, bine diameter and leaf length) and cone formation
during cultivation seasons in 2010 and 2011. VF and VI indicate virus-free (uninfected) and
57
standard deviation. Asterisk (*) indicates significant difference (* = p < 0.05; ** = p < 0.01).
Yield, humulone content, and essential oil content
Yield of the ApMV-infected plants (0.6 ton/ha in 2010, 0.9 ton/ha in 2011) was lower than
that of uninfected plants (1.9 ton/ha in 2010, 2.0 ton/ha in 2011). ApMV-infected yield was also
below average in comparison to 15 commercial hop gardens in both 2010 and 2011 (Fig. IV-3a).
Humulone production in ApMV-infected plants (3.25% in 2010, 4.18% in 2011) was also lower than
that in uninfected plants (4.95% in 2010, 4.99% in 2011), but was comparable to the average of 15
productive hop gardens (Fig. IV-3b). The total amounts of essential oil produced tended to be
58
Fig. IV-3 Yield, humulone, and essential oil levels in dried hop cones after harvest. VF and VI
indicate virus-free (uninfected) and ApMV-infected hop, respectively. Ave. indicates the mean as
obtained from 15 commercial hop gardens in each year. Error bars show 1 standard deviation.
Composition of terpenes
ApMV-infected hop cones had a higher proportion of sesqui-terpenes (farnesene,
bergamotene, and caryophyllene) and a lower proportion of mono-terpenes (myrcene and β-pinene)
than cones obtained from uninfected plants. This pattern was also true relative to average terpene
59
Table IV-1 Composition of aroma compounds in essential oil. Relative percentage was calculated by
comparing peak area of each individual compound to the total peak area of all compounds. Mean
and standard deviation were calculated using data collected from 15 commercial hop gardens.
Hoppy aroma in beer
Beer brewed utilizing the hops derived from the ApMV-infected plants had a significantly
weaker fruity aroma than beers brewed from the uninfected plants (Fig. IV-4).
Fig. IV-4 Scores for beer aroma. VF and VI shows virus free and ApMV infected hops, respectively.
(** = p < 0.01).
Spatial distribution of viruses in productive hop gardens
linalool geraniol myrcene ocimene β- pinene limonene farnesene bergamo tene humulene caryo phyllene
2010 VF (rel %) 0.56 0.21 39.5 0.070 0.73 0.16 21.3 0.90 16.6 5.81 VI (rel %) 0.63 0.13 30.1 0.070 0.58 0.22 26.8 1.28 16.9 7.31 Mean (rel %) 0.62 0.28 34.3 0.099 0.57 0.15 23.9 0.89 16.0 6.63 STDEV 0.06 0.07 3.6 0.035 0.07 0.03 1.8 0.13 1.3 0.60 2011 VF (rel %) 0.45 0.05 31.2 0.100 0.48 0.14 20.7 0.89 23.8 6.87 VI (rel %) 0.45 0.09 22.9 0.080 0.39 0.11 21.7 1.03 27.9 8.12 Mean (rel %) 0.53 0.14 34.7 0.106 0.55 0.15 18.4 0.85 23.4 6.49 STDEV 0.11 0.04 5.9 0.027 0.09 0.02 2.3 0.09 3.6 0.93 Mono-terpene Sesqui-terpene
60
Four adjacent plants were found to be infected by ApMV in one commercial hop garden
(Table IV-2, garden M), but adjacent infections were not observed in other gardens. Average
61
Table IV-2 Spatial distribution of ApMV and HpMV infection in 17 commercial hop gardens. Plant number corresponds to the number in Figure 1. Character ‘P’ indicates positive infection of ApMV
or HpMV. A B C D E F G H I J K L M N O P Q 1 2 3 4 5 10 10 10 10 10 10 10 10 10 10 15 20 row A 1 - - P - - - P -2 - - - -3 - - - P - - - P - - - -row B 4 - - - P P - - - -5 - - - P - - - -6 - - - -row C 7 - - - P - - - -8 - - - P - - - -9 - - - P - - P - - - -10 - - - P - - - -A B C D E F G H I J K L M N O P Q 1 2 3 4 5 10 10 10 10 10 10 10 10 10 10 15 20 row A 1 - - - P - - - P -2 - - - P P - - - -3 - - P - - - -row B 4 - - - -5 - - - -6 - - - P - - - -row C 7 - - - P - - - -8 - - - P - - - -9 - - P - - - -10 - - - -row plant No
Hop garden (number indicates plant age) (b) HpMV
(a) ApMV
Hop garden (number indicates plant age) row plant No
62
Fig. IV-5 Infection rate of ApMV and HpMV at each grower in 2010. Number in brackets shows
how many hop gardens were used to calculate infection rates. Error bars show 1 standard deviation.
Discussion
ApMV affected vegetative growth characteristics, such as height, bine diameter, leaf
length, and the time of blooming (Fig. IV-2). The difference in the timing of 50% cone formation
between ApMV-infected hop plants and uninfected hop plants was within 10 days (Fig. IV-2d) of
one another. In previous studies, longer maturation periods resulted in an increase in essential oil and
monoterpene contents in plants, but did not change the amount of sesquitepenes and humulone
(Matsui et al., 2016). However, in this study, the amounts of humulone in virus-infected hops were
less than those in virus-free hops for both years of study (2010 and 2011) (Fig. IV-3). And
63
mono-terpenes than cones obtained from uninfected plants (Table IV-1). We surmise that ApMV
affects the biosynthetic pathway of secondary metabolites. This subsequently affects beer aroma
quality (Fig. IV-4), with a decrease in essential oil content and an alteration in the terpene profile
(myrcene, β-pinene, farnesene, bergamotene, and caryophyllene). Generally, sesqui-terpenes (such as
farnesene, bergamotene, and caryophyllene) confer a ‘mild’ hoppy aroma to beer, while
mono-terpenes (such as linalool geraniol and myrcene) confer a ‘floral’ hoppy aroma (Inui et al.,
2013). The lower content of essential oils and the higher ratio of sesqui-terpenes of ApMV-infected
hops resulted in weaker fruity aroma in beer. Therefore, ApMV infections are detrimental to the
floral quality of the beer made from Saaz hop.
ApMV infection also lowered hop yield (Fig. IV-3a). This result may be partly due to the shorter,
and thus smaller leaves (with same number of leaves) in main stems following infection (Fig. IV-2c).
Although chlorotic rings and necrotic spots in ApMV-infected plants were observed by previous
authors (Pethybridge et al., 2008), such symptoms were not observed in our study. The symptoms
caused by ApMV may differ according to hop variety.
The difference in growth and development between ApMV-infected and uninfected plants
in 2011 was larger than the growth and development difference in 2010, especially bine diameter and
cone formation (Fig.IV- 2). It should be noted that differences in growth and development characters
became evident earlier in 2011 than 2010 may have been due to differences in climatic conditions
between years. Temperature in May 2011 was warmer than that in 2010 (Fig. IV-6). It may be that