Analysis on long‑term bed adjustment to human impacts and bore inundation in a lower river
著者 ダン ミン ハイ
著者別表示 Dang Minh Hai journal or
publication title
博士論文本文Full 学位授与番号 13301甲第3960号
学位名 博士(工学)
学位授与年月日 2013‑09‑26
URL http://hdl.handle.net/2297/39363
Creative Commons : 表示 ‑ 非営利 ‑ 改変禁止 http://creativecommons.org/licenses/by‑nc‑nd/3.0/deed.ja
i Abstract
In the first part, an attempt was conducted to clarify the effects of sediment extraction and dam construction on the change in the riverbed characteristics over yearly to decadal scales in the lower Tedori River, Japan. This goal was pursued by first comparatively analyzing the survey data on the bathymetry and human activities over a 58-year span. Empirical orthogonal function (EOF) analysis was then carried out to derive the principal variation trends in the dataset.
The results indicate that the riverbed degraded in excess of 0.5–3.5 m in the entire study area over the period 1950–1991. The riverbed sediment volume of the reach 0–
16 km decreased by 12.7 106 m3. The considerable reduction in sediment budget along the lower Tedori river was observed. The intensive sediment extraction was the dominant cause of degradation of the riverbed in this period. As another effect of sand and gravel mining, in the period of 1975 to 1990, the sediment mean diameter in the main course was smaller than that in the lateral lane. The temporal adjustment of the riverbed elevation at each cross section indicates that the riverbed experienced five phases of adjustment: I-A, I-B, I-C, II and III, four of which were well described by an empirical model.
In the period 1991–2007, the increase in the riverbed sediment volume of 0.6 106 m3 resulted in accretion of the riverbed at an average depth of 0.04 m. Concur- rently, sediment budget slightly recovered partially along the lower Tedori river. The riverbed variation in this period corresponds to the phase III of the adjustment. It is deemed that operation of the Tedorigawa Dam resulted in the deposition of sediment in the lower sub reaches.
An overall decrease in bankfull channel width of the lower Tedori river was ob- served through the period of 1950-2007. The variation in the channel width followed the variation in the riverbed elevation: namely, channel narrowing and the river bed degradation; channel widening and the river bed aggradation.
Over the period 1950–1979, the main trends of the change in the riverbed and its controlling factors were clearly captured by the first four modes of EOF analysis. That is, the first mode explained the mean profile of the riverbed and temporal variation in the riverbed sediment volume. The second to fourth spatial eigenfunctions reflected the spatial variation in the rate of vertical adjustment for the phases I-B, I-C and I-A, respectively. The corresponding temporal eigenfunctions explained the respective
ii
effects of sand and gravel mining, of imbalance between sediment transport capacity and sediment supply, and of dredging activity on the riverbed. In addition, a collation of river and coastal EOF results indicate that the time lag of the onset of accelerated erosion in the Mikawa coast was several years when compared with that in the downstream river.
In the second part, in order to reproduce the bore propagation over a channel with complex topography, a numerical model is developed to solve the Nonlinear Shallow Water Equations on the basis of TVD-MacCormack scheme. The model incorporates the surface gradient method , a simple wetting and drying method and an improved surface gradient method. The applicability of the numerical model is tested through comparison with existing theoretical and experimental studies. The verification of the model against with analytical solution include tide wave over steps, preservation of still water surface, dam-break, run-up and back-wash on a sloping bathymetry.
Excellent agreement between analytical and numerical results was achieved. Subse- quently, the validation of the model with the experimental data consist of bore propagation over a triangular bottom sill, dam-break wave propagation over a com- plex topography, 3D schematic dam break. In general, numerical results agree well with the experimental ones. Finally, bore propagation and run up over a river bank was modeled.
i Acknowledgments
From my innermost feelings, I would like to gratefully acknowledge the enthusiastic supervisor of Prof. Masatoshi YUHI. His forethoughtful guidance, continuous en- couragement and supports in a wide aspect made my experience at Kanazawa University extremely meaningful, both academically and personally. I would also like deeply thank to Assoc. Prof. Shynia UMEDA. His enthusiasm, inspiration and patience were strongly impressed on my memory. Whatever I learned from the two supervisors will be invaluable treasure throughout my life.
My earnest and sincerest gratitude is also addressed to committee members of my dissertation Prof. Takehisa SAITOH, Prof. Fumihiko YAMADA and Assoc. Prof.
Kenji TANIGUCHI for their valuable comments and precious time for the successful completion of this study.
My appreciations are also addressed to Mr Ryousuke MATSUDA, Mr. Masatsumi AMAKATA and Mr. Hideaki. IWATAfor the technical assistance during the initial phase of my research.
The members of Coastal and River Engineering Laboratory have been contributed immensely to my memorable time in Kanazawa. Many thanks to all Japanese lab mate for their warm friendship as well as good advices and collaboration. Especially thanks to my tutor, Mr. Kosuke WAKITA for great support at the beginning of my stay.
I offer my deepest respect and gratitude to my dear parents, younger brother, beloved wife and daughter for their patience, unconditional love and support without com- plaining.
Last but not least, the scholarship provided by the 322 project (Ministry of Education and Training, Viet Nam) is sincerely acknowledged.
ii
Contents
Part I. Introduction ... 1
1. General background ... 2
2. Needs for research... 3
3. Objective and scope of study ... 6
Part II. Long-term responses of the riverbed in the lower Tedori River, Japan to sediment extraction and dam construction ... 7
1. Introduction ... 8
2. Literature review ... 9
2.1. Effect of material extraction and dam constructions on river morphology ... 9
2.2. Rate of vertical adjustment in riverbed ... 12
2.3. EOF analysis ... 14
3. Regional setting and datasets ... 15
3.1. Characteristics of the Tedori River Basin ... 15
3.2. Datasets ... 17
4. Methods of analysis ... 18
4.1. Mean bed level at cross-sections ... 18
4.2. Vertical adjustment ... 18
4.3. Horizontal variation ... 20
4.4. Sediment volume of river bed ... 21
4.5. Sediment budget... 21
4.6. Sand and gravel transport rate... 21
4.7. EOF analysis ... 22
5. Results and Discussion ... 24
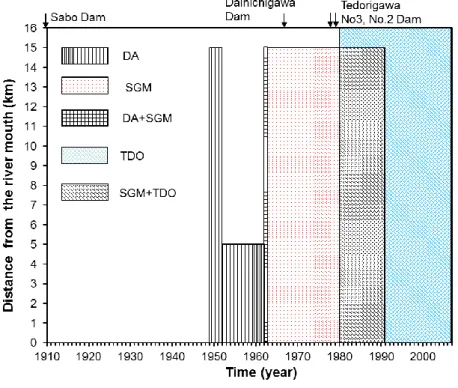
5.1. Anthropogenic activities in the Tedori River Basin ... 24
5.1.1. Sand and Gravel Mining ... 24
5.1.2. Dam construction ... 25
5.1.3. Representative floods ... 27
5.2. General features of riverbed response ... 28
iii
5.2.1. Riverbed response dominated by natural factors before 1950 ... 28
5.2.2. Riverbed response dominated by human interventions after 1950 ... 29
5.2.3. Horizontal variation ... 34
5.2.4. Variation in sediment characteristics ... 39
5.3. Effects of human activities on sediment budget ... 42
5.3.1. Estimation of sand and gravel supply rate ... 42
5.3.2. Variation in riverbed sediment volume ... 43
5.3.3. Direct effects of SGM until 1979 ... 45
5.3.4. Indirect effects of SGM and influence of natural factors until 1979 ... 46
5.3.5. Combined effects of SGM and TDO during 1980-1991 ... 47
5.3.6. Direct and indirect effects of TDO after 1991 ... 47
5.3.7. Variation in sediment budget along the lower Tedori River ... 48
5.3.8. Discussion on limitation of present analysis ... 51
5.4. EOF analysis ... 52
5.4.1. EOF analysis of riverbed elevation changes ... 52
5.4.2. Comparison of accelerated erosion in riverbed and downstream coast by EOF ... 58
6. Conclusion ... 61
Part III. Numerical study on bore propagation over a channel with complex topography ... 63
1. Introduction ... 64
2. Literature review ... 65
3. Governing equations ... 67
4. Numerical scheme ... 68
4.1. TVD-MacCormack scheme ... 68
4.2. Well-balanced property and treatment of dry front ... 70
5. Model validation ... 71
5.1. Tidal wave over steps... 71
5.2. Preservation of still water surface ... 73
5.3. Dam-Break on wet bottom ... 74
iv
5.4. Dam-Break on dry bottom ... 75
5.5. Long wave oscillation in a canal with a parabolic cross-section ... 76
5.6. Dam -break wave over a triangular bottom sill ... 79
5.7. Dam-break wave propagation over a complex topography ... 83
5.8. Three dimensional schematic dam break ... 86
6. Wave run up over a bank ... 88
7. Conclusions ... 90
Part IV. Conclusion ... 92
1. Summary ... 93
2. Conclusion ... 94
3. Recommendation ... 97
References ... 98
v
List of Figures
Figure 2.1. Alluvial deposits exploited for aggregate depicted in relation to river channel morphology and alluvial water table (Kondolf, 1994). ... 12 Figure 3.1.Tedori River Basin ... 15 Figure 3.2. Temporal variation in daily averaged discharge in the lower Tedori River ... 16 Figure 4.1. Fitting exponential equations to temporal vertical adjustment at the 17 th and 69 th cross –section ... 19 Figure 5.1. Temporal and spatial ranges of anthropogenic effects on the Tedori River (DA: Dredging activities; SGM: Sand and gravel mining; TDO: Tedorigawa Dam operation). ... 24 Figure 5.2. Volume of sand and gravel mining extracted from the Tedori River according to the license issued by the local government. It is considered that the values shown in this figure could significantly underestimate the real volumes. ... 25 Figure 5.3. Flood-frequency curves derived from annual maximum flows at Tsurugi station for pre-and post-1980 periods. ... 26 Figure 5.4. Temporal variation in flood discharge at the Tsurugi gauging station before and after Tedorigawa dam construction. ... 27 Figure 5.5. Temporal and spatial variations of the riverbed elevation of the Tedori River ... 29 Figure 5.6. Temporal and spatial variations in the rate of vertical adjustment. ... 33 Figure 5.7. Spatial and temporal variations in slope ... 34 Figure 5.8. Superimposed cross-sectional profiles of the Tedori River at four sites for the years 1950, 1979, and 2007. ... 36 Figure 5.9. Variation in riverbed level (1950–1979) ... 36 Figure 5.10. Comparison of aerial photographs of the 2-4 km sub reach over three different dates (RK, river kilometer, represents the distance from the Tedori river mouth). ... 37 Figure 5.11. Temporal trends of average channel width and riverbed elevation in four sub reaches and entire reach. ... 38
vi
Figure 5.12. Temporal and spatial variations in the sediment mean diameter in the main course (a) and on the lateral area (b) (zero values or blank areas indicate missing
data)... 40
Figure 5.13. Temporal variation in the slope and flood discharge product (Q.S) and dm of the lower Tedori River. ... 41
Figure 5.14. Estimation of the sediment yields in the Ushikubi river, Ozo river and upstream ... 42
Figure 5.15. Temporal variations in cumulative sediment volume in the Tedori River Basin. ... 44
Figure 5.16. Decadal variations in components of sediment budget. ... 45
Figure 5.17. Temporal and spatial variation in the riverbed sediment volume. ... 48
Figure 5.18. Temporal and spatial variations in the sediment volume mined from the downstream Tedori River. ... 49
Figure 5.19. Temporal and spatial variation in bed material transport rate in the downstream Tedori River. ... 50
Figure 5.20. Temporal and spatial eigenfunctions for the first four modes ... 54
Figure 5.21. The observed and reproduced vertical adjustments over different periods ... 56
Figure 5.22. Temporal and spatial eigenfunctions for the first mode (1991–2007) .... 57
Figure 5.23. Temporal and spatial eigenfunctions for the second mode (1991–2007) 58 Figure 5.24. The temporal and spatial eigenfunctions for the 1st and 2nd modes of the river bed variation in sub reach 1 (0-2km) ... 58
Figure 5.25. The temporal and spatial eigenfunctions for the 1st and 2nd modes of the river bed variation in sub reach 2 (2-7km) ... 59
Figure 5.26. The topography of Ishikawa Coast ... 59
Figure 5.27. The 1st mode of the Ishikawa Coast (Yuhi et al., 2013). ... 60
Figure 3.1.Definition Sketch ... 68
Figure 5.1. Tidal wave over steps: free surface (a) and velocity profiles (b) at t=10800s ... 72
Figure 5.2. Tidal wave over steps: free surface and velocity profiles at t=32400s... 73
Figure 5.3. Still water test: undisturbed still water surface after t=200s ... 74
Figure 5.4. Comparison between the analytical solutions and the numerical results for a dam-break problem on wet bottom ... 75
vii
Figure 5.5. Comparison between the analytical solutions and the numerical results for a dam-break problem on dry bottom ... 77 Figure 5.6. Comparison between the analytical solutions and the numerical results for water oscillation ... 78 Figure 5.7. Sketch of dam break over a triangular bottom ... 79 Figure 5.8. Longitudinal profile of water surface at different time ... 80 Figure 5.9. Comparison of experimental and numerical water surface at three gauges ... 81 Figure 5.10. Sketch of dam break over a complex topography ... 84 Figure 5.11. Comparision of experimental and numerical water surface at four gauges.
... 85 Figure 5.12. Relation between arriving time and the initial water height of the reservoir ... 85 Figure 5.13. Relation between the height of the fence and the maximum inundation height of the downstream area. ... 86 Figure 5.14. Sketch of 3D dam-breaking flow ... 87 Figure 5.15. Comparison of experimental and numerical water surface at four gauges ... 88 Figure 6.1.Temporal and spatial evolution of water surface ... 89 Figure 6.2.Close-up view of wave running up over the channel banks for the case R=300m ... 90
viii
List of Tables
Table 3.1.Characteristics of the four distinct reaches in the lower Tedori River (Teramoto et al, 2003)... 16 Table 5.1. Flow characteristics of the Tedori River before and after Tedorigawa Dam construction (RI is recurrence interval) ... 26 Table 5.2. Temporal variation in reach-averaged vertical adjustment ... 32 Table 5.3. Mean value of the rate of vertical adjustment in different phases ... 32 Table 5.4. Root-mean-square of the difference between the observed and reproduced vertical adjustments of the river bed ... 57
1
Part I. Introduction
2
1.General background
River plays a crucially important role in human life. Most of us live near rivers and rely on them for water supply, food, power, transport, recreation, waste disposal, and as a source of raw materials (Bridge, 2003). In order to maximize economic and environmental values of rivers, it is required to sustain health of river in dynamic equilibrium state. Prior to anthropogenic intervention, river systems are usually in a quasi-steady state wherein erosion, transport, and deposition are adjusted to the prevailing conditions of climate and geology (T.Hack, 1960). In recent decades, human activities and extreme events have strongly affected morphological evolution of rivers. It is realized that disturbances induced by climate change may progress exceedingly slowly and be practically imperceptible by human standards (Simon, 1989). In contrast, human-induced disturbances often accelerate or alter natural processes and trends rapidly, resulting in a compressed time scale for river adjust- ments (Rinaldi and Simon, 1998). Lower rivers which is located downstream of the rivers and adjacent to coasts are prone to be influenced by both disturbances occurring in river basins and disasters originating from seas.
Morphological change in lower rivers due to human impacts generally occurs as a result of change in flow, sediment regime and/or boundary condition. Typically, natural transporting processes of flow and sediment from mountains to coasts are disrupted by anthropogenic impacts such as material extraction and dam construc- tions. Consequently, these interventions could adversely affect the morphology of the lower river such as: riverbed mobilization, scouring, erosion, and deposition, etc.
After the World War II, many countries in the world have experienced a rapidly economic growth period, which is accompanied with a high need for concrete aggre- gate and energy. Regarding the aggregate demand, sand and gravel has been prevailingly utilized because of its advantages: durable, well-sorted, rounded and cheap. In many areas, aggregate is derived primarily from alluvial deposits, notably from active river changes, their flood plains, and older terrace deposits (Sandecki, 1989). It is realized that sediment mining produces a large variety of physical, ecological, and environmental effects. In term of morphological effects, sediment mining could induce upstream incision, downstream incision, lateral channel instabil- ity, bed armouring, impacts on infrastructures and sediment deficit in coastal zone (Rinaldi et al., 2005). In addition, for various purposes, many dams have been con-
3
structed in many rivers. Most regions of the world experienced an extreme accelera- tion of dam-building activity from 1950 and the rate of dam building appears to have peaked in 1968 (Beaumont, 1978). In almost all cases, dams interrupt and modify the downstream flux of sediment through watersheds; they typically also affect the flow regime (Grant, 2012). It is known that flows and sediment are two key factors which decide river form. Thus, dam constructions have the potential to alter the entire hierarchy of channel variables (Schumm and Lichty, 1965). It is therefore especially important for rational river management to more insightfully understand how human activities such as sand and gravel mining and dam construction affect morphology of lower rivers.
Besides, lower rivers may be vulnerable to bore inundation which is originated from dam-break flow in the upstream area or from tsunami intrusion following great earthquakes. For example, the tsunami induced by the 2011 Tohoku earthquake in Japan hit Sendai Plain. Subsequently, the tsunami runs up a number of rivers and overflowed into surrounding areas. Many structures were severely damaged, and huge numbers of human lives were lost in the flood. In order to mitigate such disasters, it is vital to better understand hydrodynamic responses of a bore during propagating into the lower river as well as its adjacent area.
2.Needs for research
Among various human activities, dredging activity (DA) and sand and gravel min- ing (SGM) most notably reduce the amount of sand-and-gravel-sized sediment and consequently alter the river morphology (Collins and Dunne, 1989; Kondolf, 1994;
Kondolf, 1997; Rinaldi and Simon, 1998). According to Simon (1989), the dredging and straightening of alluvial channels between 1959 and 1978 in West Tennessee in the United States degraded sites upstream of the area of maximum disturbance and lowered bed levels by as much as 6.1 m. The Gállego River in Spain was subjected to incision amounting to more than 5 m between the early 1970s and 2004, and the mining of gravel is the only plausible cause for this severe degradation (Martín-Vide et al., 2010). Along alluvial rivers of Tuscany, central Italy, there was significant acceleration of channel incision during the period 1945–1980, in concomitance with the maximum sediment mining activity at a regional scale (Rinaldi, 2003). Addition- ally, the river pattern evolved from being generally braided to a more singular thread
4
(Kondolf and Swanson, 1993; Martín-Vide et al., 2010; Rinaldi et al., 2005). These results were investigated over time spans of less than 40 years, and the possible indirect effects of sediment extraction on the river morphology are therefore not well understood. Hence, there is a need for more thorough research to examine the interac- tion of the disturbed rivers with sediment extraction.
Many rivers around the world have been affected by dam constructions superim- posing or succeeding the process of intensive sediment extraction. Dam constructions affect the morphology of rivers below by reducing the flood peak and blocking the upstream bed load supply. Incision below dams is most pronounced along rivers with fine-grained bed materials (Alekseevskiy et al., 2008; Isik et al., 2008b). By contrast, along several gravel-bed rivers, there is riverbed aggradation because the reduced flood peak is insufficiently powerful to pick up and transport tributary-supplied sediment (Church, 1995; Topping et al., 2000). The effects of in-stream gravel extraction are often exacerbated downstream of reservoirs (Kondolf and Swanson, 1993). However, the long-term response of the riverbed to damming subsequent to mining remains unresolved.
In Japan, the morphology of the pristine river is characterized due to the combina- tion of steep landforms and frequent storms, and its change is often accelerated by the effects of earthquakes and volcanic eruptions (Oguchi et al., 2001). Therefore, Japa- nese rivers differ from most continental rivers in the world because they are short (max. length: 367 km), steep (average slope: 0.44%), and exhibit very flashy flow regimes(Yoshimura et al., 2005). Since around 1960, when Japan entered a period of high economic growth, a substantial amount of sand and gravel has been extracted from rivers to be used as concrete aggregate. Additionally, many dams have been built to control floods, generate electricity, and secure water for various uses (Inoue, 2009). This has seriously affected the river morphology. Nevertheless, there has been little research on such problems owing to the inherent complexity of the problem and deficit data coverage, especially on decadal scales (Yuhi, 2008a). Sato et al. (2004) indicated the significant degradation of the longitudinal profile of the Samegawa River, Japan, in the region 1 km from the river mouth in 1977. This degradation was attributed to the dredging of a sand bar in the early 1970s although there is no official record of the amount of sand dredged. Through analysis of the sediment budget at the reach scale, Huang (2011) deduced that the riverbed sediment volume in the lower Tenryu River decreased as a result of sand and gravel extraction and dam construc-
5
tions, which were conducted intensively before 1968. A similar view for the Tedori River and neighboring coast was presented by Yuhi (2008a); (Yuhi et al., 2009).
However, these investigations mainly considered the variation in the riverbed sedi- ment volume rather than the morphologic features.
Recently, the Tedori River has been profoundly affected by continuous anthropo- genic activities such as dredging activities, sand and gravel mining and multi-purpose constructions. These activities have disturbed the preceding equilibrium condition of the Tedori River. In particular, significant amount of sediment was moved out due to mining and trapped in the Tedorigawa Dam. This has induced intensive change in the riverbed elevation and the corresponding sediment storage volume from 1950 and 2007. Therefore, research on response of the lower Tedori river to sediment extraction and dam constructions using datasets spanning over 50 years is the utmost important to contribute to implement rational management of the Tedori river as well as other rivers in Japan.
Bore propagation in rivers and inlands is mathematically described by the shallow water equation. The most challenging feature of the shallow water wave equations is that they admit discontinuities as well as smooth solutions. Even the case in which the initial data is smooth can lead to discontinuous solutions in finite time. Although much effort has been made to analytically solve the shallow water equation, yet theoretical solutions are still very limited in several simplified cases, which are insufficient to capture complicated hydrodynamics of real flows. Therefore, together with the development of high-performance computers, numerical methods have become a productive tool to reproduce the various flow phenomenon which include discontinuities in the solution. Many researches on improving the accuracy of the numerical schemes for solving the hyperbolic equation system have been conducted.
However, the treatment of source terms in that equation system and the modeling of the moving wet-dry interface at a shallow water wave front remain difficult (Liang et al., 2009; Wei et al., 2006). The problem becomes more difficult when simulating tsunami propagation over the complex topography in which artificial numerical wave is often created in free water surface. This imposes the need to further study the well- balanced numerical schemes which are more accurate and robust to model discontin- uous free-surface shallow flows like tsunami propagation over the complex boundary.
This work is considered as a preparation step to deal with the tsunami in the lower Tedori river as well as surrounding areas.
6
3. Objective and scope of study
The first main object of this study is to quantify the effect of sediment extraction and dam construction on riverbed characteristics over the period of 1950-2007 in the lower Tedori river, which is from the Tedori river mouth to 16km upstream from the river mouth. The specific objectives of the present investigation are (i) to analyze the variation in the riverbed of the lower Tedori River, focusing on establishing an empirical model of temporal variation in the riverbed elevation, (ii) to quantify the effect of sediment extraction and Tedorigawa dam construction on the riverbed, and (iii) to highlight the variation in the riverbed in relation to its controlling factors through empirical orthogonal function (EOF) analysis. These goals will be pursured by first comparatively analyzing the survey data on the bathymetry and human activities. EOF analysis is then employed to derive the main trends in the dataset.
The second object of this study is to develop a numerical model which is capable of solving the Nonlinear Shallow Water Equations based on the TVD-MacCormack scheme, which is 2nd order accurate in time and space. It aims to achieve well- balancing through modifying local bed elevation and using the surface gradient instead of the depth gradient for TVD corrections. The accuracy and robustness of the model will be tested against several analytical solutions and experimental data in order to confirm that the model is able to simulate the 1D, 2D discontinuous flow over the complex topography.
7
Part II. Long-term responses of the riverbed in the lower
Tedori River, Japan to sediment extraction and dam con-
struction
8
1.Introduction
In recent decades, morphological evolution of river have been strongly dominated by human activities through change in sediment transport and flow. Such activities often occur over a large temporal and spatial scale. Therefore, mechanisms of their effect on river channels are complicated to fully recognize. Existing knowledge on shedding light the problem has been obtained by a variety of researches (Rinaldi, 2003; Rovira et al., 2005; Yuhi, 2008b) in the last decade. Yet, in order to achieve better management in river systems, it is necessary to further investigate the variation in river channel in relation to anthropogenic activities in a long term at a large scale(Piégay and Hicks, 2005).
In rivers, morphologic characteristics and sediment transport have a mutual interaction. These features simultaneously respond to a deficit of bed sediment induced by human activities such as bed sediment extraction and dam constructions.
A temporal and spatial trend of variation in the river bed level is closely related to the imposed disturbance in a river as well as in its basin (Isik et al., 2008a; Rinaldi and Simon, 1998; Simon, 1989).
Recently, the Tedori River has been profoundly affected by continuous anthropo- genic activities such as dredging activities, sand and gravel mining and multi-purpose constructions. These activities have disturbed the preceding equilibrium condition of the Tedori River. In particular, significant amount of sediment was moved out due to mining and trapped in the Tedorigawa Dam. This has induced intensive change in the riverbed elevation as well as the corresponding riverbed sediment volume from 1950 to 2007(Dang et al., 2012).
In part I, we aim (a) to analyze the change in morphological characteristics of the lower Tedori river, (b) to analyze the temporal and spatial variation in sediment budget components and their mutual relation and (c) to use EOF analysis to capture the main variation trend in the lower Tedori river and its controlling factors.
9
2.Literature review
2.1.Effect of material extraction and dam constructions on river morphology
River morphology is naturally formed by alluvial processes such as erosion and deposition. Erosion and deposition are responses of the rivers to external impacts to maintain an approximate balance between available sediment and sediment transport capacity. Erosion occurs when the sediment transport capacity exceed the sediment supply. Conversely, deposition appears. Theoretically, morphological evolution of the rivers is considered on the basis of three simple principles regarding water flow – hydraulic selection, path of least resistance, and energy dissipation- and on a principle of finite relaxation times (Phillips, 2010).
Human activities exert the river morphology thereby via direct or/and indirect ways. The former often directly alter morphological characteristics of rivers such as riverbed elevation, width, slope, sinuosity and so on. Material mining and channeliza- tion are typical for such activity. The river morphology instantly responds to material extraction and channelization. The latter change the river morphology through ad- justment of controlling factors, which leads to imbalance between sediment supply and sediment transport capacity, ultimately inducing degradation or aggradation in rivers. For example, dam construction is considered as one of the second activities.
Besides, the direct impact could trigger the indirect one on change in river morpholo- gy.
Sand and gravel mining is an activity which uses heavy equipment to physically remove sand and gravel–sized material from riverbeds. Accordingly, pits is excavated in some places such as river channels, floodplains and terraces to extract sand and gravel (Fig. 2.1). Another way is bar skimming involving scraping off the top layer from a gravel bar without excavating below the summer water level (Kondolf, 1994).
Through using these methods to extract sand and gravel, morphological characteris- tics of rivers are intensively altered. However, researches on the adverse effects of sediment mining on the riverine environment in general and on the river morphology in particular have remained limited, which leads to negative impacts of sediment extraction to be commonly neglected in the past (Rinaldi et al., 2005). Existing literatures have addressed morphological effect of sediment extraction as follows.
10
Sediment extraction from the riverbed exceeding the sediment supply firstly causes degradation of the riverbed. It was recognized that presence of a large pit in the riverbed creates discontinuities of sediment transport at both its upstream and down- stream. Here, discontinuities of sediment transport means that the transport rate of bed-material load changes abruptly. The sediment transport discontinuity at the upstream limit of the excavated pit where there is a sudden increase in slope and consequently a rapid increase in sediment transport rate. This leads to exceeding transport capacity to sediment supply. This deficiency of sediment is compensated for by entrainment from the bed and the discontinuity usually moves upstream over time (Collins and Dunne, 1989; Erskine, 1990; Galay, 1983; Kondolf, 1994; Kondolf and Swanson, 1993; Lane, 1947; Surian and Rinaldi, 2003). The discontinuity occurs at the downstream limit of the pit where there is a deficiency of bed-material supply in relation to transport capacity, inducing the erosion of the bed below the pit and subsequently moving this erosion downstream over time (Galay, 1983; Rinaldi, 2003;
Rinaldi and Simon, 1998).
Exceeding degradation of riverbed due to sand and gravel mining could trigger bank instability thereby down-cutting and toe removal, subsequently induce changes in channel width, channel migration in formerly stable reaches (Collins and Dunne, 1989; Rinaldi, 2003; Rinaldi et al., 2005; Surian and Rinaldi, 2003).
Direct extraction of gravel and sand from the riverbed, also can result in amour- ing, the development of a lag deposit of cobbles and boulders on the bed (Kondolf, 1994). Additionally, sediment deficit caused by in-stream mining leads to the selective erosion of finer grains from bed material and the development of bed amour (Rinaldi et al., 2005). As a result of bed degradation, bridges and channeliza- tion structures can be undermined, and pipelines or other structures buried under river beds can be exposed and damaged.
With the same mechanism of influence as that of pit excavation, gravel bar skimming also make the processes of sediment transport discontinuous and may induce downstream incision and lateral instability of the channel, even when the extraction rate are typically smaller than that by pit mining. Removal of the coarser surface layer of sediment due to skimming in natural rivers stimulates bed erosion and increases bed load transport (Kondolf, 1994; Rinaldi et al., 2005).
When pits are constructed near the river and separated only by a strip of land (typically along inactive channels), an avulsion or a more gradual channel migration
11
may cause the pits to be captured during floods. The former off-channel pit is then converted into an in-channel pit, and the effects typical of in-stream mining can be expected. Another important concern of floodplain mining is that wet pits typically intersect the water table, and therefore constitute a preferential path of ground-water contamination and pollution.(Rinaldi et al., 2005)
Another significant effect of sand and gravel mining on morphology is erosion of downstream coast. Because 95% of sediment discharge delivered to the downstream coast is from rivers (Syvitski et al., 2003), sand and gravel extraction in rivers cause deficit of coastal sediment (Huang, 2011; Yuhi, 2008b).
Dams significantly change flow regimes downstream and disrupt continuous processes of sediment transfer from headland to downstream areas. These alterations of the primary fluvial processes below dams lead to change in river morphology. In recent 6 decades, such alteration have been realized as a crucially important issue for river managers: aggradation and degradation having adverse effects upon flood capacity, channel migration, diversions and a range of river uses (Hathaway, 1948).
Morphological processes in a reach below dams are qualitatively explained based on the general expression of Lane (1955), which indicates that fluvial systems adjust so as to maintain an approximate balance between available sediment and sediment transport. Namely, to transfer a given supply of water and sediment load, it requires rivers to change the size of width, depth and slope. According to Petts (1984), re- sponse of rivers below dams was categorized into different three types of adjustment:
Passive response, where flows are reduced below the river’s competence threshold and channel dimensions are reduced accordingly but without significant change in bed elevation; Degradation, where bed elevations and lateral deposits are scoured as the channel moves toward a new equilibrium with the reduced sediment supply; Aggrada- tion, where reductions in discharges and competence due to dam operation are of sufficient magnitude to limit the channel’s ability to entrain and transport sediment delivered by tributary or other inputs downstream of the dam, resulting in an increase in bed elevation. Prior to 1980, due to the paucity of data, researches on behaviors of rivers to dams upstream were mainly conducted in term of qualitative analysis.
Accordingly, rate and extent of degradation was reported by Wolman (1967), Hathaway (1948), Lawson (1925); aggradation was addressed by Makkaveyev (1974), Malhotra (1951), Stanley (1951) and Arroyo (1925). After 1980, with applica- tion of new analysis technology such as airborne multispectral imagery, aerial
12
photography and GIS, coupled with the longer data sets produced advance in river morphology. Thanks to these improvements, narrowing was investigated in Peace River, Canada(Church, 1995) and Green River, USA (Lyons et al., 1992). More specifically, narrowing following aggradation or local degradation was observed in Mangrove Creek, Australia (Sherrard and Erskine, 1991), but widening accompanied with degradation appeared in Osage River, U.S.A (Germanovski and Ritter, 1988).
Conversely, widening in accordance with aggradation was present in Fortun River, Norway (Fergus, 1997). Interestingly, slight change was witnessed in River North Tyne (Sear, 1995) and River Tay in U.K. (Gilvear and Winterbottom, 1992). Besides, change in river pattern was seen: from straight to more sinuous in Mangrove Creek, Australia (Sherrard and Erskine, 1991); from meandering to braided in Green River, U.S.A. (Lyons et al., 1992). Overall, morphological response of each river to dams upstream vary river by river and depends on its condition of climate, geology and topography. It, therefore, needed to conduct more case studies in order to extract an useful framework.
Figure 2.1. Alluvial deposits exploited for aggregate depicted in relation to river channel morphology and alluvial water table (Kondolf, 1994).
2.2. Rate of vertical adjustment in riverbed
Morphological responses of rivers to disturbances or climate-induced change decrease with time and subsequently asymptotically reach a condition of minimum variance. Such variation trend could be well described mathematically by nonlinear
13
functions. In the last century, nonlinear decay functions was used to properly address the evolution and alteration of the rivers (Bull, 1979; Graf, 1977; Hey, 1979; Rinaldi and Simon, 1998; Robbins and Simon, 1983; Schumm and Lichty, 1965; Simon, 1989).
Above literatures indicate that types of nonlinear decay function vary with differ- ent rivers. Graf (1977) used exponential functions to describe the 'relaxation time' necessary to achieve new equilibrium following a disturbance. Robbins and Simon (1983) used exponential decay regressions between water surface slope and time to describe quantitatively gradient adjustment along a particular reach experiencing channelization. A convenient way to interpret temporal and spatial trends of aggradation and degradation is to fit nonlinear functions to bed elevations measured through time, and to plot a measure of these functions versus the distance from the river mouth (Rinaldi and Simon, 1998). Accordingly, Williams and Wolman (1984) found that hyperbolic functions well describe degradation in rivers below dams. Simon (1989) use both exponential and power equations to fit to the observed data in West Tennessee. In this case, the power function is more appro- priate to fit the empirical data than the exponential function. Therefore, it was chosen to describe temporal variation in bed levels at each cross-section. By using this way, parameters of the empirical model sufficiently captured the morphologic responses of West Tennessee, USA in time and space. With some improvements of Simon (1992), an exponential function that describes the dimensionless change in bed elevations is used to simplify comparisons between the two fluvial systems: the Toutle and Obion-Forked Deer River systems. Based on a pair of parameters extracted from the empirical models, temporal and spatial variations in morphological processes of the Toutle and Obion-Forked Deer River Systems was addressed clearly. Similarly, the improved exponential function regression analysis was also applied to the Arno River, Italy. The results indicate that the magnitude and rate of the vertical adjustment of the Armo River experienced several phases corresponding to the impact of human activities on the river basin. However, it also reveals that in some cases, the parameter of the empirical model did not accurately reflect morphologic behaviors of the Armo River. It, therefore, needs to continuously advance the empirical model for applying to other rivers in the world.
14
2.3. EOF analysis
Empirical orthogonal function analysis was used to identify dominant patterns of variability within a data set. Eigenfunction approach considers the explanation of observed data by a set of shape functions (the EOFs) that is extracted from the data itself (Jackson, 1991; Preisendorfer, 1988). EOF separates the temporal and spatial dependence of the data, considering data as a linear combination of products of corresponding functions of time and space (Dai et al., 2013). The EOFs correspond to a statistically optimal description of the data with respect to how the variance is concentrated in the modes, where the variance explained decreases with the mode number (Larson et al., 1999). Therefore, since the explained variance typically decreases with the increasing mode number, most of the variance in the data is explained by only several modes. Thanks to this property, EOFs have been as a data reduction technique or a method to distinguish which is signal or noise. Statistically, it is known that the EOFs are optimal, yet no a priori reason is ensured for the eigen- functions to carry a physical meaning. Frequently, however, corroborating evidence can be used to provide a physical interpretation of the results (Miller and Dean, 2007).
Recently, EOFs have been widely used for describing morphological processes of coastal evolution. Firstly, this method has been most prevailingly applied to investi- gate change in characteristics of transversal profile (Aubrey, 1978; Dick and R.A.Dalrymple, 1984; Pruszak, 1993; Winant et al., 1975; Yuhi et al., 2007; Zarillo and J.T.Liu, 1988). Secondly, it can also be found in application to other types of problems: Losada et al. (1991), Larson et al. (1999) and Liang and J.Seymour (1991) applied this technique to analyse the alongshore variation of specific level contour lines; Medina et al. (1991) used the EOF method to study transversal transport of sediment; cross-shore distribution of sediment has also been studied by Larson et al.
(1999), R.Medina et al. (1994) and R.Medina et al. (1992); both cross-shore and alongshore interactions have been analyzed by means of three modes EOF method (R.Medina et al., 1992). Larson et al. (1999) considered short and long term responses of beach fill. It is realized that EOFs has captured very well the morphological change in the coast. Besides, there have been a few researches on using EOFs to describe the morphological behaviors of rivers. Most typically, Hsu et al. (2006) proposed a two- dimensional empirical eigenfunction model to analyze and predict the variations of riverbed profile. Such a model is then applied to analyze the riverbed variations of the
15
downstream of Chou-Shui River in Taiwan. The results show that the proposed method can reasonably analyze and predict the riverbed variations. This initial work of Hsu et al. (2006) opened a potential application of EOF to morphological analysis of rivers at larger scale in time and space.
3.Regional setting and datasets
3.1.Characteristics of the Tedori River Basin
Figure 3.1.Tedori River Basin
The Tedori River, which originates at Mt. Hakusan, has catchment area of 809 km2 and channel length of 72 km (Fig. 3.1). The main tributary of the Tedori River is the Ushikubi River, with other tributaries being the Ozo River, the Danichi River and other small rivers. The Tedori River flows through the Tsurugi gauging station, on its westward journey through the Kaga Plain to the Japan Sea. The lower Tedori River referred to in the remainder of this paper (the reach downstream of the Tedorigawa Dam) is the portion of the river between the river mouth and 16 km upstream. The Tedori River is one of the steepest rivers in Japan, with average slopes of 1/27 and 1/145 for the entire river and the lower Tedori River, respectively. Based on homoge- neity related to slope, width, and mean diameter of bed material, the lower Tedori River can be divided into four reaches located 0–2 km, 2–7 km, 7–13 km, and 13–16 km upstream of the river mouth (Teramoto et al, 2003) (Table 3.1).
16
The drainage area is underlain by various lithologies, including ancient Hida metamorphic rocks and volcanic rocks from eruptions of Mt. Hakusan. Nobi rhyolites (pyroclastic rock) from the Mesozoic to the Cenozoic era are distributed around the Mt. Hakusan area while Tedori Layers are present in the area east of the Tedorigawa Dam the and Ozo River. Both the Tedori Layers and Nobi rhyolites are prone to massive collapse. Therefore, a large amount of gravel and sand sized sediment has been flowing into the Tedori River.
Table 3.1.Characteristics of the four distinct reaches in the lower Tedori River (Teramoto et al, 2003)
Characteristics Reach 1 Reach 2 Reach 3 Reach 4
Distance upstream of river mouth (km) 0.0–2.0 2.0–7.0 7.0–13.0 13.0–16.0
Channel width (m) 350 358 289 146
Channel slope 1/365 1/190 1/140 1/130
Mean diameter of bed material (mm) 67 77 166 187
Figure 3.2. Temporal variation in daily averaged discharge in the lower Tedori River
The climate of the catchment area is dominated by the monsoon winds blowing in from the Japan Sea. The mean annual rainfall in the Tedori River catchment is about 2,600 mm/yr on the plains, and 3,300–3,600 mm/yr in the mountain ranges. In 1980, the Tedorigawa Dam (Fig. 3.1) was constructed, resulting in changes in the flow regime of the lower Tedori River. The highest average daily discharges in the lower Tedori River typically occur from mid-March to late May (due to snow melt) and
17
from mid-June to mid-July (owing to seasonal rainfall) both before and after the Tedorigawa Dam construction (Fig. 3.2).
3.2.Datasets
The present study focused on variations over the lower Tedori River during 1950–
2007. The 58-year span of the data surveyed with high resolution provided good data coverage in time and space to capture the main trends of long-term variation in the river morphology and its controlling factors. The following datasets were used in this study, that were provided by the Hokuriku Regional Development Bureau of the Ministry of Land, Infrastructure, and Transport of Japan (hereafter referred to as HRDB).
Sand and gravel volumes mined from the river channel from 1951 to 1991 based on annual permissions by local government
Annual volume of dredged material in maintenance activities from 1949 to 1963
Annual sediment deposition in sabo dams from 1936 to 1983 with some miss- ing years
Annually maximum river discharge (Qmax) from 1928 to 2006 measured at the Tsurugi station, located 14 km from the river mouth (Fig. 3.1)
Thirty-six annual surveys of the riverbed topography (1950–1979, 1991, 1997, 1998, 2002, 2003 and 2007) consisting of 81 river cross-sections at intervals of 200 m along the 0–16-km reach
Sequential aerial photographs at scales of 1:15,000 for the years 1947, 1955, 1968, 1984, 1995, and 2000
18
4.Methods of analysis
4.1.Mean bed level at cross-sections
The mean riverbed level of each cross-section was averaged over the cross- sectional extent located below high water level (HWL). Here, HWL in river channel was computed by using a hydraulic model (RIC-Nays) developed by the International River Interface Cooperative (iRIC)(Jang and Shimizu, 2005). The model was calibrat- ed against the Manning roughness coefficient using the high-water marks measured for the flood of the Tedori River at 1441 m3/s on July 13, 2002. The model validation was carried out for another large flood at 2852 m3/s on September 22, 1998 by using the calibrated coefficients. The results show that the calculated and observed water surfaces were qualitatively in good agreement.
Subsequently, an annual longitudinal profile was established from the mean riverbed levels. Note that the bed elevation was described herein relative to the Tokyo Peil (T.P.) datum, which is the standard ground elevation in Japan based on the mean sea level of Tokyo Bay.
4.2.Vertical adjustment
Initially, a comparative analysis of existing surveyed data was conducted to quantify the dominant variation trends in time and space. On the basis of the presence or absence of different human activities, the entire period was divided into three sub periods: (I) 1950–1979, (II) 1980–1990, and (III) 1991–2007.
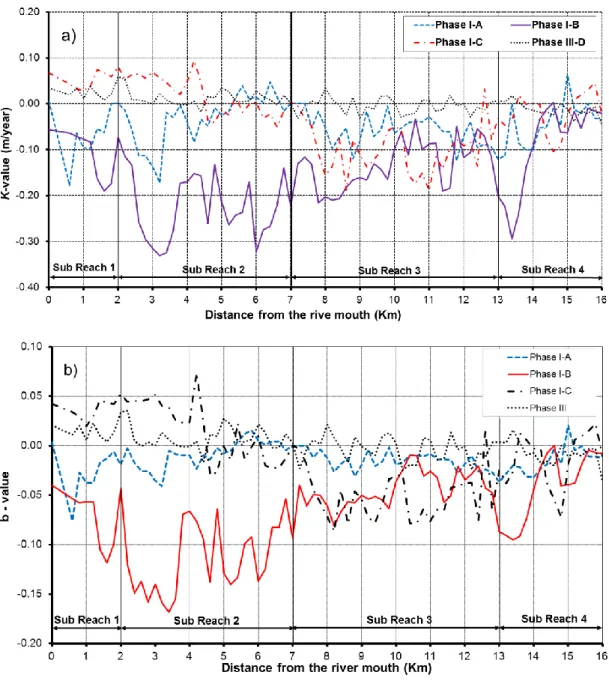
To quantify the yearly variation in riverbed, the rate of vertical adjustment (K, m/yr; K > 0 for deposition, K < 0 for erosion) at each cross-section of the lower Tedori River was computed. Over all cross-sections of the Tedori River, nonlinearly temporal variation in the riverbed elevation at each cross-section has undergone five different phases (Fig. 4.1). The sub period of 1950-1979 (I) includes first three phases I-A, I-B and I-C. Given the paucity of data, the sub period of 1980–1991(II), corre- sponding to phase II, was not considered. The remaining sub period of 1991-2007(III) corresponded to the phase III. Note that the transitional years between two successive phases were addressed based on the criteria that high goodness of a fitting function with the riverbed was simultaneously attained in both phases. Accordingly, the transitional years between phase I-A and I-B varied from 1958 to 1962 and between
19
phase I-B and I-C from 1968 to 1973. Both exponential and power functions were tested to fit the riverbed of the various phases. The exponential function was chosen to describe the temporal trend of the riverbed of the lower Tedori River because it yielded the better fit than the power function. Subsequently, K was calculated for each phase at each cross–section, as follows.
Figure 4.1. Fitting exponential equations to temporal vertical adjustment at the 17 th and 69 th cross –section
The temporal adjustment of the river bed at a cross- section was described well by the exponential functions:
Z(t)-(Zmin-c)=aebt (4-1)
20
where Z(t)= elevation of the riverbed; a= coefficient determined by regression analysis, representing the riverbed elevation at the initial year to=0; Zmin is the lowest riverbed elevation during a given period for each cross-section, in meter above sea level; b= coefficient determined by regression analysis, expressing the rate of nonlin- ear change in the riverbed per year: b>0 for degradation, b<0 for aggradation; c is coefficient ensuring that the left hand side in Eq (5.1) is always positive, c=1m was used for this study; t= the time since the year the onset of adjustment process.
To eliminate effect of the cross section position on coefficient b, the riverbed elevation was extracted by (Zmin-c) before being fitted by the exponential function.
Rate of vertical adjustment (k(t)) at the t-th year was defined as follow:
abebt
dt t dZ
k( )
The average rate of vertical adjustment (K) over the period to-t was calculated as follow:
0 0
0 0
) (
) (
1 )
( ) 1 ) ( (
1 0
0 0
0 t t
e e Z a
t dt t
dt dZ t dt t
t t k K t
bt bt t
t t
t t
t
4.3.Horizontal variation
To investigate the temporal change of the riverbed along the cross-sectional direc- tion, we compared the cross-sections surveyed in 1950, 1979, and 2007. The comparison was carried out for 16 cross-sections at intervals of 1 km.
To evaluate the effect of sediment extraction on the sediment grain size of the Tedori River, the sediment mean diameter (dm) of the in-river sediment from 1963 to 1993 was investigated on the basis of an unpublished internal report of HRDB.
To investigate the variation trends in vegetation cover in the lower Tedori River, the aerial photographs were digitally scanned at resolution of 600 dpi. The area of vegetation cover was then measured for each aerial photograph using CAD software.
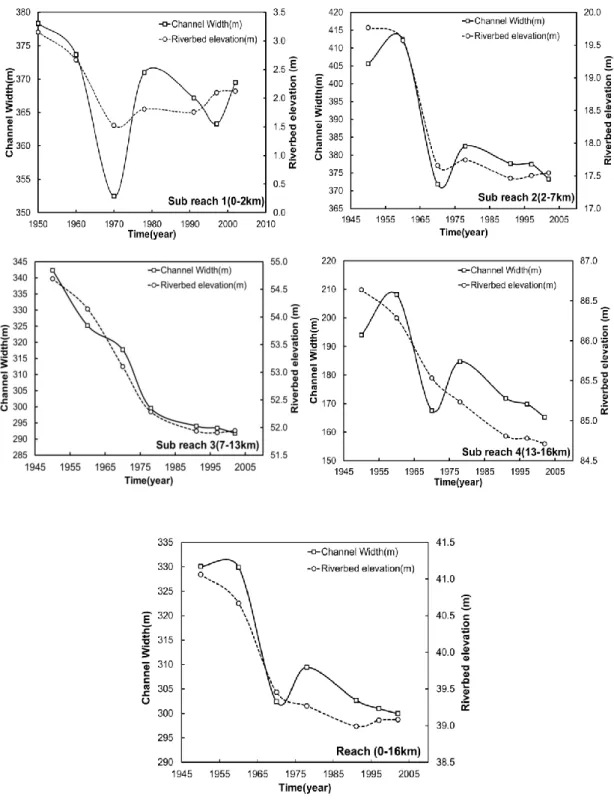
To investigate the relation between horizontal and vertical adjustment of the river channel, the temporal change in channel width was examined. Channel width at each cross-section was defined based on the width of the water surface, which was calcu- lated by using the RIC-Nay model for channel-forming discharge of 1775 m3/s.