Development of low level plutonium measurement by ICP mass spectrometry and its application to marine environment: Pu isotopes and heavy metal elements in Surume squid
著者 及川 真司, Oikawa Shinji
year 2007‑03‑22
URL http://hdl.handle.net/2297/3754
Development of low level plutonium measurement by ICP mass spectrometry and its application to marine environment
- Pu isotopes and heavy metal elements in Surume squid -
SHINJI OIKAWA
January 2007
Doctoral dissertation
Development of low level plutonium measurement by ICP mass spectrometry and its application to marine environment
-Pu isotopes and heavy metal elements in Surume squid-
SHINJI OIKAWA
Graduate School of Natural Science & Technology, Division of Material Sciences,
K ANAZAWA U NIVERSITY
博 士 論 文
ICP 質量分析計による極微量 Pu 同位体測定法の開発と 海洋環境試料への応用
-海産生物試料中の
Pu
同位体および重金属元素-金沢大学大学院自然科学研究科(博士後期課程)
物質科学専攻 物質情報解析講座
学 籍 番 号 :
0 4 2 3 1 3 2 3 0 3 氏 名 : 及 川 真 司
主 任 指 導 教 員 : 山 本 政 儀
T
ABLE OF CONTENTSABSTRACT ... 1
CHAPTER 1 General Introduction ... 3
1.1. General background ... 3
1.2. Practical use of inductively coupled plasma mass spectrometry ... 4
1.3. The aim of this study ... 6
1.4. Content and findings of the dissertation ... 7
References ... 14
CHAPTER 2 Ash content of foodstuff samples in environmental radioactivity analysis 16
2.1. Introduction ... 16
2.2. Methods ... 17
2.3. Results and discussions ... 18
2.3.1. Differences in ash content ... 18
2.3.2. Ash content of foodstuff samples ... 18
2.3.3. Ash content of fish samples ... 19
2.4. Conclusions ... 20
References ... 26
CHAPTER 3 Rapid separation techniques for the determination of plutonium in environmental samples by using an anion exchange resin disk ... 28
3.1. Introduction ... 28
3.2.1. Instruments for alpha-ray spectrometry ... 29
3.2.2. Instruments for mass spectrometry ... 29
3.2.3. Anion exchange resin disk ... 30
3.2.4. Apparatus, reagents and standard solutions ... 30
3.2.5. Determination of the decontamination factors ... 31
3.2.6. Measurement of the elution behavior of Pu in the procedure ... 31
3.2.7. Building of chemical separation procedure ... 31
3.3. Results and discussion ... 33
3.3.1. Elution behavior of Pu and the decontamination factor of interference elements ... 33
3.3.2. Application to environmental samples ... 33
3.4. Conclusions ... 34
References ... 39
CHAPTER 4 Determination of trace elements in squid organs by inductively coupled plasma mass spectrometry and neutron activation analysis ... 41
4.1. Introduction ... 41
4.2. Experimental ... 42
4.3. Results and discussion ... 43
4.3.1. Elemental losses following ashing process ... 43
4.4. Comparison ICP-MS with INAA method ... 43
4.5. Concentration of metal elements in squid organs ... 44
4.5.1. Distribution of metal elements in squid and its concentration factors ... 44
4.5.2. Distribution of metal elements in squid organs ... 45
4.6. Conclusions ... 45
CHAPTER 5 Plutonium concentration and
240Pu/
239Pu atomic ratio in liver from squid
collected in the coastal sea areas of Japan ... 56
5.1. Introduction ... 56
5.2. Materials and methods ... 57
5.2.1. Sampling and pretreatment method ... 57
5.2.2. Measurements of Pu isotopes by sector field ICP-MS ... 58
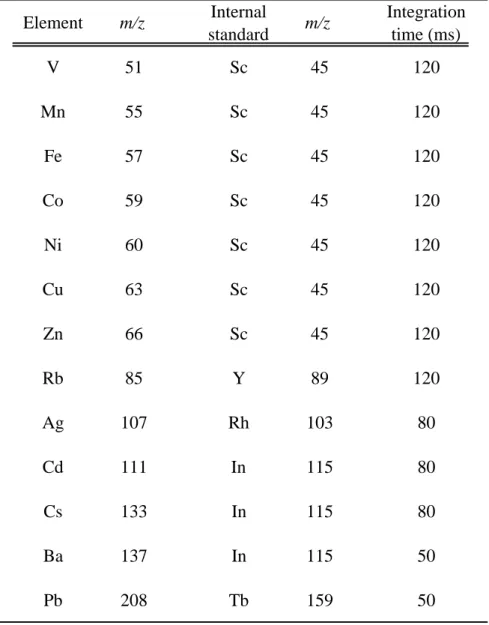
5.2.3. Measurement of major metal elements ... 60
5.3. Results and discussion ... 60
5.3.1. Concentrations of Pu isotopes and 13 elements in Surume squid liver ... 60
5.3.2.
240Pu/
239Pu atomic ratio in Surume squid liver ... 62
5.4. Conclusions ... 64
References ... 73
CHAPTER 6 Conclusions ... 77
Appendix ... 81
List of Publications ... 96
Acknowledgements ... 98
ABSTRACT
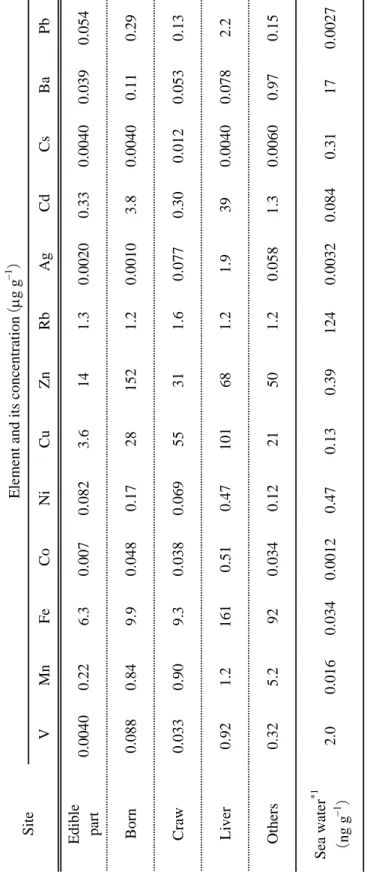
As a biological indicator in tracing the levels and fate of contaminants such as toxic metals and radionuclides in marine environment, squids, especially Surume squid, were selected since their life span was only a year and trace elements were remarkably concentrated in their organs. The losses of trace elements in marine organisms during thermal decomposition were at first investigated with emphasis on the development of low level plutonium measurement by inductively coupled plasma mass spectrometry (ICP-MS). These findings were applied to the measurements of plutonium isotopes and some stable elements (V, Mn, Fe, Co, Cu, Zn, Rb, Sr, Ag, Cd, Cs, Th and U) in liver of Surume squid collected in the coastal sea areas of Japan. The Pu and other 13 elements were concentrated with concentration factor (CF) ranging from 10
0to as high as 10
7. Transition metal elements, Mn, Fe, Co, Cu, Zn, Ag and Cd were concentrated with high CF values (10
6). Plutonium, as well as V and Th, were concentrated in liver with CFs of 10
2to 10
4. The
240Pu/
239Pu atomic ratios 0.177 to 0.237 which were slightly higher than 0.178 ± 0.014 for global fallout were found in squid liver.
Based on the habitat of the Surume squid and ocean currents, the Pu found in the liver might
be due to a mixture of global fallout Pu and close-in fallout Pu with high
240Pu/
239Pu atomic
ratio around Bikini Atoll. By assuming the two sources mixing model, Bikini close-in fallout
Pu accounts for ca. 35% of the whole plutonium amounts. The results strongly indicate that
the squid liver is very usefully biological indicator for evaluating marine pollution of Pu and
some other trace elements.
CHAPTER 1
CHAPTER 1 : General Introduction.
1.1. General background
The man-made long-lived radionuclides, such as
90Sr,
137Cs and Pu isotopes, are now in distributed world wide as a result of global fallout from atmospheric nuclear weapons tests.
The total oceanic inventories of selected fission products and transuranium elements produced in atmospheric nuclear weapons tests are reported by Hamilton (2004). However, plutonium has a lot of isotopes as shown in Table 1.1, regarding Pu isotopes, it was estimated that, since 1945, about 12 PBq of
239+240Pu has been deposited on the oceans as global fallout from 543 atmospheric nuclear weapons tests (UNSCEAR 2000). According to the report, the Arctic, Atlantic, Indian and Pacific Oceans contain about 0.1 PBq, 2.3 PBq, 1.0 PBq and 8.6 PBq of
239+240
Pu, respectively. These data predict that a significant fraction of the plutonium present in the Pacific Ocean comes from local and regional injections rather than global fallout deposition. Water column inventories in the North Pacific do reflect an excess of plutonium above what is expected from global fallout depositions (Bowen et al., 1980).
Artificial radionuclides
110mAg and
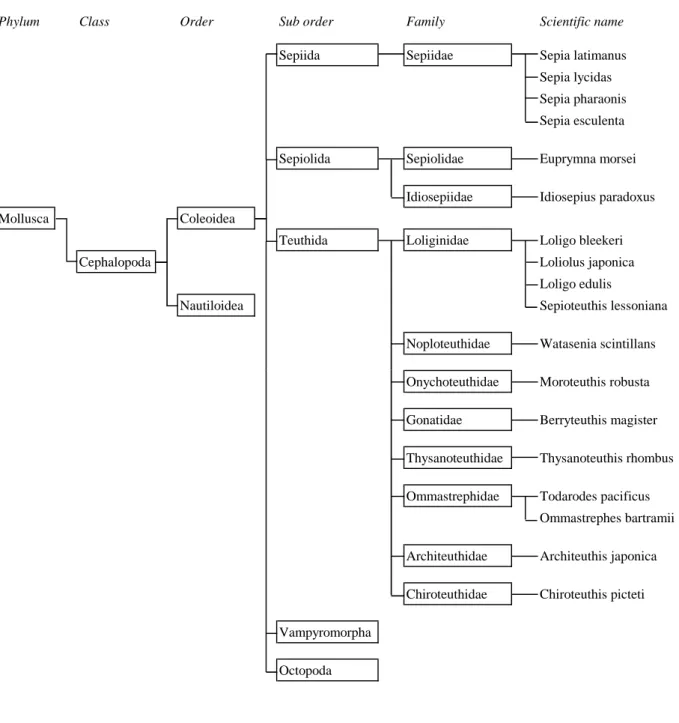
60Co appear in marine organisms as a result of metabolism during a growth processes (Folsom et al., 1965). This finding is useful for evaluating toxic metal elements and radionuclide pollution in marine environment (Folsom et al., 1970). Seawater is the most significant medium to migration processes in the marine environment. Instead of seawater, marine organism which inhabits inshore sea areas around our country will be useful bio-indicator for environmental radioactivity monitoring. Surume squid (Todarodes pacificus), one of the squid classifies as shown in Fig. 1.1 are convenient for our purpose from view point of landing things in a nationwide scale and developed a channel of distribution in our country.
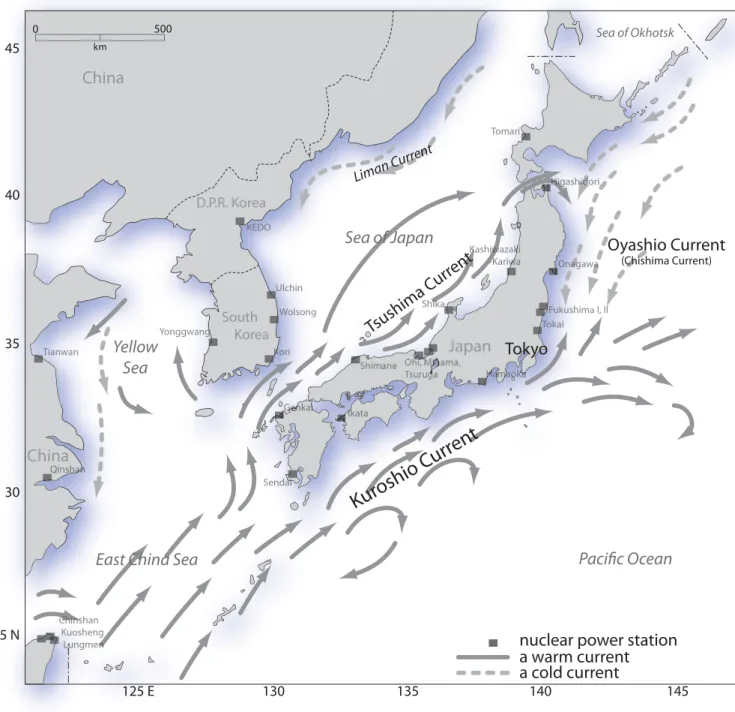
The main island of Japan (Honshu) is surrounded by the Pacific Ocean and the Sea of
tons of squids were caught in each of the last five years, and the Surume squid represents about half (or more) of the catch, and they are easily caught everywhere on the coast around Japan’s islands (Living Information Center, 2003). Since their life span is only a year and trace elements are remarkably concentrated in their organs, levels of trace elements in seawater can be monitored by measuring these elements in their organs (Abe and Honma, 1997). In contrast to flat fish, seaweed and benthos which inhabit in quite small area, the squid moves long distance and pathways depending mainly on seawater temperature (Abe and Honma, 1997). Therefore, the squid may be useful for monitor of larger sea area. Although the habitable sea area is not uniform since Surume squid is migrant marine organism depending on sea temperature and ocean current (Fig. 1.2). Surume squid is a kind of invertebrate marine organism which has a three parts of the body (Fig 1.3). Surume squid liver is the largest internal organ and it is easy to confirm and remove liver from other internal organs (Fig. 1.4). Surume squid liver, largest internal organs is suitable for natural samples in the field of environmental radioactivity monitoring (Folsom et al., 1965).
1.2. Practical use of inductively coupled plasma mass spectrometry
Inductively coupled plasma mass spectrometry (ICP-MS) is arguably the most versatile
trace elemental analysis technique available today. Depending on the individual instrument
configuration, sample types ranging from seawaters and rock digests to ultra pure
semiconductor grade chemicals can be routinely analyzed, almost all the element in the
Periodic Table, from "low pg ml
-1" to "high ug ml
-1" concentration levels. It is this versatility
that has led to the rapid acceptance and subsequent growth of the technique. Since the launch
of the first commercial quadrupole ICP-MS instrument in 1983, the technology has evolved
from large, floor-standing, manually operated systems, with limited functionally and
relatively poor detection limit capabilities, to compact, sensitive and highly automated routine
much less complex than ICP optical emission spectra, interferences were nonetheless present and as ICP has grown, considerable attention has been focused on achieving wholly interference-free analysis. The first step towards achieving this objective was the development of high resolution ICP-MS in the late of 1980s, whereby analytes could be resolved from interferences using a magnetic field, by virtue of the mass differences between analyte/interference pairs. This technology, although effective in resolving a wide range of polyatomic interferences, lacks the power to the resolve isobaric interferences (i.e. overlap between isotopes of the same nominal mass, such as
87Rb and
87Sr). Recently years, the advent of collision/reaction cell technology has revolutionized quadrupole ICP-MS. Born out of existing technology for triple quadrupole organic mass spectrometers; collision/reaction cells have taken interference reduction a dramatic step forward. Through collision and reaction with appropriate gases in a cell preceding the analyzer quadrupole, interferences such as
40Ar
2+can be completely eliminated while leaving analyte ions (
80Se in this case) relatively unaffected.
Recently, ICP-MS instrument has become a powerful tool for the determination of both long-lived radionuclides and trace levels of heavy metal elements in environmental samples.
Naturally occurring and artificial radionuclides present in environment are useful indicators in many field of science. From a view point of radiation protection of the general public, these radionuclides need to be analyzed in different environments at natural levels and at elevated concentrations, following accidents at nuclear facilities. When radionuclides are released after accidents, they will be transported by air and water. Since the half-lives of many released radionuclides are very long, people will be radiated internally and externally for long periods by contact with the environment, by food intake and etc. Plutonium isotopes are especially important in ecotoxicology since it seems that they significantly affect the human body.
Plutonium has accumulated in the environment from several sources, such as atmospheric
discharges from nuclear facilities. The isotopic composition of Pu is characteristics for each origin, and so it is possible to estimate the source location from the
240Pu/
239Pu atomic ratio in the samples. In addition, Pu isotopic ratio gives important geochemical information about the behavior of Pu in marine and terrestrial water environments. Usually, the
240Pu/
239Pu isotopic composition cannot be measured by conventional alpha-ray spectrometry. For isotope measurement of Pu, thermal ionization mass spectrometer (TIMS) has been the most commonly used method, although occasionally the fission track (FT) method has been applied.
The first paper reporting Pu determination and isotopic composition measurement in environmental samples using ICP-MS was published by Kim et al. (1989). Since then, ICP-MS was only just starting to gain recognition in the field of analytical chemistry; they applied the technique to analysis of long-lived radionuclides in environmental samples.
Following this work, a number of papers discussing on the measurement of long-lived radionuclides, particularly Pu isotopes, using ICP-MS increased rapidly, and it is not an exaggeration to say that this technique is now regarded as a standard approach for analysis of these isotopes in a broad range of samples.
1.3. The aim of this study
In the field of radioactivity monitoring for Pu isotopes commissioned with Japanese government, routine analysis for Pu isotopes in seawater is carried out by radiochemical analysis using a large volume (100 L) of seawater samples according as standardized radiochemical method. However, a large volume seawater samples are hard to handling through routinely chemical separation schemes without elemental losses as low as possible.
Instead of seawater sample, marine organism, especially Surume squid is found to be useful for environmental radioactivity monitoring as living indicators.
Therefore the sample preparation method was studied from view point of ashing processes
exchange resin disk are developed for the determination of Pu isotopes by alpha-ray spectrometry and ICP-MS in standard reference materials. Before radioactivity monitoring by using marine organisms, chemical behavior and concentration levels of trace elements concerning radioactivity monitoring (i.e.
60Co-stable Co,
90Sr-stable Sr,
110mAg-stable Ag, etc.) were determined by neutron activation analysis and ICP-MS to compare both method for estimation of the validation. Finally, obtained knowledge through this study are applied to Surume squid liver collected in the coastal sea area in Japan, and discussion on the possibility of the usefulness of squid liver for environmental radioactivity monitoring in marine environment.
1.4. Content and findings of the dissertation
In this CHAPTER, general introduction of the investigation including a general background, practical advantages of the inductively coupled mass spectrometry, the aim of the study.
CHAPTER 2 described ash content of foodstuff samples in environmental radioactivity analysis. Statistical data of the ash content in various kind of foodstuff samples obtained from an environmental radioactivity survey project commissioned by Japanese government of Science and Technology Agency (at present Ministry of Education, Culture, Sports, Sciences and Technology) during the past decade are expressed for establishing a standard ash content in foodstuff samples based on environmental radioactivity analysis.
CHAPTER 3 described a rapid separation technique of plutonium in environmental
samples using an anion exchange resin disk. A rapid analytical method of plutonium in
environmental samples by alpha-ray spectrometry and sector field inductively coupled plasma
mass spectrometer using an anion exchange resin disk 3M Empore
TMfor solid phase
extraction has been developed.
inductively coupled plasma mass spectrometry and neutron activation analysis with the aim for an analytical validation of the inductively coupled plasma mass spectrometry method by neutron activation analysis.
CHAPTER 5 described the radioanalytical and mass spectrometric analysis by a sector field inductively coupled plasma mass spectrometer of plutonium concentration in Surume squid liver collected from the coastal sea areas of Japan. Emphasis is put on the
240Pu/
239Pu atomic ratio of plutonium in the liver. In addition to plutonium, levels of 13 elements (V, Mn, Fe, Co, Cu, Zn, Rb, Sr, Ag, Cd, Cs, Th and U) were measured for comparison. These data are discussed with emphasis on the potential use of plutonium signatures in squid liver to trace the radioactive and marine contamination of plutonium.
Finally, CHAPTER 6 described a conclusion of this dissertation.
Phylum Class Order Sub order Family Scientific name
Sepiida Sepiidae Sepia latimanus
Sepia lycidas Sepia pharaonis Sepia esculenta
Sepiolida Sepiolidae Euprymna morsei
Idiosepiidae Idiosepius paradoxus
Mollusca Coleoidea
Teuthida Loliginidae Loligo bleekeri
Cephalopoda Loliolus japonica
Loligo edulis
Nautiloidea Sepioteuthis lessoniana
Noploteuthidae Watasenia scintillans Onychoteuthidae Moroteuthis robusta Gonatidae Berryteuthis magister Thysanoteuthidae Thysanoteuthis rhombus Ommastrephidae Todarodes pacificus
Ommastrephes bartramii Architeuthidae Architeuthis japonica Chiroteuthidae Chiroteuthis picteti Vampyromorpha
Octopoda
Fig. 1.1 Typical scientific classification of the squids.
25 N 30 35 40 45
125 E 130 135 140 145
Tokyo
D.P.R. Korea
South Korea
China
Yellow Sea China
Sea of Japan
East China Sea Pacific Ocean
Sea of Okhotsk
Japan
Kur oshio C urrent
Tsushima C
urr ent Oyashio Current
(Chishima Current)
Liman Current
km 0 500
Fig. 1.2 The Janan islands surrounding sea, Sea of Japan, East China Sea, Sea of Okhotsk and Pacific Ocean with the schemitic ocean current flowing patterns.
a warm current a cold current
nuclear power station
Qin
CChins
u n
i ai Genkai Genkai
hik
ag wa
I d hido Hig
ki k w K -K waw
Ikata I
o o Hamaoka Hamaoka
body head brachium eye
funnel (infundibulum)
tentacle
mantle
fin
venter
(a)
funnel (infundibulum) venter
dorsum
anterior posterior
(b) 1
2
3
tentacle
mouth
left side right side
arm #1
arm #2
arm #3
liver
anus rectum ink sac
branchia spermatophore branchial heart stomach
spermary
male
female
ovary uterine tube incubation tube
Fallopian tube
liver
Half life Decay type Energy(MeV) Source (reaction) 34.1 m EC(80%), α (20%) 1.060(EC), 6.716( α )
232Am EC,
233U( α , 5n),
235U( α , 7n) 20.9 m EC(99.8%), α (0.12%) 1.900(EC), 6.420( α )
233U( α , 4n) 8.8 h EC(94%), α (6%) 0.388(EC), 6.310( α )
234Am EC,
238Cm α 25.3 m EC(99.99%), α (0.003%) 1.170(EC), 6.000( α )
235U( α , 4n),
233U( α , 2n) 2.858 y α (100%), sf( ≈ 0%) 5.867( α )
236Np β
−,
240Cm α ,
235U( α , 3n γ ) 45.2 d EC(99.99%), α (0.004%) 0.220(EC), 5.750( α )
237Am EC,
241Cm α ,
237Pu IT 87.7 y α (100%), sf( ≈ 0%) 5.593( α )
238Np β
−,
238Am EC,
242Cm α 2.41×10
4y α (100%), sf( ≈ 0%) 5.244( α )
239Np β
−, Muonic,
239Am EC,
243Cm α 6563 y α (100%), sf( ≈ 0%) 5.256( α )
240Np β
−,
240Am EC,
244Cm α 14.35 y β
−(100%), α ( ≈ 0%) 0.021( β
−), 5.140( α )
241Np β
−,
245Cm α ,
240Pu(n, γ ) 3.733×10
5y α (100%), sf( ≈ 0%) 4.982( α )
242Np β
−,
242Am EC,
246Cm α 4.956 h β
−(100%) 0.582( β
−), 4.754( α )
243Np β
−,
247Cm α ,
242Pu(n, γ ) 8.08×10
7y α (99.9%), sf( ≈ 0.1%) 4.665( α )
248Cm α ,
244Np β
−,
244Am EC 10.5 h β
−(100%) 1.205( β
−), 0.150( γ )
244Pu(d, p), Fission isomer 10.84 d β
−(100%) 0.401( β
−)
244Pu(t, p)
References
Abe S. and Honma A., 1997. Modern Encyclopedia of Fish, 1
stedition. NTS, Japan. (in Japanese)
Bowen et al., 1980. Fallout radionuclides in the Pacific Ocean: Vertical and horizontal distributions, largely from GEOSECS stations. Earth and Planetary Science Letters 49, 411-434.
Folsom T. R. and Young D. R., 1965. Silver-110m and cobalt-60 in oceanic coastal organisms.
Nature 206, 803-806.
Folsom T. R. et al., 1970. Long-lived γ-ray emitting radionuclide silver-108m found in Pacific marine organisms and used for dating. Nature 227, 941-943.
Hamilton T. F., 2004. Linking legacies of the Cold War to arrival of anthropogenic radionuclides in the oceans through the 20th century. Marine Radioactivity, pp. 23-78, Hugh D. Livingston (Ed.), Elsevier Science Ltd.
Kim C. K. et al., 1989. Measurement of
240Pu/
239Pu ratio by fission track method and inductively coupled plasma mass spectrometry. Journal of Radioanalytical and Nuclear Chemistry 136, 353-362.
Living Information Center, 2003. Statistical Databook on Fishes and Marine products 2003.
Living Information Center, Inc., Tokyo Japan. (In Japanese)
Simon M Nelms (Ed.). 2005. ICP Mass Spectrometry Handbook. Blackwell Publishing, Ltd., Oxford, UK.
UNSCEAR report, 2000. Sources and Effects of Ionizing Radiation; United Nations Scientific
Committee on the Effects of Atomic Radiation Exposures to the Public from Man-made
Sources of Radiation. United Nations, New York.
CHAPTER 2
CHAPTER 2 : Ash content of foodstuff samples in environmental radioactivity analysis.
2.1. Introduction
Radionuclides present in environment can be classifies into two categories, natural and artificial radionuclides from viewpoint of its origins. Based on the nuclear safety, radioactivity monitoring around nuclear facilities are important things due to increasing of the electricity demand following peaceful operations of nuclear power plants. Background survey for the general public is an important thing using a distribution foodstuffs samples from view point of radioactivity monitoring. Particularly, radionuclides present in the environment distributed by nuclear weapons tests conducted in atmospheric environment mainly at the northern hemisphere may potentially ingest to human beings via food chains. Consequently, environmental radioactivity analysis for foodstuff samples has to take a broad and long-term view of things, and the results are used to be background data based on radioactivity monitoring.
In our laboratory, radioactivity analysis has been carried out in environmental food
samples such as dietary food, dairy products, root vegetables, green vegetables, fishes, teas
and food cereals. From view point of a nationwide background survey project, it should be
carried out in uniform pre-treatment, radiochemical and measurement methods. Pre-treatment
methods, particular ashing process, applied for environmental radioactivity analysis are
deficient in statistical and experiences data nevertheless effective techniques to reducing
sample volume. Generally, ashing process is conducted by using an electric furnace. However,
ashing efficiency is depending on location in the furnace, or temperature control
characteristics of the electric furnace. To avoid elemental losses, especially cesium isotopes,
temperature at ashing is routinely up to 450 ˚C for 24 hours. The temperature at 450 ˚C is
lower than the literature values and different in the method. Thus, information on ashing and
environmental radioactivity analysis (Nonaka et al., 1981; 1985).
In this chapter, statistical data of the ash content in various environmental samples obtained from an environmental radioactivity survey project commissioned by the Japanese government of Science and Technology Agency (at present the Ministry of Education, Culture, Sports, Sciences and Technology) cooperate with prefectural hygiene centers during the past 10 years are expressed for establishing a standard ash content in environmental samples based on radioactivity analysis.
2.2. Methods
Environmental foodstuff samples subjected of our survey was selected from a standpoint of our daily life; dietary foods, milk, spinach, Japanese radish, edible part of fishes, whole fishes, green tea, cabbage, Chinese cabbage, potato and onion. Those samples were obtained from commercial market in cooperate with the 47 prefectures of prefectural hygiene center in every fiscal year from 1993 to 2002. Raw samples were ashed at 450 ˚C for 24 hours at the prefectural hygiene center and then an aliquot of ash was sent to our laboratory. The ash samples were aliquot about one gram and then ashed again at 450 ˚C for 5 hours. Ash content C
ashwas calculated by following equation;
ash
100
ash raw
C W
= W × (%) ・・・ (1)
where W
ashis weight of ash (g), W
rawis weight of raw sample before ashing (g). In the case of dietary food sample, it is difficult to interpretation as a uniform sample due to differ from place to place, manners and customs and an age bracket. Consequently, dietary food samples were obtained by "set a meal for an absent person" thanks to the cooperation with participants.
Daily meals collected into vinyl bag and then ashed at 450 ˚C for 24 hours. Ash content was
calculated by equation (1) and result was converted to "g/person/d" unit.
2.3. Results and discussions 2.3.1. Differences in ash content
Remarkable progress in electronic devices past few decades has brought about a revolution in many aspects of our daily life. Electric furnace used in environmental radioactivity analysis is also useful tools for sample preparation. However, sample preparation skills are still not entirely in agreement on ash content. As an example of spinach sample, relative deviations of ash content between the 47 prefectures of prefectural hygiene center and our laboratory (JCAC) are shown in Fig. 2.1. This difference may be caused mainly by incomplete calcinations of the samples containing unburned charcoal dust.
2.3.2. Ash content of foodstuff samples
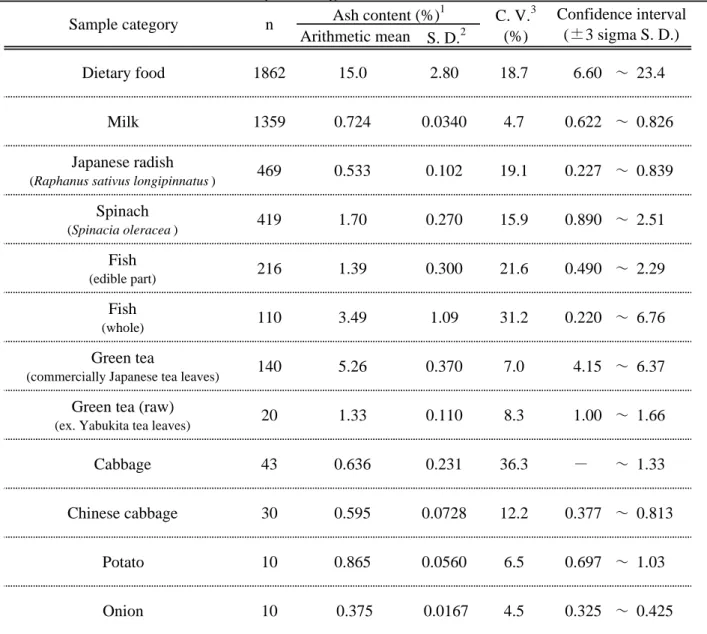
It is difficult to classify of the ash content every foodstuff samples which includes many different fields. To evaluation of ash content from overview classifications, foodstuff sample was categorized 12 groups as dietary food, milk, spinach, Japanese radish, fish (edible part), fish (whole), green tea, cabbage, Chinese cabbage, potato and onion. The result of statistical calculation of the above 12 groups from fiscal year of 1993 to 2002 are summarized in Table 3.1 together with confidence intervals (three sigma standard deviation).
Depending on personal dietary habits, dietary food is heterogeneousness sample. However, the results of mean ash content and its statistics obtained from the past decades were 15.0 ± 2.8 g/person/d (n=1862) as shown in Fig. 2.2. Ash content of the dietary food "15.0 ± 2.8 g/person/d" can be interpreted as an average ash content of the Japanese meals and also meals of dietary habits/culture in our country. Although dietary food sample is heterogeneousness from view point of individuals, it is homogeneousness from point of the ash content after sample calcinations.
In the case of milk, it is the most homogeneousness sample in 12 categories. Ash content
shown in Fig. 2.2. The reason milk ash content uniformed that a whole milk sample was carbonized and then being reduced to ashes without human experiences.
In the case of Japanese radish and spinach samples from green vegetables and root vegetables categories, a part of the foods such as edible part of the Japanese radish (e.g. leaves include edible part or not) depend on regional dietary cultures. In the case of fish (edible part) sample, ash content was 1.39 ± 0.300 % with the coefficient of variation of 21.6 % (n=216).
This is because that cut and divide the fish techniques are requires a great deal of skill, so that coefficient of variation might be derived mainly on human skills. On the other hand, fish (whole) were directly ashed in electric furnace without special (such as cut and divide) processes. However, ash content was 3.49 ± 1.09 % (n=110) and coefficient of variation (31.2 %) is higher than that of fish (edible part) (21.6 %). This variance may be caused by difference of the percentage of muscle, born and internal organs based on maturities.
Ash content obtained from Green teas and Chinese cabbage is relatively lower than that of above categories of food samples. Green tea, commercially available Japanese tea leaves and raw green tea such as Yabukita tea leaves are likely to homogeneous sample from view point of ash content.
As a whole, coefficient of variation seems to be depending on technical skill under sample preparation such as cut, divide and rend of the part of sample. Ash content shown in Table 2.2 is an average ash content at 450 ˚C for 24 hours.
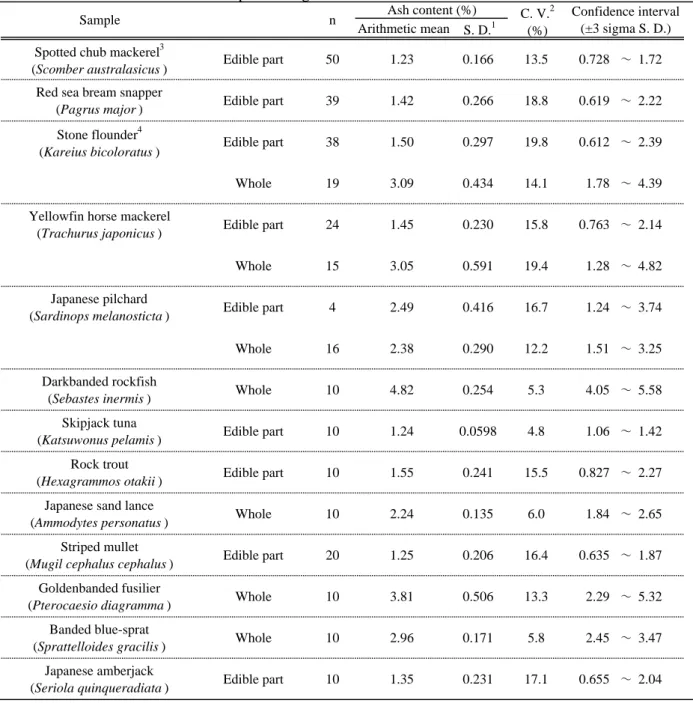
2.3.3. Ash content of fish samples
Ash content of fish sample describing as mentioned above were typical ash content
obtained from various kinds of fishes. However, ash content was a great difference every kind
of fish. Ash content of twelve kinds of fish obtained from past decades radioactivity analysis
project are summarized in Table 2.3. There is 5-10 % higher than that of ash content reported
2.4. Conclusions
Pretreatment of environmental samples especially ashing processes are important from the
view point on environmental radioactivity analysis, which is one of the especial fields on
analytical chemistry. Statistical reviewed data obtained in this chapter may useful for sample
preparation on environmental radioactivity analysis.
0.0
1.0
2.0
3.0 -20 0 20 40 60 80
100 10 20 30 40 50 60 70 80 90
Ash content(%) by local authority Ash content(%) by JCAC
Ash content
% (
)
Relative deviation for ash content(%)
*Sample ( n=84 )
Bar →
JCAC Local authority Ash content 1.74 1.90 Mean 0.25 0.32 S.D. 1.16 1.27 Min. 2.43 3.22 Max.
Spinach ( Spinacia oleracea ) (Local authority - JCAC) (JCAC) × 100 *Relative deviation for ash content were calculated by the equation: Fig. 2.1 Relative deviations of ash content between the local authority and JCAC.
0 20
40
60
80 100 6.4 7.6 8.8 9.9 11 12 13 15 16 17 18 19 20 22 23 24 25 26 27 28
Dietary food
Frequency
Ash content ( g/person/d )
1862 n 15.0 Mean 2.80 S.D. 28.5 Max. 7.60 Min. Mean (15.0)
99.7% confidence interval (± 3 σ ) 95.4% confidence interval (± 2 σ ) Fig. 2.2 Frequency distribution of ash content for dietary food samples collected from a nationwide in Japan during 1993 to 2002.
0 50
100
150 0.52 0.58 0.64 0.69 0.75 0.81 0.86 0.92 0.98 1 1.1 1.2
Milk
Frequency
Ash content ( % )
Mean ( 0.724 )
99.7% confidence interval (± 3 σ ) 95.4% confidence interval (± 2 σ )
1359 n 0.724 Mean 0.0340 S.D. 1.12 Max. 0.550 Min. Fig. 2.3 Frequency distribution of ash content for milk samples collected from a nationwide in Japan during 1993 to 2002.
Arithmetic mean S. D.
2Dietary food 1862 15.0 2.80 18.7 6.60
~23.4
Milk 1359 0.724 0.0340 4.7 0.622
~0.826
Japanese radish
(Raphanus sativus longipinnatus)
469 0.533 0.102 19.1 0.227
~0.839
Spinach
(Spinacia oleracea)
419 1.70 0.270 15.9 0.890
~2.51
Fish
(edible part)
216 1.39 0.300 21.6 0.490
~2.29
Fish
(whole)
110 3.49 1.09 31.2 0.220
~6.76
Green tea
(commercially Japanese tea leaves)
140 5.26 0.370 7.0 4.15
~6.37
Green tea (raw)
(ex. Yabukita tea leaves)
20 1.33 0.110 8.3 1.00
~1.66
Cabbage 43 0.636 0.231 36.3 -
~1.33
Chinese cabbage 30 0.595 0.0728 12.2 0.377
~0.813
Potato 10 0.865 0.0560 6.5 0.697
~1.03
Onion 10 0.375 0.0167 4.5 0.325
~0.425
1
Ash content given in "%" except for Dietary food "g/person/d".
2
Standard deviation from ash content of each sample.
3
Coeficient of variation.
Table 2.1 Ash content for foodstuff samples during 1993-2002.
Confidence interval ( ± 3 sigma S. D.) Sample category n Ash content (%)
1C. V.
3(%)
Arithmetic mean S. D.1 Spotted chub mackerel3
(Scomber australasicus) Edible part 50 1.23 0.166 13.5 0.728 ~ 1.72
Red sea bream snapper
(Pagrus major) Edible part 39 1.42 0.266 18.8 0.619 ~ 2.22
Stone flounder4
(Kareius bicoloratus) Edible part 38 1.50 0.297 19.8 0.612 ~ 2.39
Whole 19 3.09 0.434 14.1 1.78 ~ 4.39
Yellowfin horse mackerel
(Trachurus japonicus) Edible part 24 1.45 0.230 15.8 0.763 ~ 2.14
Whole 15 3.05 0.591 19.4 1.28 ~ 4.82
Japanese pilchard
(Sardinops melanosticta) Edible part 4 2.49 0.416 16.7 1.24 ~ 3.74
Whole 16 2.38 0.290 12.2 1.51 ~ 3.25
Darkbanded rockfish
(Sebastes inermis) Whole 10 4.82 0.254 5.3 4.05 ~ 5.58
Skipjack tuna
(Katsuwonus pelamis) Edible part 10 1.24 0.0598 4.8 1.06 ~ 1.42
Rock trout
(Hexagrammos otakii) Edible part 10 1.55 0.241 15.5 0.827 ~ 2.27
Japanese sand lance
(Ammodytes personatus) Whole 10 2.24 0.135 6.0 1.84 ~ 2.65
Striped mullet
(Mugil cephalus cephalus) Edible part 20 1.25 0.206 16.4 0.635 ~ 1.87
Goldenbanded fusilier
(Pterocaesio diagramma) Whole 10 3.81 0.506 13.3 2.29 ~ 5.32
Banded blue-sprat
(Sprattelloides gracilis) Whole 10 2.96 0.171 5.8 2.45 ~ 3.47
Japanese amberjack
(Seriola quinqueradiata) Edible part 10 1.35 0.231 17.1 0.655 ~ 2.04
1Standard deviation from ash content of each sample.
2Coeficient of variation.
3include Chub mackerel (Scomber japonicus)
4include Brown sole(Limanda herzensteini)
Table 2.2 Ash content for Pisces samples during 1993-2002.
Sample n Ash content (%) C. V.2
(%)
Confidence interval (±3 sigma S. D.)
References
Nonaka N. et al., 1981. Losses of the elements during dry ashing of plant materials. Bunseki Kagaku 30, 599-604. (in Japanese with English abstract)
Nonaka N. et al., 1985. Losses of elements during dry ashing of standard reference materials (Orchard Leaves); Relationship between ashing temperature, ashing time, and elemental loss. Bunseki Kagaku 34, 360-364. (in Japanese with English abstract)
Standard Tables of Food Composition in Japan. Fifth revised edition, 2000. Resources
Council, Science and Technology Agency, Japan. (in Japanese)
CHAPTER 3
CHAPTER 3 : Rapid separation techniques for the determination of plutonium in environmental samples by using an anion exchange resin disk.
3.1. Introduction
Various analytical methods have been applied to the chemical separation and determination of plutonium in environmental samples. Recently days, much interest has been shown in replacing conventional solvent extraction and ion exchange techniques for separating environmental radionuclides. Rao and Cooper applied selective oxidation-reduction and co-precipitation with NdF
3to the separation of actinides (Rao and Cooper, 1995). Horwitz et al. developed several new extraction chromatographic resins (commercialized by Eichrom Industry) and applied to the separation of actinide elements (Horwitz et al., 1993, 1993b ; Maxwell, 1993). Bunzl and Kracke determined the concentration of plutonium isotopes in human tissues and soil samples using extraction chromatographic resin, TEVA spec
TM, Eichrom Industries Ltd, USA (Bunzl and Kracke, 1994).
The extraction chromatographic resin is usually used in slow flow rate (0.5-1.0 ml min.
-1) and sometimes the loaded extractant on inert polymeric substrate bleed with the effluent during the separation procedure. The bleed extractant interfere the determination of actinides by absorptiometry and electrodeposition of actinides for alpha-ray spectrometry. In contrast, a 3M Empore
TManion exchange resin disk consists of fine resin particles (average particle size, 1.2×10
-7m) tightly held in polytetrafluoroethylene (PTFE) fiber. In addition, the disk ca be used under fast flow rate (150-200 ml min.
-1) (Hagen et al., 1993 ; Miura et al., 2000).
The aim of this study is to develop a rapid analytical method for Pu isotopes in
environmental samples using a 3M Empore
TManion exchange resin disk. The elution
behavior of Pu and the decontamination factors of Th, U and Am in the procedure of Pu
separation using the disk were investigated. The present method was applied to the
sediment) and the forest soil sample by alpha-ray spectrometry and high resolution ICP-MS.
The results obtained were compared with the literature values.
3.2. Experiment
3.2.1. Instruments for alpha-ray spectrometry
The silicon semiconductor detector, an ORTEC model 576A alpha spectrometer (with 450 mm
2active area) was used for alpha-ray measurement. Counting efficiencies were 20 to 30 %, and energy resolutions were 20-40 keV full width at the half-minimum peak height (FWHM) at 5.47 MeV of
243Am alpha-ray peak. Radioactivity measurement of
239+240Pu and
238Pu were calculated from the count ratios of
239+240Pu and
238Pu to
242Pu, which was added as a yield tracer. The detection limit of Pu by alpha-ray spectrometry was 1 mBq/sample, based on the three times counting statistics for a counting time of 70,000 s.
3.2.2. Instruments for mass spectrometry
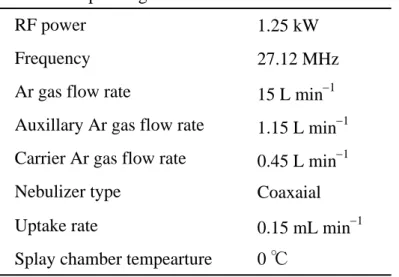
A sector field double focusing high resolution inductively coupled plasma mass spectrometer (HR-ICP-MS), model JMS-PLASMAX2 (Japan Electron Optics Laboratory, Tokyo, Japan) was applied for the measurement of Pu isotopes. After chemical separation and purification of Pu, the sample solution was introduced into the HR-ICP-MS through CETAC ultrasonic nebulizer, model U-5000AT
+(CETAC Technologies, Toms River, USA). The operating conditions are summarized in Table 3.1. The concentrations of Pu isotopes, especially
239Pu and
240Pu, in the sample solution were determined from the peak abundance ratios of m/z 239 and 240 to 242, which was added as a yield tracer of known amounts of
242
Pu, on the basis of the isotope dilution method.
The detection limit of Pu in sample solution by HR-ICP-MS measurement estimated to be
21 fg ml
-1(
239Pu: 0.05 mBq ml
-1,
240Pu: 0.18 mBq ml
-1), based on standard deviation at three
238
U
1H
+ions and up-mass tailing of
238U
+at the mass m/z 239, the mass m/z 238 was measured.
3.2.3. Anion exchange resin disk
Anion exchange resin disk, an Empore
TManion exchange-SR resin disk was obtained from the 3M Company (St. Paul, USA). Specifications of the disk is 47 mm diameter, 0.5 mm thickness, 90 wt.% resin particle and 10 wt.% fibrillated polytetrafluoroethylene (PTFE), styrenedivinylbenzene copolymer resin, strongly basic quaternary ammonium functional group, 350 m
2g
-1surface area, 12 micrometer average particle size, >0.2 mEq per disk exchange capacity. The disk was successively washed with 10 ml of methanol, 50 ml of pure water, 20 ml of 1M HCl, 50 ml of pure water, and finally with 20 ml of 8M HNO
3to convert the NO
3-form.
3.2.4. Apparatus, reagents and standard solutions
The 47 mm glass filtering apparatus provided from 3M and triple-stage extraction manifold assembly was used for solid phase extraction procedures. The aspirator, model Shibata WJ-15 was used for vacuum source. Gelman Science polysulfone filtering funnels (200 ml capacity), a polysulfone filter holder, a polysulfone support screen and SUPOR
TMmembrane filter (polysulfone, 25 mm diameter, 0.1 micrometer pore size) were applied for preparation of alpha-ray counting using NdF
3coprecipitation method.
All reagents used were of reagent grades. Pure water was purified with Milli-Q plus (Japan Millipore Ltd., Shinagawa, Japan). The ultra pure nitric acid used for preparing the final solution for HR-ICP-MS measurement was of super analytical grade reagent Tamapure AA-100, provided from Tama Chemical Ltd., Japan.
The
242Pu standard solution, SRM-4334E, supplied by National Institute of Standard and
approximately 20 mBq ml
-1in 7M HNO
3, and stored in the Teflon bottle. The thorium and uranium standard solution were prepared from Th(NO
3)
4·4H
2O and UO
2(NO
3)
2·4H
2O reagent provided from Merck Inc. The solution was standardized by gravimetric techniques. The
243
Am standard solution was obtained from Isotope Products Laboratories (Burbank, USA).
The
239+240Pu solution was prepared from 10 g of sea sediment reference material, IAEA-135 certified reference material (Irish Sea sediment) by HNO
3leaching and purified with anion exchange resin column method. The concentration of
239+240Pu in the solution was determined with alpha-ray spectrometry.
3.2.5. Determination of the decontamination factors
Decontamination factor (DF) through the chemical separation procedure was determined by using following equation;
added sample
DF C
= C
where C
addedis added amount of ion to the sample, C
sampleis measured amount of ion after separation of interference elements (Th, U and Am) in the anion exchange resin disk separation procedure.
3.2.6. Measurement of the elution behavior of Pu in the procedure
A known amount of
239+240Pu in 8M HNO
3-0.03M NaNO
2sample solution (100 ml volume) was prepared using the 20 ml of the
239+240Pu standard solution. The solution was treated with the procedure using a 3M Empore
TManion exchange resin disk. All of the fractions were stored and
239+240Pu was measured in those fractions with HR-ICP-MS.
3.2.7. Building of chemical separation procedure
The recommended chemical separation procedure consists of following three steps; (1)
(3) coprecipitation of Pu with NdF
3and alpha-ray spectrometry, or measurement of Pu with HR-ICP-MS.
An aliquot of 0.5-1.0 g sample was weighed for analysis. If the sample amount is up to 5 g, the sample was ashed at 500 ˚C for 2-4 hours. The sample was leached with 8M HNO
3at 180
˚C for 2 hours after a spiked about 30 mBq of
242Pu as a yield tracer. The sample was cooled down to 50 ˚C, the insoluble substance was filtered. The filtrate was then adjusted to 200 ml of 8M HNO
3-0.03M NaNO
2solution to keep Pu in tetravalent chemical state (Keder et al., 1960; Rao and Cooper, 1995).
The sample solution was passed through the 3M Empore
TManion exchange resin disk for adsorption of Pu(IV) at flow rate of 150-200 ml min.
-1under vacuum conditions. After the disk was washed with 10 ml of 8M HNO
3(5 ml × 2) and 12 ml of 9M HCl (4 ml × 3), Pu(IV) on the disk was then reduced to Pu(III) and eluted with 15 ml of 1M HNO
3-0.03M ascorbic acid solution (3 ml × 5).
In the preparation of counting sample, Pu was coprecipitated with NdF
3precipitation according the procedure reported by Rao and Cooper (1995). The Pu fraction was evaporating to dryness and the organic compounds were decomposed with a few ml of HNO
3and HClO
4. After the decomposition, the residues were dissolved with 10 ml of 1M HCl-0.03M ascorbic acid solution containing 0.1 mg amount of Nd
3+. Neodymium fluoride was precipitated by addition of a one ml of HF. The solution was allowed to stand for 30 minutes and filtered with a SUPOR
TMmembrane filter under vacuum conditions. The filter was removed and dried at 105 ˚C for 30 minutes. Subsequently, the filter was mounted on a stainless steel disk (25 mm diameter) using a double-side adhesive tape. The mounted sample was counted for 70,000 s by alpha-ray spectrometry.
For HR-ICP-MS measurements, the Pu fraction was evaporated to dryness and the organic
matter were decomposed with a few ml of HNO
3. After decomposition, the residue was
by HR-ICP-MS.
3.3. Results and discussion
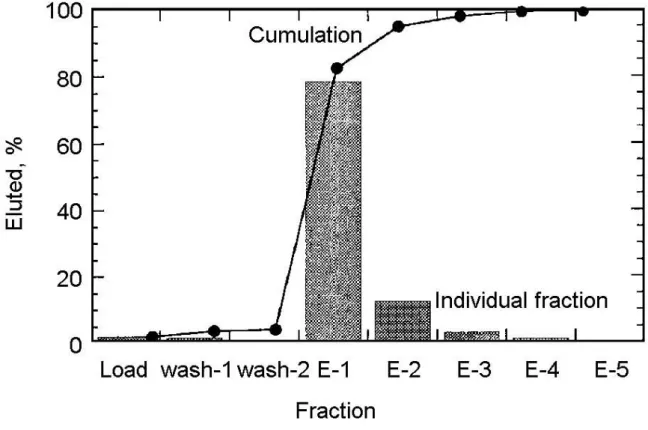
3.3.1. Elution behavior of Pu and the decontamination factor of interference elements
The elution behavior of Pu is presented in Fig. 3.1. It was found that tetravalent state Pu was quantitatively adsorbed on the Empore
TManion exchange resin disk even at the high flow rate, 150-200 ml min.
-1. Chemical recovery of Pu in this procedure was found to be 90-97%.
According to the procedure, plutonium in the sample solution can be separated from the other matrix elements within 20 minutes. Decontamination factors of Th, U and Am were 4.4×10
2, 6.6×10
3and 2.1×10
3, respectively. These results showed that the anion exchange resin disk is useful for chemical separation of Pu in environmental samples because it gives rapid and large volume successive separation and enough decontamination capabilities.
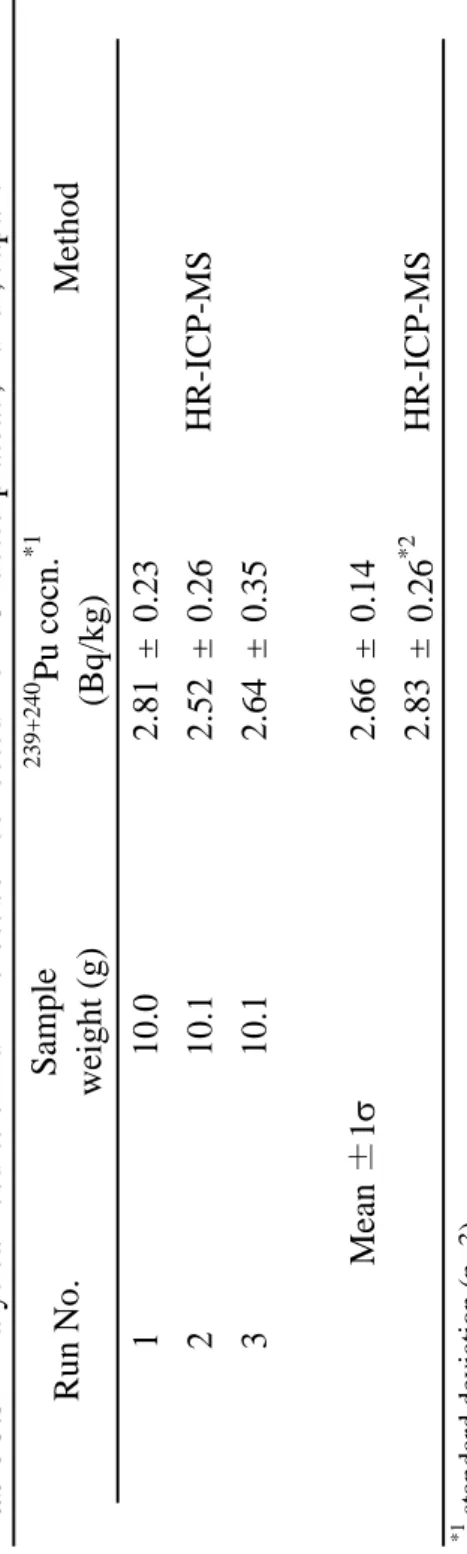
3.3.2. Application to environmental samples
A certified reference material, IAEA-135 Irish Sea sediment was analyzed in order to examine the reproducibility and accuracy of the present method. The concentration of Pu isotopes in IAEA-135 reference material was determined by alpha-ray spectrometry and HR-ICP-MS after chemical separation method mentioned above. The analytical results are summarized in Table 3.2, together with recommended and literature values, chemical recovery, mean and standard deviations. Mean concentration values of
239+240Pu and
238Pu were in well agreement with the recommended values within statistics, and high chemical recovery (70-83%). Atomic ratio of
240Pu/
239Pu was 0.23±0.04, which is comparable with the ratio (0.211±0.004) reported by Muramatsu et al. (1999).
We also applied the method to environmental soil sample. The sample was collected from a
forest in Fukui prefecture, Hokuriku region, Japan. Analytical results were comparable to the
shown in Table 3.3.
3.4. Conclusions
From the results of present studies, it was found that Pu was quantitatively extracted with the anion exchange resin disk at high flow rate of 150-200 ml min.
-1. These results showed that Pu could be rapidly, effectively and easily separated from other interfere elements such as Th, U and Am by using anion exchange resin disk. The time needed to separate Pu from other interfere elements in environmental samples by the present method was only 20 minutes. The operation time of chemical separation of the present method is less than for the method using an anion exchange resin column, extraction chromatographic resin cartridge and solvent extraction. Measurement time of Pu isotopes are 70000 s for alpha-ray spectrometry, 10-20 min. for HR-ICP-MS. The combination of Pu separation by Empore
TManion exchange resin disk and the measurement by HR-ICP-MS is more rapid than the alpha-ray spectrometry.
After the preparation of load solution, the concentration of Pu could be determined with HR-ICP-MS in less than 2 hours. Using a 10 g sample, the detection limits of
239+240Pu and
238
Pu are 0.1 mBq g
-1by alpha-ray spectrometry, and those of
239Pu and
240Pu are 0.1 and 0.36
mBq g
-1by HR-ICP-MS, respectively.
Fig. 3.1 Elusion behavior of Pu with 3M Empore
TManion exchange resin disk. Disk: 3M
Empore anion exchange-SR, 47 mmφ.
239+240Pu: 200 mBq. Effluent: Load; 8M HNO
3-0.03M
NaNO
2200ml, wash-1; 8M HNO
315ml (5ml × 3), wash-2; 10M HCl 12ml (3ml × 4), E-1 ~ 5; 1M
HNO
3-0.03M ascorbic acid 15ml (3ml × 5). Instrument: JEOL JMS-PLASMAX2 high resolution
ICP-MS.
RF power 1.2 kW Plasma gas flow rate 14 L/min.
Auxiliary gas flow rate 0.3 L/min.
Nebulizer gas flow rate 1.0 L/min.
Mass analyzer
Acceleration voltage 6.0 kV
Mass resolution M/ΔM= 500
Data acquisition
Mass range (m /z ) 238 (
238U), 239 (
239Pu) 240 (
240Pu), 242 (
242Pu)
Dwell time 6000 ms/channel
Number of sweeps 10
Number of replicates 3 Ultrasonic nebulizer
Solution uptake rate 1.2 mL/min.
Heater temperature 140 ℃ Condenser cooling temperatur 3 ℃
Table 3.1 Operating conditions of HR-ICP-MS (PLASMAX2).
Sample weight (g) Recovery (%) Method 1.12 83 190 ± 14
*1-4 0 ± 3.4
*11.16 70 200 ± 17
*1-4 5 ± 4.2
*11.00 79 190 ± 15
*1-4 3 ± 3.8
*10.503 n.d.
*2240 ± 19
*30.255 ± 0.05 - 0.503 n.d.
*2220 ± 13
*30.195 ± 0.05 - 210 ± 22 42 ± 2.7
*30.211 ± 0.004 ICP-MS
ated counting statistics*4
alpha-ray spectrometry HR-ICP-MS 213 43
239+240
Pu cocn. (Bq/kg)
240
Pu/
239Pu atomic ratio
238