Introduction
Conventional functional MRI(fMRI)measures the magnetic susceptibility at a single time point using single-echo gradient echo(GE)-echo-planar imaging(EPI), which generates a response that is proportional to the susceptibility at an echo time(TE). In contrast, multi-echo EPI uses multiple acquisition points to obtain signals from different echoes [1-5]. This can produce information related to the magnetic susceptibility profiles at different TEs.
A previous study [ 4 ] used three-echo images to remove artifacts from fMRI signals, in which independent component analysis was applied to the separately estimated signals depending on proton density(S 0 )and transverse relaxivity(R 2 *). Another study [ 5 ] used three-echo images to estimate the linearity of R 2 * for functional activation to obtain microscopic neuronal changes depending on the difference in stimulus. Both these cases require accurate calculations to estimate R 2 * and to reduce calculation errors originating from noises/artifacts.
In this study, the motion effects on different echo images were examined. A motion trajectory could appear differently depending on TE in a region with high susceptibility, especially in the boundary regions. The motion effects on the images were estimated, and methods to reduce these effects were determined.
原 著 論 文
Evaluation of head motion effects in the processing of multi-echo magnetic resonance imaging data
SUNG Yul-Wan, KAWACHI Yousuke, OGAWA Seiji
Kansei Fukushi Research Institute, Tohoku Fukushi University
Abstract
Multi-echo planar imaging is a magnetic resonance imaging(MRI)sequence with which MRI images can be acquired at different echo-times after excitation. This sequence is applied to functional MRI(fMRI)
for the removal of non-functional signal artifacts. Another application of this sequence for fMRI involves estimation of information to supplement the functional information by typical fMRI for the creation of a functional brain map. In a previous study, we proposed a novel method by which microscopic neuronal changes originating from population differences could be detected. Multi-echo planar imaging can be problematic due to artifacts caused by magnetic susceptibility in the boundary regions between the brain tissues and other brain compartments. This occurs because of different transverse relaxation times.
In this study, we examined the way head motion affects signals acquired at different echo-times by multi- echo planar imaging. It was found that the motion signal patterns were slightly different between two images with different echo-times. We devised a method to remove this discrepancy, which was successfully applied.
Keywords : multi-echo EPI, functional MRI, artifacts
Materials and Methods
This study was approved by the Institutional Review Board of the Tohoku Fukushi University.
Measurements and Data Analysis
All MRI experiments were performed using a Skyra-fit system(Siemens, Germany)with a standard 16-channel head matrix coil operating at 3 T. A multi-echo GE-EPI sequence from the Center for Magnetic Resonance Research of Minnesota University was used to acquire images at two TEs of 21.61 and 33.24 ms. For functional imaging, the multi-echo GE-EPI sequence was used with a 250 ms repetition time, a 220 mm field of view, a 64 × 64 mm matrix size, and a 5 mm slice thickness with zero acceleration. To account for motion correction, multiple slices were acquired. However, only one slice was used for data analysis. Four slices covering the visual to parietal region were acquired from a healthy volunteer. The 1440 volume images were acquired while the subject’s eyes were closed. Brain Voyager QX(Brain Innovation B.V., Postbus, The Netherlands)software and MATLAB(Mathworks Co., Natick, MA)software were used for fMRI data processing. Three-dimensional motion correction was performed for three-echo images by Brain Voyager QX, and the following analyses were performed by MATLAB.
Results and Discussion
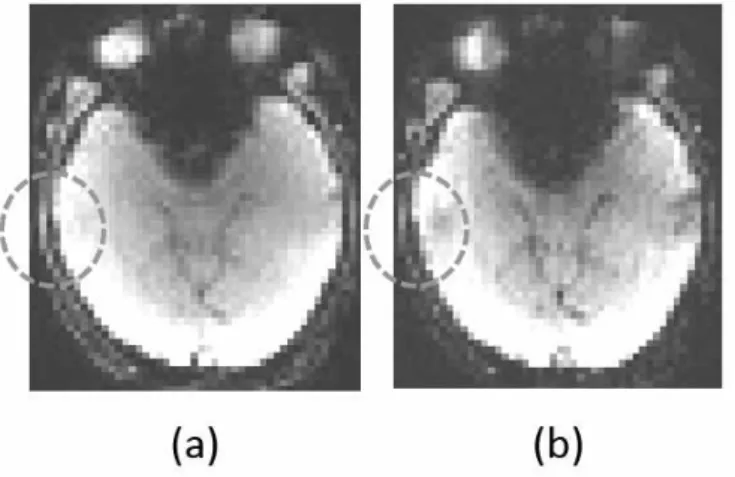
Acquired images during the first echo(TE 1 )and the second echo(TE 2 )are shown in Figure 1.
The region circled by a dotted line represents signal decay depending on susceptibility.
Two-image motion correction was performed, and the motion trajectories were obtained. Figures 2 and 3 show the motion trajectories estimated by the motion correction for each echo image.
Figure 1. Images at three echoes:(a)image at TE 1 and(b)image at TE2. The dotted circle indicates a region that represents signal decay while TE increases.
Ideally, the motion trajectories should be completely identical between the two echo images, because the difference between them is only the acquisition time point. However, the correlation between these trajectories is not identical. The correlation coefficients between the two images are as follows:
(Translation X): r = 0.9448, p < 10−37;(Translation Y): r = 0.9808, p < 10−110;(Translation Z): r = 0.9632, p < 10−106;(Rotation X): r = 0.8729, p < 10 × 10−61;(Rotation Y): r = 0.9293, p < 10 × 10−63;
(Rotation Z): r = 0.8109, p < 10 × 10−28. The correlation between the two images at the rotational axis Z was the poorest. To correct for the discrepancy, a method was created in which two sets of six motion trajectories were regressed. To evaluate the effect of the discrepancy on the fMRI signal, the TE 1 and TE 2 signals were decomposed by the singular value decomposition(SVD)method [ 6 ].
The decomposed components of TE 1 and TE 2 were compared before and after the motion trajectories were regressed out. The improvement in this discrepancy removal by comparing the number of principal components with high correlation values(higher than 0.6)between TE 1 and TE 2 was evaluated. The first to sixth principal components were found to have higher correlation
Figure 2. Motion trajectories for the first echo image.
Figure 3. Motion trajectories for the second echo image.
values than 0.6 for signals after the regression-out of motion trajectories; however, for signals before the regression-out, only the first to third principal components were found to have higher correlation values. In addition, the first and second principal components were compared before and after the regression-out. Figure 4 shows the time courses of the first component, and Figure 5 shows the time courses of the second component. The dotted circle and rectangle of these figures show the increased similarity after removal of all the motion trajectories from each image.
The results demonstrate that the images acquired at different TEs have different motion trajectories, and the discrepancy can cause errors in calculating R 2 *. In addition, the approach discussed in this article to reduce the discrepancy is effective. The degree of discrepancy can appear differently depending on the brain regions and motion. This proposed approach would be more useful in cases of images having larger motion, although the present images did not show much motion.
Acknowledgement
This study was carried out as a part of the cooperative research project at the Kansei Research Figure 4. Time courses of the first SVD components.
Figure 5. Time courses of the second SVD components.
Institute of Tohoku Fukushi University, receiving a subsidy of the research facility operation support MEXT, and JSPS KAKENHI Grant Number 17K01993 & 19H00532 .
References
1 ) Beissner F, Baudrexel S, Volz S, Deichmann R. Dual-echo EPI for non-equilibrium fMRI - implications of different echo combinations and masking procedures. Neuroimage 2010; 52: 524-31.
2 ) Glover GH, Lemieux SK, Drangova M, Pauly JM. Decomposition of inflow and blood oxygen level- dependent(BOLD)effects with dual-echo spiral gradient-recalled echo(GRE)fMRI. Magn Reson Med 1996; 35: 299-308.
3 ) Speck O, Hennig J. Functional imaging by Io- and T 2 * -parameter mapping using multi-image EPI.
Magn Reson Med 1998; 40: 243-248.
4 ) Kundu P, Inati SJ, Evans JW, Luh W-M, Bandettini PA. Differentiating BOLD signals in fMRI time series using multi-echo EPI. Neuroimage 2012; 60: 1759-70.
5 ) Kang D., Choi U-K., Sung Y-W.: Microscopic functional specificity can be predicted from fMRI signals in ventral visual areas. Magnetic Resonance Imaging 32: pp. 1031-1036, 2014
6 ) Golub, G. H.; Reinsch, C.: Singular value decomposition and least squares solutions. Numerische Mathematik. 14: pp.403-420, 1970.