Dosimetry and Spectrometry of Cosmic-ray Neutrons in Aircraft
(DOSCONA Experiment)
Takashi Nakamura, Hiroshi Yasuda, Masashi Takada, Kazuaki Yajima, Tatsuhiko Sato, Toru Fujishima
2011
年
12月
December 2011(独)
放射線医学総合研究所
〒263-8555 千葉市稲毛区穴川
4-9-1National Institute of Radiological Sciences
9-1 Anagawa 4-chome, Inage-ku, Chiba 263-8555, JAPAN NIRS
HIMAC
NIRS-R-63 HIMAC-135 ISBN 978-4-938987-73-2
Dosimetry and Spectrometry of Cosmic-ray Neutrons in Aircraft (DOSCONA Experiment)
NIRS-R-63 HIMAC-135
ISBN 978-4-938987-73-2 Contents:
1. Introduction. 2. Aim of this study. 3. Materials and Methods.
4. Results and Discussion. 5. Summary.
Includes bibliographical references.
Appendix A. Research Outputs related to the Present Study.
Appendix B. Summary in Japanese
Copyright © National Institute of Radiological Sciences 2011
All rights reserved. No part of this publication may be reproduced in any form or by any means without written permission from the copyright owner.
Preface
This report presents the results of in-flight measurements and related studies that were supported in part by the "Ground-based Research Program for Space Utilization" promoted by Japan Space Forum (JSF) and organized by the Japan Aerospace Exploration Agency (JAXA).
The core members of this study, as listed below, are responsible for the contents of this report as authors.
Takashi Nakamura
Cyclotron and Radioisotope Center, Tohoku University, Sendai Japan
Hiroshi Yasuda
National Institute of Radiological Sciences, Chiba, Japan
Masashi Takada*
National Institute of Radiological Sciences, Chiba, Japan
Kazuaki Yajima
National Institute of Radiological Sciences, Chiba, Japan
Tatsuhiko Sato
Japan Atomic Energy Agency, Ibaraki, Japan
Toru Fujishima
Japan Space Forum, Otemachi, Japan
*For correspondence ([email protected])
Abstract
Exact information on the cosmic-ray environment in spacecraft and aircraft are important for radiological protection of astronauts and aircraft crew. They are exposed to various types of primary and secondary cosmic-ray particles having the broad energy ranges. These particles could react in complicated manners inside a crew body and such reactions at deep organs would bring some critical adverse effects on the crew’s health. To discuss this risk, it is necessary to know the accurate energy spectra and its spatial distribution of each species of cosmic-ray particles, particularly penetrating components such as high-energy neutrons which occupy a considerable fraction of total dose. It is very difficult, however, to precisely measure the neutrons with energies greater than 10-20 MeV because they are mixed with and hardly separated from co-existing particles such as protons and muons in the thin atmospheric environment.
Under these circumferences, we repeated in-flight measurements of cosmic-ray neutrons onboard a business jet aircraft near Japan from 2006 to 2008, during the solar minimum. The onboard experiments were supported as the 8th Ground-based Research Program for Space Utilization promoted by Japan Space Forum; this program was operated with a financial support of Japan Aerospace Exploration Agency (JAXA). The experimental flights were operated by Diamond Air Service Inc.
For cosmic-ray neutron measurements, we employed several neutron monitors including an original, newly developed neutron spectrometer. The spectrometer probe is a phoswich-type scintillation detector and can measure a high-energy neutron spectrum from 10 MeV to about 200 MeV, by separating well from cosmic-ray protons and others. It was an important object of this study to verify the effectiveness of this spectrometer at high altitude.
As results of the onboard measurements using selected rem counters, it was verified that cosmic-ray neutron doses can be successfully determined by numerical model simulations using the PHITS-based analytical model (PARMA). Also, it was confirmed that the new spectrometer works well for the determination of cosmic-ray neutron spectrum in the energy range from 10 to 200 MeV. The obtained spectrum of the high-energy neutrons was well connected with that of the low-to-middle energy neutrons (<15 MeV) evaluated with the Bonner ball neutron spectrometer. This is the first successful onboard experiment in which energy spectrum of neutrons with a wide energy range from thermal to about 200 MeV was presented with high energy resolution.
The obtained peak of the high-energy neutrons, however, appeared around 70 MeV which is considerably lower than those (about 100 MeV) reported in previous Bonner ball measurements, though this result agrees well with the neutron spectra measured with organic liquid scintillator on the ground and with double-scatter neutron telescope at the top of atmosphere. Though this discrepancy was discussed in comparison with model simulations in the present study, further discussion is strongly required by performing onboard long-haul flight measurements at high geomagnetic latitude. After such sufficient verification, tests on the International Space Station are desirable with developing a more sophisticated instruments regarding safety, energy efficiency and transportability.
Contents
1. Introduction...1
2. Aim of this study...2
3. Materials and Methods...3
3-1. Detectors...3
3-1-1. Neutron Rem Counters...3
3-1-2. DARWIN...4
3-1-3. BBND...7
3-1-4. Phoswich Detector / CREPAS...9
3-2. Flight Conditions ...23
3-3. Radiation Model in the Atmosphere ...25
4. Results and Discussion ...27
4-1. Experimental Results...27
4-1-1. Neutron Rem Monitors...27
4-1-2. DARWIN...32
4-1-3. BBND...34
4-1-4. Phoswich Detector / CREPAS...36
4-2. Comparison with Model Predictions ...40
4-2-1. Low to middle energy neutrons...40
4-2-2. High energy neutrons ...45
5. Summary...48
5-1. Conclusion...48
5-2. Perspectives ...48
Acknowledgements...49
References...50
Research Outputs related to the Present Study ...55
和文要約(Summary in Japanese)...58
1. Introduction
When primary cosmic rays consisting of galactic cosmic rays and solar particles come into the earth’s atmosphere, secondary neutrons generated through nuclear cascade reactions with atmospheric atoms reach the ground. Over the past 10 years, there has been increasing concern about the exposure of aircraft crew to atmospheric cosmic radiation. At aviation altitudes of commercial jet aircrafts (around 11 km), cosmic-ray neutrons contribute about half of effective dose.
Whereas, dense accumulation of the semiconductor device greatly increases and the soft-errors of SRAM and DRAM on the ground level caused by high-energy cosmic-ray neutrons become a serious problem in the world (Nakamura et al. 2008). Under these circumstances, many neutron measurements onboard aircrafts and on the ground at different elevations have been carried out in Europe and North America (Schrewe 2000, Lewis et al. 2001, 2004; Goldhagen et al. 2002; EURADOS 2004), mainly at high geomagnetic latitudes. At low geomagnetic latitude, however, a few measurements have been successfully done onboard an aircraft over Japan (e.g. Nakamura et al. 1987). These measurements were all performed with a multi-moderator spectrometer, so-called ‘Bonner ball detector’, or a dose equivalent counter, so-called ‘rem counter’. The Bonner ball detector has been widely used for neutron spectrometry due to its simple responses covering a certain energy range of neutrons from thermal to several MeV. Its energy resolution is not good, however, especially in the high energy region above 10 MeV; the energy spectrum in this region is strongly dependent on the initial guess spectrum. Regarding a rem counter, its simple handling feature and transportability are preferable for use in aircraft though it only gives a value of neutron ambient dose equivalent.
With expanding human space activities, precise neutron measurements are becoming important for radiological protection of astronauts. Most of the neutrons are produced from primary cosmic-ray charged particles passing through a space vehicle including wall, equipments, luggage, fuel, water and so on. But, it is very difficult to measure neutrons selectively in spacecraft where various radiation particles such as neutrons, protons, muons, pions, electrons and photons having wide energy ranges are mixed. There have been only a few measurements of neutron spectra below about 10 MeV with the Bonner ball neutron detectors (BBND) which was fabricated by the National Space Development Agency (NASDA, now JAXA: Japan Aerospace Exploration Agency). Using this system, Matsumoto et al. (2001) measured the neutron energy spectrum in the Space Shuttle in the 8th Shuttle-Mir mission (S/MM-08/STS-89) from January 24 to 28, 1998. A similar type of this Bonner ball detector was also used in the US module of ISS (International Space Station) flying at about 400 km in altitude to measure neutron dose from March 23 to July 6, 2001 (Koshiishi et al. 2007).
Contribution of high-energy neutrons (> 10 MeV), however, is still uncertain and to be desirably
verified in future missions.
The energetic neutrons can penetrate deep into a crew body and could react in complicated ways at deep organs, which would bring some critical effects on the crew’s health. To discuss this effect, it is necessary to know the accurate energy spectra and its spatial distribution of high-energy neutrons. It is very difficult, however, to precisely measure energetic neutrons in spacecraft or aircraft because they are mixed with and hardly separated from co-existing protons at high altitude. It is now desirable to verify the energy spectrum of neutrons with energies greater than 10 MeV by measurements with an advanced neutron spectrometer which can detect high-energy neutrons selectively and precisely.
2. Aim of this study
Under this circumference, we employed several neutron detectors including a newly developed original spectrometer to know the contribution of high-energy neutrons to cosmic radiation doses in spacecraft and aircraft. The detectors include neutron rem counters, liquid scintillation detector, Bonner-ball neutron detector and an original phoswich-type neutron spectrometer which is designed to measure high-energy neutron spectrum over 10 MeV up to a few 100 MeV selectively, separated from co-existing protons and other cosmic-ray particles. It is one of the important objects in this study to verify the effectiveness of this spectrometer at high altitude.
We had already made a phoswich-type scintillation detector composed of slow-decay plastic scintillator (NE115) and fast-decay liquid scintillator (NE213) (Takada et al, 1998, 2001, 2002, 2004, Takada and Nakamura 2007). Thick xylene-based liquid scintillator, NE213, having high sensitivity to neutral particles was surrounded by a thin plastic scintillator which should have a low sensitivity to neutrons. Charged particles are detected well by both scintillators.
For loading on a flying vehicle, however, the xylene solvent of the liquid scintillator was not preferable because of its toxicity and flammability. We thus tried to change the inner scintillator to lower toxic one. To obtain neutron energy spectrum on site, we developed an original data acquisition unit converting analog data of scintillation signals to digital data with 2ns intervals. Also, we developed a software program to display the optional signal integrals as two-dimensional plots on PC for particle discrimination and to analyze the energy spectrum from the selected data. This analyzing system designed exclusively for a scintillation detector is named by the authors as CREPAS (Cosmic Radiation and Energetic Particle Analyzing System).
Furthermore, by combination of CREPAS and Bonner ball detector, we expect to obtain a whole energy spectrum of cosmic-ray neutrons in space and aviation.
3. Materials and Methods
In this section, detector specifications, flight experiment conditions and the features of atmospheric radiation models are described. We employed several radiation instruments for cosmic-ray neutron measurements at high altitude. They were installed in a business jet aircraft and flown around the middle part of Japan. The results obtained were compared to numerical simulations using a newly developed analytical model based on the Monte Carlo simulations.
3-1. Detectors
3-1-1. Neutron Rem Counters
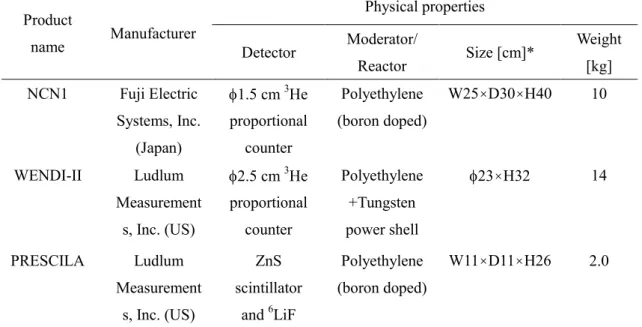
Three commercial products of neutron rem counter were chosen for in-flight measurements of 1 cm ambient dose equivalent, H*(10): (1) a conventional moderating rem meter composed of a 5.1 cm-diam 3He proportional counter and a 25 cm-diam polyethylene sphere (NCN1, Fuji Electronics Systems), (2) an extended energy-range rem meter of a 3He counter with a tungsten powder shell (WENDI-II, Ludlum Measurements Inc.) and (3) a proton-recoil scintillation rem meter of ZnS phosphor with 6Li (PRESCILA, Ludlum Measurements Inc.). All these monitors are commercially available and transportable. The major physical properties of these monitors are summarized in Table 3.1.1.1. As to the NCN1 and WENDI-II, the H*(10) value is determined by multiplying a constant conversion coefficient and pulse counts generated from the 3He(n,α)Li reaction with thermalized neutrons. The dose value of the PRESCILA is determined from signal counts of recoil protons generated by incident energetic neutrons in the ZnS scintillator. Threshold setting for n/γ discrimination was given as a default, and low sensitivity to photons was confirmed using 60Co and 137Cs gamma-ray sources. Detailed dosimetric properties regarding the NCN1 have been introduced by Nakane et al. (2004) and those for the WENDI-II and PRESCILA have been reported by Olsher et al. (2000, 2004, 2008).
The data of the NCN1 were recorded to an original data logger developed by the authors and those of the WENDI-II and PRESCILA were saved to a commercial data logger (Model 2350-1, Ludlum Measurements Inc.).
Pulse counts recorded in the data loggers were read out to a personal computer after landing and they were converted to H*(10) values using constant conversion coefficients that had already been given for each detector according to calibration results obtained by the authors using 241Am-Be source neutrons and 65 MeV p-7Li neutrons produced in the cyclotron of Tohoku University, Japan. The obtained H*(10) values were compared to predicted neutron doses obtained with a PHITS-based analytical model “PARMA” (Sato et al. 2008) which will be explained in the section 3-3.
Table 3.1.1.1 Major physical properties of the three neutron monitors used in the present study.
Physical properties Product
name Manufacturer
Detector Moderator/
Reactor Size [cm]* Weight
[kg]
NCN1 Fuji Electric
Systems, Inc.
(Japan)
φ1.5 cm 3He proportional
counter
Polyethylene (boron doped)
W25×D30×H40 10
WENDI-II Ludlum
Measurement s, Inc. (US)
φ2.5 cm 3He proportional
counter
Polyethylene +Tungsten power shell
φ23×H32 14
PRESCILA Ludlum
Measurement s, Inc. (US)
ZnS scintillator
and 6LiF
Polyethylene (boron doped)
W11×D11×H26 2.0
*The NCN1 was connected to an original data logger with a size of W8.0×D2.5×H12 cm3; the WENDI-II and the PRESCILA were connected to an exclusive data logger (Model 2350-1, Ludlum Measurements Inc.) with a size of W11×D22×H15 cm3 and a weight of 2.3 kg including batteries.
3-1-2. DARWIN
DARWIN, Dose monitoring system Applicable to various Radiations with WIde energy raNges, is composed of a scintillation detector which consists of layered scintillators and a data acquisition system. The detail features of DARWIN have been described in previous reports (Sato et al. 2005; 2007). DARWIN is designed to be used in monitoring doses in workspaces of high-energy accelerator facilities, and it cannot distinguish scintillations from protons and those from neutrons. Thus, we need to correct neutron dose values measured with DARWIN at flight altitudes by excluding the contamination induced by protons.
System
The schematic view of DARWIN is illustrated in Fig. 3.1.2.1. DARWIN is composed of [1] a phoswitch-type scintillation detector, which consists of liquid organic scintillator BC501A coupled with ZnS(Ag) scintillation sheets doped with 6Li, and [2] a data acquisition system based on a Digital-Storage-Oscilloscope (DSO). It is capable of measuring doses from neutrons, photons and muons with energy ranges from thermal energy to 1 GeV, 150 keV to 100 MeV, and
1 MeV to 100 GeV, respectively. Dose from neutrons below 1 keV is evaluated from the number of scintillations in the ZnS(Ag) sheets, while those from neutrons above 1 keV as well as photons and muons are estimated from the light outputs of scintillations from BC501A by applying the G-function method (Oyama et al. 1994) which directly relates the light output to the corresponding dose.
In this system, signals from the phoswitch detector were digitized by the analog-to-digital converters (ADCs) equipped in DSO, and stored in the memory allocated in ADC. The stored waveform data were transferred to the memory allocated in WindowsTM by every 1000 events, and analyzed by a Windows dynamic link library (DLL) driven by a LabVIEWTM program for determining the trigger particle type and the light outputs of the scintillations. In the waveform analysis, each scintillation was identified as that triggered by the incidence of neutron, photon and muon (hereafter referred to neutron, photon and muon scintillation, respectively) by means of the pulse shape and height discrimination (PSHD) technique (T. Sato et al. 2005). The neutron scintillations were further distinguished between those from the 6Li-doped ZnS(Ag) sheet stimulated by α particle produced by 6Li(n, α) reactions, and from the BC501A stimulated by proton, deuteron or α particle stopped in the detector produced by neutron-induced nuclear reactions. Signals from photon and muon scintillations were discriminated by their pulse heights, since their pulse shapes were almost identical to each other. In the pulse height discrimination, we assumed that scintillations with light outputs below and above 8 MeVee were regarded as the photon and muon scintillations, respectively. The obtained light output of each scintillation was converted to the corresponding dose in real-time by the LabVIEW program, applying the G-function method (Oyama et al. 1994).
6Li doped ZnS(Ag) sheet
BC501A 12.4φx 12.7 cm
glass cell
Photo-multiplier tube R4144, HAMAMATSU Al case
High voltage power supply (-1600V)
2 V ~ 0.1mV
~ 2 V
Digital Storage Oscilloscope Waverunner6100A, LeCroy
Anode signal
~ 0.1mV
ADC ADC
Channel 1 attenuator
Channel 2 attenuator
Channel 3 attenuator
Channel 4 attenuator Not used 6Li doped ZnS(Ag) sheet
BC501A 12.4φx 12.7 cm
glass cell
Photo-multiplier tube R4144, HAMAMATSU Al case
High voltage power supply (-1600V)
2 V ~ 0.1mV
~ 2 V
Digital Storage Oscilloscope Waverunner6100A, LeCroy
Anode signal
~ 0.1mV
ADC ADC
Channel 1 attenuator
Channel 2 attenuator
Channel 3 attenuator
Channel 4 attenuator 6Li doped ZnS(Ag) sheet
BC501A 12.4φx 12.7 cm
glass cell
Photo-multiplier tube R4144, HAMAMATSU Al case
High voltage power supply (-1600V)
2 V ~ 0.1mV
~ 2 V
Digital Storage Oscilloscope Waverunner6100A, LeCroy
Anode signal
~ 0.1mV
ADC ADC
Channel 1 attenuator
Channel 2 attenuator
Channel 3 attenuator
Channel 4 attenuator Not used
Fig.3.1.2.1. Schematic view of DARWIN.
Data Correction
The radiation fields at high altitudes, however, consist of not only neutron, photon and muon but also electron, positron and proton. When an electron or positron strikes into the detector, it creates a signal that is identified as photon or muon scintillation by PSHD. For scintillations
with the same light output, the corresponding doses estimated from the G-functions for the electron or positron are generally larger and smaller than those for the photon and muon, respectively, since the G-functions are significantly related to their fluence to dose conversion coefficients. Thus, electron or positron doses evaluated from the scintillations miss-identified as the photon and muon scintillations are underestimated and overestimated, respectively. In the total dose estimation, the error associated with this miss-identification is expected to be not so considerable – at most 15%, since the underestimation and overestimation cancel each other.
The scintillation triggered by the direct incidence of proton that stops in the detector is identified as the neutron scintillation by PSHD. This proton contamination should be excluded from the measured neutron dose rates. We therefore corrected the measured neutron dose rates by DARWIN, DM, by introducing a correction factor C as written by:
N
C M M
N P
D D C D d
d d
= = + , (1)
where DC denotes the corrected neutron dose rates, and dN and dP represent the neutron and stopped proton dose rates obtained from the G-function method, respectively. The numerical values of dN and dP can be estimated by
N N( , ) N( ) N( )d d d =∫∫R E L φ E G E E L
and
P P( , ) P( ) N( )d d
d =∫∫R E L φ E G E E L, (2) where RN and RP are the response functions of BC501A for neutron and proton with energy E and light output L, φ and φP are the neutron and proton spectra, respectively, and GN is the G-function for the neutron irradiation. Note that this correction is generally not necessary for dose monitoring in workspaces of high-energy accelerator facilities, since protons hardly exist in the radiation fields.
In the determination of the correction factor for the flight experiment, we adopted the response functions calculated by the SCINFUL-QMD code (D.Satoh et al. 2006) coupled with PHITS (Iwase et al. 2002), and the cosmic-ray spectra calculated by PARMA (T.Sato et al. 2008). It should be noted that the correction factor depends on the flight condition, and its maximum and minimum values are 0.94 and 0.91, respectively. The error associated with this correction is thus assumed to be at most several percents. In addition to this uncertainty, the experimental neutron dose rates also include the systematic error of approximately 10% due to the inadequate response of DARWIN to keV-order neutrons.
3-1-3. BBND
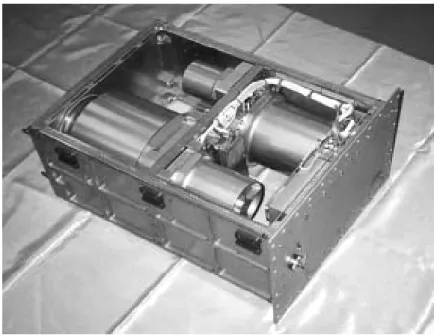
The Bonner Ball Neutron Detector (BBND) developed for use on board the International Space Station and the shuttle mission (Matsumoto et al. 2001; Koshiishi et al. 2007) was used for the cosmic-ray neutron energy spectrum measurement. It is a neutron spectrometer unit consisting of six Bonner-ball sensors, pre-amplifiers, analogue-to-digital converters, high-voltage power supplies, electrical circuits, an operation panel, data recording device and supporting equipment. We selected the BBND as a neutron spectrometer for this work because of its desirable features for our aircraft experiment, such as its simplicity of operation and solidity, coming from its original purpose of use in a space experiment.
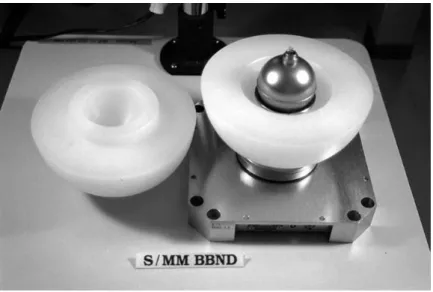
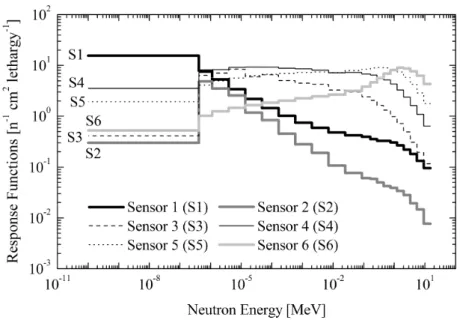
Figure 3.1.3.1 shows a photograph of a BBND sensor, and Fig. 3.1.3.2 shows an internal view of the BBND unit. The neutron detector of the BBND is a proportional counter, 5.1 cm in diameter, filled with 6.1 atm Helium-3 gas (3He counter). Sensor 1 is a bare 3He counter. Sensor 2 is a 3He counter covered with 1-mm-thick gadolinium. Sensor 3 is a 3He counter covered with a 1.5-cm-thick polyethylene sphere and 1-mm-thick gadolinium. Sensors 4, 5 and 6 are 3He counters covered with 3-, 5- and 9-cm-thick polyethylene spheres, respectively. The properties of Bonner ball sensors 1-6 installed in the BBND are listed in Table 3.1.3.1 and the energy response functions of each sensor are shown in Fig.3.1.3.3. More detailed information about the BBND is included in the paper of Matsumoto et al.(2001).
Fig. 3.1.3.1 Photos of BBND. (C) NASA/JAXA
Fig. 3.1.3.2 Internal view of the BBND unit. (C) NASA/JAXA
The maximum entropy deconvolution code MAXED (Reginatto and Goldhagen 1998; 1999;
Reginatto et al. 2002) was used for the unfolding code of this study (obtained as part of the UMG package). We input the response function of the BBND sensors (Bonner balls), the measured count rate of each sensor, the uncertainty of measured data and a default cosmic-ray neutron energy spectrum (default spectrum) calculated with PARMA into the MAXED program and obtained an unfolded neutron energy spectrum with the uncertainty of each energy bin.
Table 3.1.3.1 Major properties of BBND
Bonner-ball detector ID
Diameter [cm]
Polyethylene- sphere thickness [cm]
Notes
Sensor 1 5.1 bare 3He proportional counter
Sensor 2 5.1 covered with 1-mm-thick Gd
Sensor 3 8.1 1.5 covered with 1-mm-thick Gd
Sensor 4 11 3
Sensor 5 15 5
Sensor 6 23 9
Fig. 3.1.3.3 Response functions of BBND sensors. The values are given by Matsumoto et al. (2001).
3-1-4. Phoswich Detector / CREPAS
Specification
To measure the energy spectrum of high-energy cosmic-ray neutrons in the atmosphere, we have newly developed an original neutron spectrometer with signal processing instruments (Takada et al 2010 former). The detector consists of an EJ309 organic liquid scintillator of 12.17 cm in diameter and 12.17 cm long covered with 15mm-thick EJ299-13 plastic scintillators as shown in Fig. 3.1.4.1. Both types of scintillators were fabricated by ELJEN Technology, TX, USA. The liquid scintillator can measure 1 to 180 MeV neutrons and 1 to 50 MeV photons. The outer plastic scintillator identifies incident charged particles. The properties of the EJ309 liquid scintillator are similar to those of the NE213 and BC501A scintillators. The densities and ratios of hydrogen and carbon atoms (H/C) of the EJ309 liquid and EJ299-13 plastic scintillators are 0.964 g/cm3 and 1.25, and 1.035 g/cm3 and 1.109, respectively. To allow long and safe onboard experiments, 2-mm-thick transparent acrylic liners are used between the inner and outer scintillators.
Fig. 3.1.4.1 A photo of the phoswich detector probe (above) and the schematic structure of phoswich neutron detector composed of an inner EJ309 organic liquid scintillator and an outer EJ299-13 plastic scintillator coupled to a photomultiplier XD-1374 (below).
Similar to the NE213 scintillator, the EJ309 liquid scintillator can discriminate neutrons and photons well. Both scintillators produce similar scintillations with decay times of 3.5 ns and 3.2 ns, respectively. In contrast, EJ299-13 produces scintillation with a longer decay time (285 ns) than that of the widely used NE102A plastic scintillator (2.4 ns). The fabricated scintillator is
coupled with a photomultiplier 120 mm in diameter (R1250, Hamamatsu Photonics K.K., Japan) via an acrylic light guide (C8H5O2 : ρ=0.95 g/cm3). The signal rise time, gain, and pulse linearity are reported by the manufacturer to be 2.5 ns, 1.4 ×10⁷, and 2% deviation up to 160 mA, respectively. The phoswich detector is operated at -1200 V to maintain light output linearity.
The entire detector is 19 cm in diameter and 57 cm long and it weights 10 kg.
Particle discrimination procedure
The phoswich detector can measure neutron and photon events separately by discriminating charged-particle events in the mixed radiation field. Non-charged particles of neutrons and photons deposit their energies mainly in the inner liquid scintillator. On the other hand, charged particles deposit their energies in both the inner liquid and outer plastic scintillators. Both scintillators emit scintillations with much different decay times: 3.5 ns for liquid and 285 ns for plastic. Signals of neutron and photon events are derived from only the liquid scintillator, but those from charged particles are the sum of scintillations from both the liquid and plastic scintillators. Signals from non-charged and charged particles therefore have small and large tail components, respectively, which enable the identification of incident particles (Fig.3.1.4.2).
Fig.3.1.4.2 Particle discrimination method using a phoswich neutron detector; (a) and (b) show signals, when neutron and proton are detected. Neutron produces shorter signals; while, proton longer signals.
The charge of the signal was integrated over three gates. The integrated charges from 10 ns
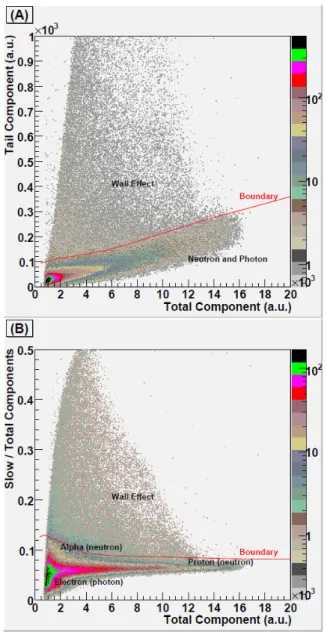
advanced to 200 ns delayed from the rise of signal are called the total component charge. The integrated charges from 60 to 200 ns delayed and from 200 to 400 ns delayed from the rise of signal are called the slow and tail components, respectively. Two dimensional plots of the total and tail components, and the total and the ratio of slow to total components (slow/total component) observed using quasi-monoenergetic neutron beams produced from 70 MeV p-Li reactions at the Cyclotron and Radioisotope Center (CYRIC), Tohoku University, are shown in Figs. 3.1.4.3 (A) and (B), respectively. Non-charged particle events of neutrons and photons were discriminated from charged particle events using the boundary as shown in (A), and the neutron events were discriminated from photon events using the boundary shown in (B). The secondary particles of protons, alpha particles and electrons generated by incident particles (neutrons and photons) are shown in (B).
Fig. 3.1.4.3 Two-dimensional particle discrimination plots of total and tail components
(A) and the total and the ratio of slow to total components (B) measured with quasi-monoenergetic neutron beams produced from a 70 MeV p-Li reaction at CYRIC. Secondary particles produced by neutrons and photons, wall-effect events, and boundaries for particle discrimination are drawn.
High-energy protons recoiled by neutrons can escape out of the inner liquid scintillator and be detected in the outer plastic scintillator. The escaped protons are identified as incident charged particles even if the neutrons are incident to the detector. Neutrons and photons detected at the outer scintillator are identified as charged particles incident to the detector.
Similarly, high-energy deuterons and helium-4 ions produced by neutrons, and photon-induced electrons that escape from the liquid scintillator are identified as charged particles. These events, shown in Fig. 3.1.4.3, are called wall effect events. The wall effect events were discriminated from neutron and photon events in the experiments. In the calculation, the wall effect is simulated by the coincidence of deposited energies in the inner liquid and outer plastic scintillators.
Neutron response functions
The neutron response functions of the phoswich detector were measured using a variety of quasi-monoenergetic neutron beams from 37 to 78 MeV at three cyclotron facilities, National Institute of Radiological Sciences (NIRS) (Honma 2007), CYRIC (Baba 2006) and the Takasaki Ion Accelerators for Advanced Radiation Application (TIARA) of the Japan Atomic Energy Agency (JAEA) (Baba et al. 1999). Quasi-monoenergetic neutron beams were produced by bombarding 40, 48, 70 and 80 MeV proton beams onto thin lithium targets with 2 MeV energy losses at NIRS and TIARA, and 5 MeV energy losses at CYRIC. Protons transmitted through the target without any reaction were diverted by a bending magnet into a beam dump. Neutrons in the 0 degree direction were guided to the experimental room through collimators at the CYRIC and TIARA neutron beam facilities. Scattered neutrons around the target chamber, and photons produced at the target and beam dump were measured and deemed to be negligible.
The quasi-monoenergetic neutron spectra were measured with the TOF method (Baba et al.
1999; 2006) as shown in Fig. 3.1.4.4. Neutron peak energies were measured to be 36.9, 46.0, 64.9 and 77.1 MeV for the 40, 48, 70 and 80 MeV p-Li reactions, respectively, with peak widths in FWHM from 2.4 to 6.1 MeV as shown in Table 3.1.4.1. The 64.9 MeV neutron peak at CYRIC was much larger and broader than the other peaks due to the usage of the thicker Li target. The spectra consist of a monoenergy peak due to the 7Li(p, n0,1) process and the continuum from the break-up process. Neutron fluxes in the continuum of quasi-monoenergetic neutron beams were almost half of the total neutron fluxes. The lowest neutron energies in the
TOF neutron measurements are limited by beam frequencies at each accelerator. The NIRS neutron energy spectra were measured with high cut-off energies, 15 and 35 MeV, for the 40 and 80 MeV p-Li neutron spectra, respectively, due to short beam intervals without beam chopping in the NIRS cyclotron.
Fig. 3.1.4.4 Quasi-monoenergetic neutron energy spectra produced by the bombardment with 40, 48, 70 and 80 MeV protons onto thin lithium targets at NIRS, TIARA (Baba et al. 1999) and CYRIC (Baba 2006).
Table 3.1.4.1 Characteristics of quasi-monoenergetic neutron beams used in measurements of response functions at NIRS, TIARA and CYRIC neutron irradiation facilities.
The absolute neutron flux measurement was done at the CYRIC neutron beams with high
accuracy. The angular neutron response functions were measured by rotating the neutron detector from 0 to 180 degrees with respect to the neutron beams since neutrons are incident to the detector from all directions in the experimental jet flights. The acquired signal waveform was analyzed later in a laboratory. Light outputs from the detector were calibrated using photon sources of 137Cs, 57Mn, 60Co, 22Na, and 4.4 MeV photons from 241Am-Be, and cosmic ray muons that were transmitted through the scintillator and created a 22 MeVee peak in light output.
The measured neutron response functions for the quasi-monoenergetic neutrons from the 70 MeV p-Li reaction were compared with the calculation in absolute values as shown in Fig.
3.1.4.5. In order to compare the shape of the response functions between the calculations and experiments, the measured response functions were normalized to the calculated results around the recoil-proton edges, which were calculated with high accuracy, within 5%. Good agreement was seen between the experimental and calculated absolute values, except at 90 degrees.
Fig. 3.1.4.5 Comparison of calculated and measured neutron response functions of quasi-monoenergetic neutrons from 70 MeV p-Li reaction for four incident angles: i.e., (A) 0, (B) 45, (C) 90 and (D) 180 degrees with respect to the cylindrical detector axis. Open circles and thin solid lines show the measured and calculated response functions in absolute values, respectively.
Filled circles show the measurement normalized to the calculation around the recoil-proton edges, indicated with arrows in (A).
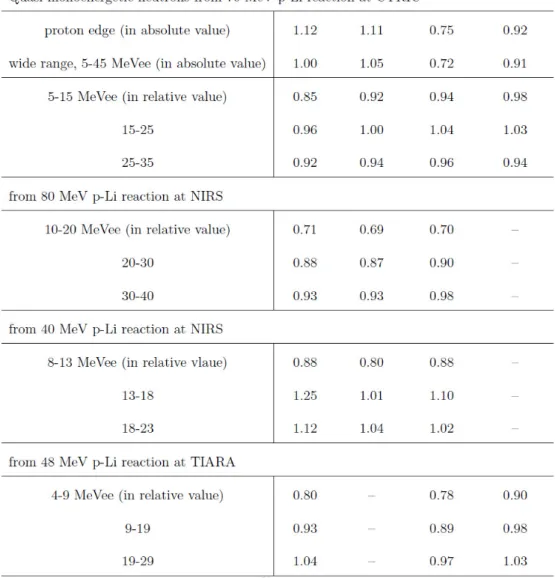
The ratios of calculated to measured response functions (C/E) are shown in Table 3.1.4.2.
This work showed that the response functions agreed with the measurements, within 12% in absolute values, except at 90 degrees. The difference between the calculations and measurements could be induced from the dark current in the measurement of beam current and the neutron energy spectrum measured for the CYRIC neutron beam.
Table 3.1.4.2 Ratios of calculated to measured response functions (C/E) in absolute values for 70 MeV p-Li neutrons around recoil proton edges, wide light-output ranges and continuous regions indicated by arrows in Fig. 3.1.4.5 (A) at 0, 45, 90 and 180 degree incidences of neutrons to the detector axis.
Response Matrices
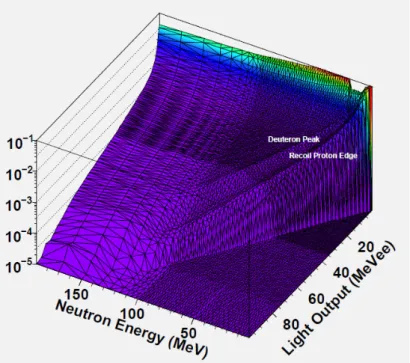
Neutron and photon response matrices are required in order to measure the neutron and photon energy spectra over a wide energy range. From the thus-verified results of the calculated response functions, response matrices were created based on the MCNPX simulation (MCNPX
2005) using the anti-coincidence mode, considering the light-output correlations with particle energies, the uniformity of light collection and the energy resolution (Takada et al. 2010 latter).
Fig. 3.1.4.6 shows the response matrices for neutrons up to 200 MeV.
Fig. 3.4.1.6 Neutron response matrices created with the MCNPX code for the phoswich detector.
Light output
Particle light outputs were measured at the NIRS cyclotron by direct incidence of particles in the liquid scintillator (EJ-399). For the light-output measurements, a liquid-scintillator cell of 5.08 cm in diameter was produced to decrease the particle energy loss in the detector walls. The thicknesses of both the front and the side faces of this liquid scintillator cell were 0.5 mm.
Light-output curves were obtained of protons up to 70 MeV, deuterons up to 50 MeV and helium ions up to 100 MeV. The measured proton light outputs were compared with the proton light-output function of the BC-501A liquid scintillator, as shown in Figure 3.1.4.7. The light outputs of the EJ-399-06 are a few percentage smaller than those of the BC-501A. The proton light-output function was obtained as:
L(MeVee) = 0.766 x Ep – 2.89 x (1-exp(-0.187 x Ep)) (1) where L is light output and Ep is proton energy (MeV).
Scintillations created by neutrons in the phoswich detector are attenuated by the liquid scintillator. The light attenuation in the EJ-399-06 was measured by charged particle incidence on the side wall of the cell and resulted to be 1/10.5 (cm-1). The light attenuation in the liquid scintillator consists of two components: one is the scintillation transmission directly to the PMT
window and the other is the reflection of scintillation at the front face of the detector.
Scintillations created at a distance t from the rear face of the liquid scintillator are transmitted along a distance t and 2L-t for the former and the latter cases, respectively, where L is the liquid scintillator length. The attenuation curve was obtained by the formula:
f = a1 exp(-t/b)+a2 exp(-(2L-t)/b) (2)
where a1 and a2 are normalization factors and b is attenuation length in the EJ-399-06 liquid scintillator.
In the phoswich detector, a scintillation created in a space close to the front face of the liquid scintillator can be attenuated by 15% at its rear face. In order to confirm the measured light output of protons, light outputs of protons recoiled by 13, 38 and 66.5 MeV neutrons were also measured (Fig. 3.1.4.7). Light outputs of protons recoiled by neutrons agree with the light outputs measured with direct incident protons within the uncertainties given by the neutron energies and by the widths of the proton peaks.
Fig.3.1.4.7 Light output functions of protons incident on the liquid scintillator directly (open circles), compared with protons recoiled by neutrons (closed circles) and light outputs of BC-501A liquid scintillator (solid line).
Simulation
The Monte Carlo N-Particle eXtended code (MCNPX), version 2.5.d. (MCNPX2005) was applied to simulate the neutron response functions. In the phoswich detector, protons were rejected from the neutron pulse heights. Part of the neutrons was also detected in the plastic scintillator. In neutron measurements, the phoswich detector identified neutron events detected
by the plastic scintillator as proton events. In the simulations, the events detected in the plastic scintillator had to be rejected from the neutron pulse heights. This was accomplished by applying the anticoincidence mode in the simulation scoring, where the events detected in both the plastic and liquid scintillators were thus rejected. The simulation geometry consisted of the liquid and plastic scintillators, the aluminum and acrylic covers and the acrylic light guide with their actual sizes, though no PMT was added in the detector configuration. Protons, deuterons, helium ions, electrons and gamma rays produced by neutrons in the detector configuration were transported up to 150 MeV with the neutron cross-section data library, LA150. Proton, deuteron and helium-ion pulse heights were obtained by scoring the events of charged particles detected only in the liquid scintillator and not in the plastic scintillator. The energies deposited in the liquid scintillator by each particle were converted to light outputs.
In order to study the angular dependence to neutrons, the detector responses were simulated for 70 MeV neutrons with different incident directions, from the front, the side, the back and the oblique angle of the detector. No difference between the calculated neutron responses was found at the different incidence directions accounted for. Therefore, all the response functions were calculated with neutrons impinging on the front face of the detector.
The detector response functions to neutrons up to 150 MeV were obtained by summing up the pulse heights of each particle, converted from deposited energies to light outputs, as shown in Figure 3.1.4.5. The shapes of calculated response functions agreed well with the measurements except for some discrepancies. Some events were found in the calculated pulse heights above the maximum proton energies, equal to the incident neutron energies. The events were eliminated from neutron responses. Because in the MCNPX code, neutrons are transported as non analog, the multiple protons produced by neutrons via the C(n,2p) and other reactions are sampled independently from each other. Therefore, more energy than what went into the reaction can be obtained.
Data acquisition system
The pulse shapes of the output signals from the phoswich neutron detector were acquired directly. Several advantages are obtained by measuring signal shapes; acquire maximum amounts of information from the detector, separate pile-up signals at an off-line analysis and no adjustment of electrical circuits before measurements. Measured signals are analyzed off line to discriminate neutron events from photons and charged particles and obtain pulse heights. As shown in Figure 3.1.4.2, difference of signals on incident particles can be observed in low voltage of signals. To measure pulse shape and wide dynamic range of signal voltage, a portable data acquisition unit is made in this study as shown in Figure 3.1.4.8. Signals from the phoswich detector can be recorded using the data acquisition unit. A flash ADC with 500 MHz sampling
rate and 12 bits dynamic range is incorporated in the unit. The data acquisition unit measures 0 to 5 V signals from -20 to 400 ns with the maximum waveform storing speed at 350 signals s-1 (Figure 3.1.4.9). Signal voltages of 2 ns time period are stored in the onboard memory and then transferred to a personal computer via the USB2.0. Low waveform storing speed would lose detected events; however, 10 MHz event trigger corrects the number of true events. We think that its sampling rates can follow particle measurements in the International Space Station.
Fig.3.1.4.8 A photo of the data acquisition unit NDL0703 which has a flash ADC with 500 MHz sampling ability.
Fig.3.1.4.9 Acquired signals from the phoswich neutron detector using the laptop data acquisition unit with 500 MHz and 12 bits flash ADC.
This data acquisition unit which is coupled with a phoswich detector, a small high voltage supply and a personal computer installed with data analyzing program (Fig. 3.1.4.10), has been named as “CREPAS” (Cosmic Radiation and Energetic Particle Analyzing System) by the authors.
Realtime data transf er (FTP) Start
Make plots of energy spectra
Display of plots of integrated signals Time ( start,
stop, passed, etc.)
Setting data acquisition conditions
Setting waveform analysis conditios
Setting unfolding calculation conditions
Fig.3.1.4.10 The data analyzing program developed for CREPAS.
Figure 3.1.4.11 shows the two-dimensional plots of signal integrals displayed on the CREPAS software for selected quasi-monoenergetic neutrons and monoenergetic protons supplied at particle accelerators in Japan; they are (a) 45 MeV neutrons at JAEA- TIARA and (b) ~ 230 MeV protons at NIRS-HIMAC. The X values of the figures are fast signal components (-20 to 100 ns from the trigger point) and Y values are slow components (150 to 400 ns) that come from the plastic scintillator. The voltage of photomultiplier was -1,200 V and the trigger level was -0.1 V in all the cases. It is seen that the plots of high-energy neutrons within a specific area (lower part of the plot area) and, in comparison with the results of proton beams (Fig. 3.1.4.11b), we can expect that energetic cosmic-ray neutrons can be well discriminated from protons using this system.
Fig.3.1.4.11 Two-dimensional plots displayed on the CREPAS software of fast versus slow signal integrals obtained for quasi-monoenergetic 45 MeV neutrons supplied at JAEA-TIARA (a) and monoenergetic ~ 230 MeV protons at NIRS-HIMAC (b).
3-2. Flight Conditions
The instruments were firmly fixed on to a rack and placed in a business jet aircraft (MU-300) as shown in Fig.3.2.1. The aircraft departed from the Nagoya airport (35.3°N, 136.9°E) and flew six times along different routes near the Chubu area of the Honshu Island in Japan (Fig.3.2.2). In this report, we focused on two representative routes as shown in Table 3.2.1.
The first run was a 96-min south-route flight on October 24, 2007, and the second run was a 140-min north-route flight on February 13, 2008. The flying time at the highest altitude was 54 min at 9.1 km (30,000 ft) in the first run and 37 min at 11 km (36,000 ft) in the second run.
Changes in aviation altitude were measured using a GPS and the recorded data were corrected to atmospheric pressure altitudes that were displayed on the monitor of a built-in altimeter.
Temperature inside the aircraft was maintained at 20-25 °C and the cabin pressure at 0.8-1.0 atm.
protons
~230MeV
230MeV 175MeV
Neutron
(b)
Neutron
n 45MeV at TIARA (a)
Fig.3.2.1 The external appearance (upper) and the cross view (lower) of the business jet aircraft MU-300.
North area
South area
Nagoya airport
Fig.3.2.2 Flight routes employed for the experiments from 2006 to 2008.
Table 3.2.1 Conditions of the representative flights chosen in this study.
Cruising conditions
No Date
Altitude [km] Latitude
[deg.]
Time [min]
1 October 24th, 2007 9.1 34.0°N 54
2 February 13th, 2008 10.8 39.0°N 37
3-3. Radiation Model in the Atmosphere
Development of a model for estimating cosmic-ray spectra in the atmosphere is indispensable for estimating doses for each aircrew, since the doses depend on altitude, geomagnetic location and solar activity (referred to here as global conditions) along the flight routes in a complicated manner, and it is impractical to measure the doses for all flight conditions. A number of studies have been devoted to the construction of the model. For instances, Ziegler (1998) proposed an empirical formula for predicting the high energy neutron spectra. O’Brien et al. (1978) developed a deterministic code LUIN based on an analytical two-component solution of the Boltzmann transport equation. The code is capable of estimating the altitude dependences of aircrew doses and integrated neutron fluxes precisely, and is adopted in the route dose calculation code CARI-6 (FAA 2008). Several authors (Roesler et al. 1998; Ferrari et al. 2001;
Clem et al. 2004) adopted a Monte Carlo particle transport code, FLUKA (Ferrari et al. 2005;
Battistoni et al. 2007), for the calculation of the cosmic-ray propagation in the atmosphere.
Their calculation methods were successful in reproducing the neutron spectra measured at high altitudes, and a similar model was employed in the European Program Package for the Calculation of Aviation Route Doses EPCARD (GSF 2008). However, the cosmic-ray neutron spectra depend not only on the atmospheric depth, cut off rigidity and solar modulation (referred to here as global conditions) but also the structure of the aircraft (Ferrari et al. 2004) and the water density around the point of interest (Roesler et al. 1998) (referred to here as local geometries) in an intricate manner, and none of the existing models are able to reproduce the measured neutron spectra at any location and time with satisfactory accuracy.
With these situations in mind, we have calculated the cosmic-ray spectra by performing Monte Carlo particle transport simulation in the atmosphere based on the Particle and Heavy Ion Transport code System PHITS (Iwase et al. 2002), utilizing the latest version of the nuclear data library JENDL-High-Energy File (JENDL/HE) (Fukahori et al. 2002; Watanabe et al. 2005).
In the simulation, cosmic-rays with charges up to 28 (Ni) were incident on the earth system represented by the concentric spherical shells, and the neutron spectra in each shell, i.e. a certain altitude range, were obtained. Based on a comprehensive analysis of the simulation results, we proposed analytical functions to predict the cosmic-ray neutron as well as proton, He ion, muon, electron, positron and photon spectra at any global condition at the altitudes below 20 km, considering the local geometry effect. The model was designated “PARMA”: PHITS based Analytical Radiation Model in the Atmosphere. The details of the simulation procedure together with the derivation procedure of PARMA were described in refs. (Sato and Niita 2006; Sato et al.
2008). Using PARMA, we have developed EXcel-based Program for Calculating Cosmic-ray Spectrum (EXPACS), which can calculate not only cosmic-ray spectra but also the corresponding effective dose and ambient dose equivalent for any locations in the world. The software has been opened for public from its web site (Sato et al. 2008).
As an example of the calculated results, the atmospheric neutron spectra at flight altitudes as well as ground level obtained from the PHITS simulation and PARMA are depicted in Figure 3.3.1, in comparison with the corresponding experimental data measured with the Bonner Ball Neutron Detectors (Goldhagen et al. 2004; Nakamura et al. 2005). It is evident from the graphs that the PHITS can reproduce the experimental data even at the ground level. Furthermore, PARMA is substantially superior to the PHITS simulation in reproducing experimental data at lower energies. This is because the local geometry effect on the spectra is precisely considered in the PARMA calculation, providing the water density in ground or the mass of aircraft to the functions. Comparison between the PARMA calculation and the DOSCONA experimental data will be given in the next section.