37
1 INTRODUCTION
It is suggested that the occurrence, recurrence, and aggravation of depression might be related to stress, regardless of its internal or mental cause
1). The stress vulnerability hypothesis is advocated for schizophrenia, so it is considered that its occurrence and recurrence are related to stress
2). In addition, diseases such as asthma, hypertension, peptic ulcer, and irritable bowel syndrome are reported to have a psychosomatic correlation
3)related to stress. Stress is also one of the principal factors that influences and motivates overwork suicide, which is recently increasing and becoming a social problem in Japan
4).
Specialists in many disciplines have studied one aspect or another of stress-ranging from the biological sciences such as physiology, biochemistry, and neuro- physiology, through the psychological sciences such as
psychoanalysis, personality, learning theory, developmen- tal psychology, and social ecology to the social sciences such as anthropology, sociology, and military history
5). Not surprisingly, the referents to the term stress vary across these fields, adding to the confusion. In this study, we define stressor as an external occurrence and stress as the reaction to the stressor, which is the defi- nition psychologists and sociologists generally adopt
5).
Although it has been reported that they are related to some diseases in Japan, precautions against stressors have not progressed. Why have countermeasures not been developed? It may be that the problem lies in the approach, based on the idea that the stressor has to be removed only because it is a cause of disease, and that it involves only a high risk group and is not prevalent in the general population. When we contemplate these studies, it is necessary to know in detail about stress-related phe-
ORIGINAL
Association of Cognitive Style and Satisfaction with Depressive Symptoms in Workers in Hokkaido, Japan
Kota K OBAYASHI
1), Hirotsugu M IYAKE
2), Goroh O KANO
3)and Mitsuru M ORI
1)1)
Department of Public Health, Sapporo Medical University School of Medicine (Chief: Prof. M. Mori)
2)
Hokkaido Occupational Health Promotion Center
3)
Division of Exercise Science, Sapporo Medical University School of Medicine
ABSTRACT
Recently in Japan, major depression, the depressive state, and suicide are increasingly becoming social problems, especially in the workplace. These requires preventive intervention. The present study was therefore carried out to examine the relationship of cognitive style and other factors with depressive symptoms in order to search for methods of preventive intervention for mental disorders. In January 2005, we conducted a cross-sectional survey of a total of 3057 workers in Hokkaido, Japan. In addition to age, sex, and educational background, we investigated lifestyle fac- tors, work-related conditions, psychiatric consultation, social supports, stressors, loci of control (LOC) for cognitive style, perceived job satisfaction, work environment, home atmosphere, and health with regard to cognitive style, Ozeki's coping style for stress, and the Center of Epidemiological Studies-Depression Scale (CES-D) for depressive symptoms. After excluding data from incomplete responses, we analyzed 2132 workers, consisting of 1245 males and 887 females with an average age of 39.9 years. Multivariate logistic regression analysis revealed a significantly increased risk for a high CES-D score in the more external control group in the LOC for both sexes, and significantly increased risks for high CES-D scores were obtained in the unsatisfied category for job, work environment, home atmosphere, and health status. The external cognitive style and perceived dissatisfaction may increase the risk of depressive symptoms in workers. Thus, it may be possible to prevent the onset of depressive symptoms through inter- vention involving cognitive style.
(Received November 2, 2006 and accepted November 16, 2006)
Key words: Depressive symptom, Cognitive style, Satisfaction, Stress, Occupational health
nomena. We determined questionnaire items after refer- ring to the stress model of Lazarus
6), the NIOSH model of occupational diseases
7), and the basic concept of cognitive therapy
8). When investigating stress, we must consider the actual stressors, cognitive style, coping style, social supports, and so on. In addition, we presume that depres- sive symptoms, as one of the results of stress, may be pre- ventable by improving, for example, the cognitive style or coping style.
Recently in Japan, overwork suicide, adjustment disorder, and depression have become serious social prob- lems among workers. Investigations have been per- formed concerning the actual conditions of occupational mental health. Although there have been some beneficial reports about occupational mental health in Japan
9-11), the influences they noted were extremely weighted in envi- ronmental factors such as the occupation and office. To be sure, it is very important to change the occupational environment, but it is more desirable to deal with mental health problems considering both the individual and occupational environments. Stress related to labor occurs not only on the job, but also in the home and individual environment. Taking into account these points, for indi-
vidual intervention, we focused on cognitive therapy, which is widely used in psychiatry and psychology, and hypothesized that preventive intervention based on cogni- tive therapy might be effective in primary prevention for mental health. In some investigations satisfaction vari- ables were very strongly associated with stress-related factors
12-15), so we directed our attention to satisfaction as a convenient index expressing mental health status. The present study was therefore conducted to examine the association of cognitive style and satisfaction with depressive symptoms in order to develop a strategy of preventive intervention for mental disorders.
2 METHODS 2.1 Study subjects
As shown in Figure 1, a cross-sectional study was conducted in 2005 among workers in Hokkaido, Japan.
First, we randomly sampled 100 of the 5760 companies registered in the Hokkaido Occupational Health Promotion Center. Documents for recruitment were mailed to the occupational health sections of these 100 companies. Thirteen companies responded, and 11 decid- ed to participate after receiving more detailed informa- tion. In January 2005, the questionnaires and documents explaining the purpose of the study, a request to partici- pate, and affirmation that privacy would be respected were mailed to the 11 companies. Each worker in the 11 companies was requested to read the documents and fill out the questionnaire after agreeing with the terms of the study. They then put the questionnaires in specified envelopes and sealed them. If the questionnaire was filled out and returned, informed consent was interpreted to have been obtained, with approval from the Ethics Committee of Sapporo Medical University. Then we instructed the worker responsible for the survey in the occupational health section of each company not to open the envelopes and to return them to us rapidly.
The study subjects were 3057 workers, 94 from 3 construction companies, 919 from 3 medical- or welfare- related organizations, 1586 from one publishing compa- ny, 153 from one finance company, 257 from one airline company, 18 from one security company, and 30 from one manufacturer. After excluding 236 incomplete responses from the 2368 replies, 2132 of them (69.7% of the target population) were analyzed.
2.2 Measurements
In addition to age, sex, and educational background, we investigated lifestyle factors, work-related conditions, Fig.1 Flow chart showing the procedure used for selection of the
participants in this study.
psychiatric consultation, social supports, stressors, loci of control (LOC) for cognitive style
16), perceived satisfaction for cognitive style, Ozeki's coping style for stress
17), and the Center of Epidemiological Studies-Depression Scale (CES-D)
18)for depressive symptoms as follows.
For lifestyle factors, we surveyed the frequency of eating breakfast, a well-balanced diet, regular physical exercise, smoking status, alcohol drinking, and habitual activities such as a hobby. For work-related conditions, we surveyed the kind of occupation, having subordinates, and degree of work load, self discretion, and opinion regarding the value of their job
7,9,19). Occupations were divided into 3 categories; office work, professional/tech- nical trade/sales and others.
For measuring stress, we referred to the Social Readjustment Rating Scale of Holmes and Rahe
20)and inquired about events with scores of more than 50 points such as the death of a family member, divorce or separa- tion from spouse, and severe diseases experienced by the subject in the previous year. Subjects were classified as potentially having severe stress if they experienced one or more such negative life event in that time. For social sup- ports
21-23), we measured whether superiors, coworkers, or family/friends paid attention to the subject's troubles.
The LOC is a scale developed by Kambara et al.
16), based on Rotter's I-E scale
24). This scale reflects the degree to which individuals attribute control in their life to either internal or external sources. Externals tend to ascribe control of life events to other individuals and/or to fate. Generally, internally oriented individuals assume personal control of life events. There are 18 items in this questionnaire and each is scored on a four-point scale.
The total score is obtained by summing all responses.
The higher the total score, the more the locus of control of the individual tends to be internal. On the other hand, a lower total score indicates that the locus of control of the individual tends to be external.
Coping refers to the cognitive, emotional and behav- ioral strategies that one utilizes to manage or reduce stress and its effects. We used 14 items of Ozeki's coping style
17)in this study and each item was scored on a four- point scale. Each item was divided into three scales:
problem-focused coping (P-Co), emotion-focused coping (E-Co), and avoidance coping (A-Co). High total scores for P-Co and E-Co were interpreted to indicate that the individual had a tendency to engage in active behavioral coping and was stronger when combating stress, whereas a high A-Co score was considered to indicate that the individual was weak in combating stress
17,25).
The CES-D
26), which Radloff created in 1977, was designed to measure the current levels of depressive symptoms, and has been used in many countries. The Japanese version
18)of the CES-D, which we used in this study, has been adapted not only for adults but also for adolescents. The subjects were asked to rate the frequen- cy or duration of each symptom in the past week. There are 20 items in this questionnaire, and each item is scored on a four-point scale. The total score is obtained by sum- ming all responses. The subject was classified as having a high CES-D score abbreviated to HCS, if the CES-D score was equal to or more than 16, according to the rec- ommendation of the developers
18,26).
2.3 Statistical analysis
To consider the reliability of the CES-D, LOC, and Ozeki's coping style, we calculated Cronbach's reliability coefficient alpha for each. We evaluated the associations of various dependent variables with the dichotomized CES-D score by sex. The chi-square test for qualitative variables was used to calculate the p-values. The test of linear trends
27,28)was estimated by treating each category as an ordinal variable. Odds ratios (ORs) and their 95%
confidence intervals (95% CIs) were computed with logistic regression analysis by forced entry modeling
27-29). We set up two models for adjusting potential confounding variables. Statistical Package for Social Science (SPSS) 11.5J for Windows
27 ,29)was used for these analyses. All tests were two-tailed. Probability (P-) values of less than 0.05 were regarded as statistically significant.
3 RESULTS
Cronbach's reliability coefficient alpha values were 0.87 for the 20 CES-D items, 0.79 for internal control of 9 LOC items, 0.73 for external control of 9 LOC items, 0.71 for 5 P-Co items, 0.60 for 3 E-Co items, and 0.71 for 6 A-Co items. A total of 1245 subjects (58.4%) were males. The mean ages (
±standard deviation, SD) of males and females were 41.3 (
±10.08) and 37.9 (
±11.64) years, respectively. The total mean (
±SD) of the CES-D was 14.9 (
±8.97); that of males being 13.7 (
±8.68), and that of females being 16.6 (
±9.09). The pro- portion of all subjects at or over the cutoff level in this study was 40.2% (34.1% for males, 48.7% for females).
Significant negative associations of age were observed with the CES-D for both males and females. A signifi- cant negative relation to educational background was noted with the CES-D only for males.
The associations of demographic variables and
lifestyle factors for the CES-D are shown in Table 1. A significant association with HCS was observed in those who less frequently ate breakfast, had a less well-bal- anced diet, did less regular physical exercise (P for trend, P<0.001 for both males and females), and who did not perform habitual activities such as a hobby (P<0.001, for
both males and females).
The associations of job-related variables and psychi- atric consultation in the CES-D are shown in Table 2. A significant association with the HCS was obtained for those who did not have subordinates, who answered that their work loads were heavy (P=0.008 for males, P=0.010 Table 1 The associations of demographic variables and lifestyle factors with CES-D for workers in Hokkaido.
Male n=1245 Female n=887
Variables
non HCS# n=820 HCS# n=425 P-value non HCS# n=455 HCS# n=432 P-value Age
20〜29 yrs 100 (12.3%) 77 (18.1%) <0.001 137 (30.6%) 166 (38.9%) <0.001
30〜39 yrs 253 (31.1) 163 (38.4) 122 (27.2) 110 (25.8)
40〜41 yrs 249 (30.6) 111 (26.1) 88 (19.6) 81 (19.0)
50 + 212 (26.0) 74 (17.4) 101 (22.5) 70 (16.4)
P for trend <0.001 <0.001
Educational background
Junior high, or withdrawal from high school 15 (1.8%) 9 (2.1%) 0.027 9 (2.0%) 10 (2.3%) 0.227
High school 223 (27.3) 138 (32.5) 125 (27.7) 127 (29.7)
Technical, junior college, or withdrawal from college 68 (8.3) 49 (11.5) 218 (48.2) 220 (51.4)
College or over 510 (62.5) 229 (53.9) 100 (22.1) 71 (16.6)
P for trend 0.011 0.099
Eating breakfast
Every day 530 (64.9%) 202 (47.5%) <0.001 289 (63.7%) 233 (54.1%) 0.011
Sometimes 140 (17.1) 84 (19.8) 87 (19.2) 94 (21.8)
Seldom 92 (11.3) 88 (20.7) 58 (12.8) 68 (15.8)
Not at all 55 (6.7) 51 (12.0) 20 (4.4) 36 (8.4)
P for trend <0.001 0.001
Considering well-balanced diet
Frequently 209 (25.6) 71 (16.7) <0.001 120 (26.4) 67 (15.5) <0.001
Sometimes 396 (48.5) 207 (48.7) 239 (52.5) 227 (52.7)
Seldom 177 (21.7) 97 (22.8) 82 (18.0) 106 (24.6)
Not at all 34 (4.2) 50 (11.8) 14 (3.1) 31 (7.2)
P for trend <0.001 <0.001
Regular physical exercise
Frequently 131 (16.1) 38 (8.9) <0.001 39 (8.6) 19 (4.4) 0.006
Sometimes 210 (25.7) 88 (20.7) 80 (17.6) 65 (15.1)
Seldom 338 (41.4) 184 (43.3) 190 (41.8) 168 (39.0)
Not at all 137 (16.8) 115 (27.1) 146 (32.1) 179 (41.5)
P for trend <0.001 0.001
Smoking habits
Nonsmoker 211 (25.8) 107 (25.2) 0.055 270 (59.3) 232 (53.8) 0.090
Ex-smoker 244 (29.9) 99 (23.3) 57 (12.5) 44 (10.2)
Smoking sometimes 30 (3.7) 17 (4.0) 16 (3.5) 20 (4.6)
Smoking every day 332 (40.6) 202 (47.5) 112 (24.6) 135 (31.3)
P for trend 0.051 0.023
Alcohol drinking
Seldom or not at all 118 (14.4) 81 (19.1) 0.102 163 (35.8) 147 (34.1) 0.678
Sometimes 373 (45.7) 186 (43.9) 220 (48.4) 221 (51.3)
Every day 326 (39.9) 157 (37.0) 72 (15.8) 63 (14.6)
P for trend 0.074 0.911
Habitual activities such as hobby
Doing 317 (39.3) 125 (29.6) 0.001 165 (36.3) 121 (28.1) 0.009
Not at all 490 (60.7) 298 (70.4) 289 (63.7) 309 (71.9)
Total numbers differ among variables due to some missing values. #HCS: high CES-D score (
≧16.).
for females), who had little discretion in their work (P<0.001 for both males and females), and whose jobs were less meaningful (P<0.001 for both males and females). Significant associations with HCS were observed for those who had consulted a psychiatrist (P<0.001 for males, P=0.003 for females).
The associations of stressors, perceived satisfaction, and social support in the CES-D are shown in Table 3.
Significant associations with HCS were noted for those who had experienced severe stressors in the previous year (P<0.001 for males, P=0.045 for females). Significant associations with HCS were found in those dissatisfied with their job, office environment, home atmosphere, and health status (P<0.001 for both males and females). In addition, significant associations with HCS were observed in those who received little social support from superiors, coworkers, and family/friends (P<0.001 for both males and females).
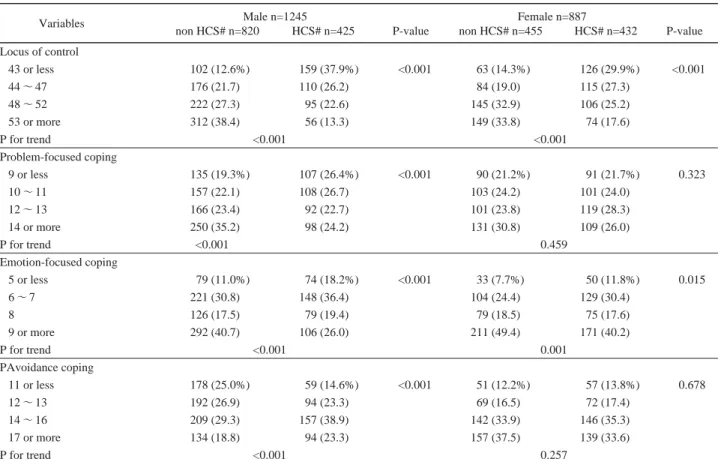
The associations of the locus of control and Ozeki's
coping style with the CES-D are shown in Table 4. The means (
±SD) of the LOC scores for males and females were 48.7 (
±7.03) and 48.2 (
±6.71), respectively.
Significant negative associations of the LOC with the CES-D were obtained for both males and females (P<0.001 for both). Similarly, significant negative associ- ations of the E-Co with the CES-D were noted for both males and females (P<0.001 for both). Moreover, in males, a significant negative association of P-Co and pos- itive association of A-Co with the CES-D were noted (P<0.001 for both).
As shown in Table 5 for work-related factors, the CES-D, after logistic regression analysis adjusted for age, educational background, and company, revealed signifi- cantly increased risks for subjects with heavier work loads (for males, P for trend, P=0.035, and for females, P for trend, P=0.032). Significantly increased risks of HCS were observed for those given little discretion in their work (for males, P for trend, P<0.001, and for females, P Table 2 The associations of job-related variables and psychiatric consultation with CES-D for workers in Hokkaido.
Male n=1245 Female n=887
Variables
non HCS# n=820 HCS# n=425 P-value non HCS# n=455 HCS# n=432 P-value Kind of occupation
Office work 157 (19.2%) 87 (20.6%) 0.773 82 (18.9%) 80 (19.2%) 0.992
Professional/Technician/Sales 430 (52.7) 214 (50.7) 311 (71.7) 297 (71.4)
Others 229 (28.1) 121 (28.7) 41 (9.4) 39 (9.4)
Having subordinates
Yes 475 (58.1) 203 (48.0) 0.001 109 (24.0) 93 (21.6) 0.389
No 342 (41.9) 220 (52.0) 345 (76.0) 338 (78.4)
Work load is heavy.
Yes 120 (14.8) 93 (21.9) 0.012 174 (38.7) 208 (48.5) 0.024
Rather yes 402 (49.4) 196 (46.1) 180 (40.0) 143 (33.3)
Rather no 221 (27.2) 109 (25.6) 72 (16.0) 63 (14.7)
No 70 (8.6) 27 (6.4) 24 (5.3) 15 (3.5)
P for trend 0.008 0.010
Self discretion is given in work.
Yes 197 (24.2) 53 (12.5) <0.001 79 (17.4) 37 (8.6) <0.001
Rather yes 461 (56.6) 217 (51.1) 222 (48.9) 174 (40.5)
Rather no 126 (15.5) 117 (27.5) 122 (26.9) 137 (31.9)
No 31 (3.8) 38 (8.9) 31 (6.8) 82 (19.1)
P for trend <0.001 <0.001
Job is worthwhile.
Yes 246 (30.1) 70 (16.5) <0.001 156 (34.4) 87 (20.2) <0.001
Rather yes 444 (54.4) 207 (48.7) 215 (47.4) 224 (52.1)
Rather no 106 (13.0) 115 (27.1) 60 (13.2) 81 (18.8)
No 20 (2.5) 33 (7.8) 23 (5.1) 38 (8.8)
P for trend <0.001 <0.001
Psychiatric consultation
Yes 8 (1.0) 25 (5.9) <0.001 1 (0.2) 11 (2.5) 0.003
No 812 (99.0) 400 (94.1) 454 (99.8) 421 (97.5)
Total numbers differ among variables due to some missing values.
#: See Table 1.
for trend, P<0.001), those who found their work less meaningful (for males, P for trend, P<0.001, and for females, P for trend, P<0.001), had consulted a psychia- trist (for males, P<0.001 and for females, P<0.001), had experienced a severe stressor in the previous year (for males, P<0.001, and for females, P<0.001), and were in the more external control group in the LOC when the ref-
erence score was 53 points or more (for males, P for trend, P<0.001, and for females, P for trend, P<0.001).
For coping styles, significantly increased risks of HCS were seen in those adopting less P-Co for males (P for trend, P<0.001), those adopting less E-Co (for males, P for trend, P<0.001, and for females, P for trend, P=0.014), those adopting more A-Co for males (P for Table 3 The associations of stressors, perceived satisfaction and social support with CES-D for workers in Hokkaido.
Male n=1245 Female n=887
Variables
non HCS# n=820 HCS# n=425 P-value non HCS# n=455 HCS# n=432 P-value Severe stressor in the previous year.
Yes 133 (16.2%) 101 (23.8%) 0.001 99 (21.8%) 119 (27.5%) 0.045
No 687 (83.8) 324 (76.2) 356 (78.2) 313 (72.5)
Satisfaction about job Satisfied 163 (20.0) 27 (6.4) <0.001 56 (12.4) 14 (3.3) <0.001
Rather satisfied 470 (57.8) 180 (42.4) 239 (53.0) 154 (36.0)
Rather unsatisfied 154 (18.9) 166 (39.1) 119 (26.4) 174 (40.7)
Unsatisfied 26 (3.2) 52 (12.2) 37 (8.2) 86 (20.1)
P for trend <0.001 <0.001
Satisfaction about office environment
Satisfied 141 (17.3) 19 (4.5) <0.001 47 (10.4) 19 (4.4) <0.001
Rather satisfied 389 (47.7) 150 (35.3) 220 (48.5) 112 (26.2)
Rather unsatisfied 241 (29.5) 182 (42.8) 133 (29.3) 180 (42.1)
Unsatisfied 45 (5.5) 74 (17.4) 54 (11.9) 117 (27.3)
P for trend <0.001 <0.001
Satisfaction about home atmosphere.
Satisfied 448 (55.2) 125 (29.8) <0.001 216 (47.8) 125 (29.4) <0.001
Rather satisfied 305 (37.6) 178 (42.4) 185 (40.9) 191 (44.9)
Rather unsatisfied 47 (5.8) 90 (21.4) 47 (10.4) 88 (20.7)
Unsatisfied 11 (1.4) 27 (6.4) 4 (0.9) 21 (4.9)
P for trend <0.001 <0.001
Satisfaction about health status
Satisfied 135 (16.5) 25 (5.9) <0.001 91 (20.0) 30 (7.0) <0.001
Rather satisfied 386 (47.3) 132 (31.1) 218 (47.9) 155 (36.0)
Rather unsatisfied 259 (31.7) 205 (48.2) 128 (28.1) 191 (44.3)
Unsatisfied 36 (4.4) 63 (14.8) 18 (4.0) 55 (12.8)
P for trend <0.001 <0.001
Support from superiors Yes 164 (21.4) 35 (8.5) <0.001 109 (25.1) 60 (14.2) <0.001
So-so 394 (51.5) 189 (45.9) 190 (43.7) 164 (38.7)
Little 136 (17.8) 105 (25.5) 71 (16.3) 84 (19.8)
No 71 (9.3) 83 (20.1) 65 (14.9) 116 (27.4)
P for trend <0.001 <0.001
Support from coworkers Yes 205 (26.8) 65 (15.6) <0.001 208 (47.3) 143 (33.3) <0.001
So-so 427 (55.8) 199 (47.8) 186 (24.3) 214 (49.9)
Little 85 (11.1) 87 (20.9) 25 (5.7) 46 (10.7)
No 48 (6.3) 65 (15.6) 21 (4.8) 26 (6.1)
P for trend <0.001 <0.001
Support from family or friends
Yes 420 (53.2) 138 (33.2) <0.001 323 (71.5) 248 (57.9) <0.001
So-so 317 (40.1) 180 (43.3) 106 (23.5) 142 (33.2)
Little 34 (4.3) 62 (14.9) 19 (4.2) 25 (5.8)
No 19 (2.4) 36 (8.7) 4 (0.9) 13 (3.0)
P for trend <0.001 <0.001
Total numbers differ among variables due to some missing values.
#: See Table 1.
trend, P<0.001), in the group less satisfied with their jobs, when the reference was the satisfied group (for males, P for trend, P<0.001, and for females, P for trend, P<0.001), in the group less satisfied with their office envi- ronments, when the reference was the satisfied group (for males, P for trend, P<0.001, and for females, P for trend, P<0.001), the group less satisfied with their home atmos- phere, when the reference was the satisfied group (for males, P for trend, P<0.001, and for females, P for trend, P<0.001), and in the group less satisfied with their health status, when the reference was the satisfied group (for males, P for trend, P<0.001, and for females, for trend, P<0.001). For social supports, significantly increased risks of HCS were observed in those who disclosed that support from their superiors was insufficient (for males, P for trend, P<0.001, and for females, P for trend, P<0.001), those who disclosed that support from their coworkers was insufficient (for males, P for trend, P<0.001, and for females, P for trend, P<0.001) and those who disclosed that support from their family and friends was insufficient (for males, P for trend, P<0.001, and for females, P for trend, P<0.001).
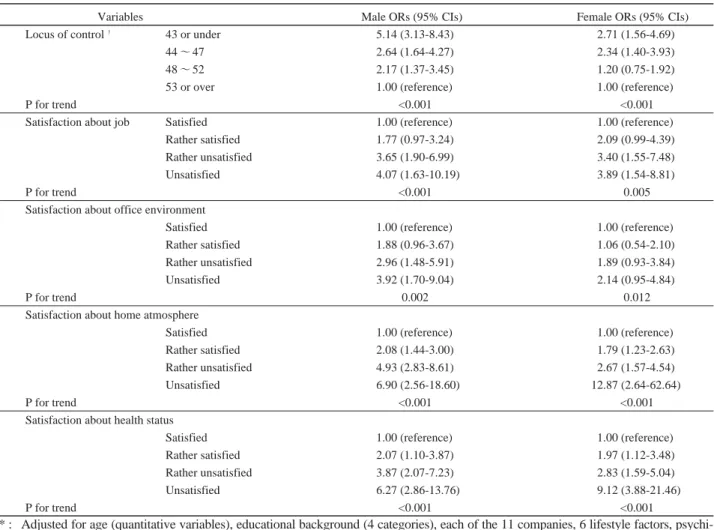
In addition to age (quantitative variables), educa- tional background (4 categories) and each of the 11 com- panies, 6 lifestyle factors, psychiatric consultation, 5 job- related variables, 3 coping styles (quantitative variables), severe stressors, and social supports were adjusted for as potential confounders, focusing on the cognitive style. As shown in Table 6, a significantly increased risk of HCS was denoted in the more external control group in the LOC when the reference score was 53 points or more (for males, P for trend, P<0.001, and for females, P for trend, P<0.001), and in the group less satisfied with their jobs when the reference was the satisfied group (for males, P for trend, P<0.001, and for females, P for trend, P<0.001). There were more depressive symptoms in the group less satisfied with the office environment (for males, P for trend, P=0.002, and for females, P for trend, p=0.012). Significantly increased risks of HCS were found in the groups less satisfied with their home atmos- phere (for males, P for trend, P<0.001, and for females, P for trend, P<0.001), and less satisfied with their health status (for males, P for trend, P<0.001, and for females, P for trend, P<0.001).
Table 4 The associations of locus of control and coping style with CES-D for workers in Hokkaido.
Male n=1245 Female n=887
Variables
non HCS# n=820 HCS# n=425 P-value non HCS# n=455 HCS# n=432 P-value
Locus of control
43 or less 102 (12.6%) 159 (37.9%) <0.001 63 (14.3%) 126 (29.9%) <0.001
44〜47 176 (21.7) 110 (26.2) 84 (19.0) 115 (27.3)
48〜52 222 (27.3) 95 (22.6) 145 (32.9) 106 (25.2)
53 or more 312 (38.4) 56 (13.3) 149 (33.8) 74 (17.6)
P for trend <0.001 <0.001
Problem-focused coping
9 or less 135 (19.3%) 107 (26.4%) <0.001 90 (21.2%) 91 (21.7%) 0.323
10〜11 157 (22.1) 108 (26.7) 103 (24.2) 101 (24.0)
12〜13 166 (23.4) 92 (22.7) 101 (23.8) 119 (28.3)
14 or more 250 (35.2) 98 (24.2) 131 (30.8) 109 (26.0)
P for trend <0.001 0.459
Emotion-focused coping
5 or less 79 (11.0%) 74 (18.2%) <0.001 33 (7.7%) 50 (11.8%) 0.015
6〜7 221 (30.8) 148 (36.4) 104 (24.4) 129 (30.4)
8 126 (17.5) 79 (19.4) 79 (18.5) 75 (17.6)
9 or more 292 (40.7) 106 (26.0) 211 (49.4) 171 (40.2)
P for trend <0.001 0.001
PAvoidance coping
11 or less 178 (25.0%) 59 (14.6%) <0.001 51 (12.2%) 57 (13.8%) 0.678
12〜13 192 (26.9) 94 (23.3) 69 (16.5) 72 (17.4)
14〜16 209 (29.3) 157 (38.9) 142 (33.9) 146 (35.3)
17 or more 134 (18.8) 94 (23.3) 157 (37.5) 139 (33.6)
P for trend <0.001 0.257
Total numbers differ among variables due to some missing values.
#: See Table 1.
4 DISCUSSION
We surveyed and analyzed categories of mental sta- tus including depressive symptoms and cognitive styles in workers in Hokkaido, Japan. As a result, we discovered the actual depressive symptoms assessed by the CES-D, and strong associations between depressive symptoms and cognitive styles; that is to say, there were more
depressives in the external cognitive group and among those who expressed dissatisfaction with the job, office environment, home atmosphere, and health status.
Although the results were in part differentiated by gender, and the strength of some associations diminished as adjustment accommodated more potential variables, the important factors concerning cognition were predomi- nantly maintained. In Japan, there have been some bene- Table 5-1 Odds ratios (ORs) and 95% confidence intervals (95% CIs) of high CES-D score (HCS#) adjusted for age (quantitative vari- ables), educational background (4 categories), and each of the 11 companies by logistic regression analysis for workers in Hokkaido.
Variables Male ORs (95% CIs) Female ORs (95% CIs)
Workload is heavy. Yes 1.90 (1.11-3.27) 1.99 (0.96-4.14)
Rather yes 1.20 (0.74-1.96) 1.26 (0.62-2.58)
Rather no 1.31 (0.78-2.17) 1.40 (0.66-2.96)
No 1.00 (reference) 1.00 (reference)
P for trend 0.035 0.032
Self discretion is given in work.
Yes 1.00 (reference) 1.00 (reference)
Rather yes 1.64 (1.15-2.33) 1.51 (0.96-2.37)
Rather no 3.21 (2.11-4.87) 2.01 (1.25-3.27)
No 3.85 (2.13-6.96) 5.20 (2.85-9.47)
P for trend <0.001 <0.001
Job is worthwhile. Yes 1.00 (reference) 1.00 (reference)
Rather yes 1.70 (1.23-2.36) 1.97 (1.41-2.77)
Rather no 4.09 (2.76-6.05) 2.78 (1.78-4.34)
No 5.70 (3.02-10.76) 2.87 (1.56-5.23)
P for trend <0.001 <0.001
Psychiatric consultation Yes 6.96 (3.07-15.80) 10.01 (1.25-80.82)
No 1.00 (reference) 1.00 (reference)
Severe stressor in the previous year.
Yes 1.64 (1.21-2.22) 1.40 (1.02-1.93)
No 1.00 (reference) 1.00 (reference)
Locus of control† 43 or less 9.59 (6.46-14.24) 4.16 (2.70-6.39)
44〜47 3.95 (2.68-5.82) 3.20 (2.11-4.85)
48〜52 2.65 (1.80-3.90) 1.68 (1.14-2.48)
53 or more 1.00 (reference) 1.00 (reference)
P for trend <0.001 <0.001
Problem-focused coping† 9 or less 1.95 (1.37-2.78) 1.40 (0.95-2.04)
10〜11 1.72 (1.21-2.44) 1.25 (0.85-1.84)
12〜13 1.46 (1.02-2.45) 1.18 (0.79-1.78)
14 or more 1.00 (reference) 1.00 (reference)
P for trend 0.001 0.380
Emotion-focused coping† 5 or less 2.49 (1.67-3.72) 1.86 (1.12-3.09)
6〜7 1.94 (1.42-2.64) 1.61 (1.14-2.27)
8 1.82 (1.26-2.64) 1.19 (0.81-1.74)
9 or more 1.00 (reference) 1.00 (reference)
P for trend <0.001 0.014
Avoidance coping† 11 or less 1.00 (reference) 1.00 (reference)
12〜13 2.17 (1.45-3.26) 0.76 (0.48-1.20)
14〜16 2.40 (1.66-3.48) 0.90 (0.57-1.43)
17 or more 1.50 (1.01-2.23) 0.97 (0.58-1.63)
P for trend <0.001 0.537
†: Categorized by quartiles.
#: See Table 1.
ficial stress-related studies in the occupational health field
9,10,30,31). The results of these studies might lead to effective preventive interventions, but there were few fac- tors joining cognitive variables with actual preventive methods in them. When considering preventive interven- tion for individuals in occupational health, we hypothe- sized that the individual's cognitive style might have an effect on mental health problems, and that intervention
based on cognitive therapy might be effective.
Considering these points, our data may offer useful infor- mation for occupational mental health.
The mean CES-D score and the proportion of all subjects at or over the cutoff point in this study were 14.9 (13.7 for males, 16.6 for females) and 40.2% (34.1% for males, 48.7% for females), respectively, levels that were high when compared with the reports for antecedent stud- Table 5-2 Odds ratios (ORs) and 95% confidence intervals (95% CIs) of high CES-D score (HCS#) adjusted for age (quantitative vari- ables), educational background (4 categories), and each of the 11 companies by logistic regression analysis for workers in Hokkaido.
Variables Male ORs (95% CIs) Female ORs (95% CIs)
Satisfaction about job Satisfied 1.00 (reference) 1.00 (reference)
Rather satisfied 2.19 (1.40-3.45) 2.74 (1.45-5.20)
Rather unsatisfied 6.46 (4.02-10.36) 6.33 (3.30-12.06)
Unsatisfied 10.81 (5.70-20.50) 9.11 (4.40-18.85)
P for trend <0.001 <0.001
Satisfaction about office environment
Satisfied 1.00 (reference) 1.00 (reference)
Rather satisfied 2.82 (1.67-4.75) 1.24 (0.68-2.25)
Rather unsatisfied 5.66 (3.34-9.57) 3.50 (1.93-6.37)
Unsatisfied 10.90 (5.87-20.25) 5.23 (2.74-9.98)
P for trend <0.001 <0.001
Satisfaction about home atmosphere
Satisfied 1.00 (reference) 1.00 (reference)
Rather satisfied 2.16 (1.64-2.86) 1.88 (1.37-2.59)
Rather unsatisfied 6.86 (4.52-10.39) 3.59 (2.32-5.54)
Unsatisfied 8.78 (4.13-18.67) 10.38 (3.37-31.99)
P for trend <0.001 <0.001
Satisfaction about health status
Satisfied 1.00 (reference) 1.00 (reference)
Rather satisfied 2.09 (1.29-3.40) 2.11 (1.30-3.41)
Rather unsatisfied 4.96 (3.06-8.03) 4.49 (2.75-7.33)
Unsatisfied 10.31 (5.60-19.00) 10.58 (5.23-21.37)
P for trend <0.001 <0.001
Support from superiors Yes 1.00 (reference) 1.00 (reference)
So-so 2.64 (1.73-4.03) 1.73 (1.16-2.56)
Little 4.33 (2.73-6.88) 2.31 (1.45-3.68)
No 6.30 (3.80-10.44) 3.51 (2.21-5.56)
P for trend <0.001 <0.001
Support from coworkers Yes 1.00 (reference) 1.00 (reference)
So-so 1.81 (1.28-2.56) 1.76 (1.30-2.39)
Little 4.47 (2.88-6.93) 3.64 (2.07-6.41)
No 5.73 (3.48-9.41) 1.95 (1.01-3.76)
P for trend <0.001 <0.001
Support from family or friends
Yes 1.00 (reference) 1.00 (reference)
So-so 1.99 (1.50-2.63) 1.98 (1.44-2.73)
Little 6.41 (3.99-10.31) 2.26 (1.18-4.31)
No 6.55 (3.49-12.28) 4.43 (1.36-14.47)
P for trend <0.001 <0.001
#: See Table 1.
ies on Japanese workers
23,30,31), but low compared with the results for our previous studies on Japanese junior college students
32,33)and studies on Japanese adolescents
34,35). Nakata et al. reported that the mean CES-D score of Japanese daytime workers was 12.2
30), whereas that of Japanese shift workers was 14.3
31). However, we did not investigate shift work. Some reports concluded that the CES-D score of females was higher than that of males
36-39)
. Similar results were noted in our study. The differ- ence (3.9 points) of the mean CES-D score between males and females in this study was similar to the 3.6 points reported in the data of Pikhart et al
39).
The CES-D score was higher for younger workers than for older ones. In our previous survey of junior col- lege students
32,33), the CES-D score for younger persons had a tendency to be higher than that of older ones, and the incidence of major depression is known to be greatest
at about 40 years of age
40). Recently, however, there have been some reports in which depression occurred most fre- quently at about 25 years of age
40). Thus, it is important to further investigate the prevalence of the depressive state by age.
We used the LOC score as one measurement of cog- nitive style, and found that the score significantly corre- lated with depressive symptoms. This result was consis- tent with our previous studies on junior college stu- dents
32,33). Those with more external control in the LOC represented a greater percent of depressive persons aged 16 or older in the CES-D. Because the association remained significant even after adjusting for potential confounders, we interpreted this to mean that the LOC was independently associated with the CES-D. That is, those who attribute control of life events to external sources might be liable to suffer depressive symptoms.
Table 6 Odds ratios (ORs) and 95% confidence intervals (95% CIs) of high CES-D score (HCS#) adjusted for some potential con- founders* by logistic regression analysis for workers in Hokkaido.
Variables Male ORs (95% CIs) Female ORs (95% CIs)
Locus of control† 43 or under 5.14 (3.13-8.43) 2.71 (1.56-4.69)
44〜47 2.64 (1.64-4.27) 2.34 (1.40-3.93)
48〜52 2.17 (1.37-3.45) 1.20 (0.75-1.92)
53 or over 1.00 (reference) 1.00 (reference)
P for trend <0.001 <0.001
Satisfaction about job Satisfied 1.00 (reference) 1.00 (reference)
Rather satisfied 1.77 (0.97-3.24) 2.09 (0.99-4.39)
Rather unsatisfied 3.65 (1.90-6.99) 3.40 (1.55-7.48)
Unsatisfied 4.07 (1.63-10.19) 3.89 (1.54-8.81)
P for trend <0.001 0.005
Satisfaction about office environment
Satisfied 1.00 (reference) 1.00 (reference)
Rather satisfied 1.88 (0.96-3.67) 1.06 (0.54-2.10)
Rather unsatisfied 2.96 (1.48-5.91) 1.89 (0.93-3.84)
Unsatisfied 3.92 (1.70-9.04) 2.14 (0.95-4.84)
P for trend 0.002 0.012
Satisfaction about home atmosphere
Satisfied 1.00 (reference) 1.00 (reference)
Rather satisfied 2.08 (1.44-3.00) 1.79 (1.23-2.63)
Rather unsatisfied 4.93 (2.83-8.61) 2.67 (1.57-4.54)
Unsatisfied 6.90 (2.56-18.60) 12.87 (2.64-62.64)
P for trend <0.001 <0.001
Satisfaction about health status
Satisfied 1.00 (reference) 1.00 (reference)
Rather satisfied 2.07 (1.10-3.87) 1.97 (1.12-3.48)
Rather unsatisfied 3.87 (2.07-7.23) 2.83 (1.59-5.04)
Unsatisfied 6.27 (2.86-13.76) 9.12 (3.88-21.46)
P for trend <0.001 <0.001
* : Adjusted for age (quantitative variables), educational background (4 categories), each of the 11 companies, 6 lifestyle factors, psychi- atric consultation, 5 job-related variables, 3 coping styles (quantitative variables), severe stressor, and social supports.
†
: Categorized by quartiles.
# : See Table 1.
Takakura and Sakihara
34,37)reported a similar result in which there was an association between the CES-D and the LOC in their studies using the correlation coefficient as an index of association. Although there have been reports about the association between cognitive style and depressive symptoms that use the correlation coefficient as an index of association
34,37), there has been no report categorized as in our study. The odds ratio is better than the correlation coefficient for understanding the strength of association between cognitive style and depressive symptoms.
We assessed perceived satisfaction with the job, office environment, home atmosphere, and health status as one measurement of cognition for each item and quali- ty of life, and found that the measurement was signifi- cantly associated with depressive symptoms. Some investigations
12-15)have been conducted using perceived satisfaction when studying stress-related variables, and these studies indicated that the satisfaction variables were very strongly associated with stress-related factors.
However, we could not find any studies in which the indi- vidual's satisfaction with the office environment and home atmosphere as well as multiple satisfaction meas- urements were included. Although our questionnaire about perceived satisfaction was simple, we found that these variables had strong associations with depressive symptoms. However, because we did not investigate the actual occupational and domestic environments, it will be necessary to consider the association between each type of satisfaction and the concrete environment in the future.
Most of our results were consistent with previous reports about the associations of lifestyle factors
41-43), job- related variables
11,44), coping styles
25), and social supports
21-23)
with depressive symptoms. For instance, Ezoe and Morimoto
43)reported that a healthy lifestyle is conducive to better mental health, which was similar to our results.
For job-related variables, Fujigaki et al.
11)disclosed that job overload had a significant effect on the prevalence of depressive symptoms. Furthermore, in Japan there were some studies
9,44,45)conducted with a Job Content Questionnaire (JCQ) in which job demands, job control, including self determination and social support based on the Demand/Control model
19), were taken into account.
Kojima et al.
44)reported that depression was more fre- quent in those with low job control and low support as indicated by the JCQ. Kageyama et al.
25)reported that active coping was inversely associated with depression, whereas avoidance coping was positively associated with it. In addition, regarding social support, Iwata et al.
23)found that subjects who experienced poor relationships with a spouse and/or with their parents were more depressed, which was consistent with our results.
There are some limitations to our study. First, because this research was a cross-sectional study, we could not conclude that the associations between depres- sive symptoms and cognitive styles such as LOC and sat- isfaction were causal. Several other cohort studies report- ed the associations of life satisfaction or self-rated per- ceived health with suicide and mortality
12,46,47). When con- templating the effects of cognitive therapy on the relapse of depression
48)and people at high risk of depression
49,50), it is strongly suggested that cognitive bias might bring about depressive symptoms and depression.
Second, while the validity and reliability of measure- ments such as the CES-D, LOC, and Ozeki's coping style have been repeatedly reported in the literature
16-18,51), as has Cronbach's reliability coefficient alpha, which was also measured in this study, they might need to be assessed for other original measurements such as social supports and satisfaction. Third, because the subjects of this study were workers of 11 companies in Hokkaido, Japan, and were voluntary and limited by time, there is possibility of selection bias, particulary for the 11 companies selected from 5760 companies registered in the Hokkaido Occupational Promotion Center. Although medical or welfare works account for 12.5% of 5760 companies, they accounted for 37.2% of the subjects of this study.
Were we to conduct another study using the same design, we would request information about occupational health provisions and awareness of mental health problems when documents for recruitment are mailed to each respective personnel section, regardless of ultimate partic- ipation. Fourth, although we analyzed using two models differing in how they adjust for possible confounders, variables not investigated in this study such as actual working hours and shift work should be considered in a future study.
In conclusion, the associations between depressive
symptoms and lifestyle variables, psychiatric consulta-
tion, job-related variables, severe life events, coping
styles, and social supports were significant by univariate
analysis. Even after adjusting for these variables, signifi-
cant associations between depressive symptoms and cog-
nitive styles were maintained. In Japan, mental health is
one of the most important issues for occupational health,
and it is necessary to prepare for preventive intervention
such as cognitive therapy. Thus, further studies of various
groups drawn from the general population are needed to
verify the relationship between cognitive style and depression.
References
1 Watanabe Y. Stress vulnerability as a predisposing factor of depression. Seishin Igaku (Clin Psychiatry) 2000; 42: 473- 480. (in Japanese)
2 Sato M, Yoshida S, Numachi Y. The etiology and prophy- laxis of schizophrenia based on the stress-vulnerability hypothesis. Rinsho Seishin Igaku (Jpn J Clin Psychiatry) 2000; 29: 375-380. (in Japanese)
3 Ishikawa T. Stress and psychosomatic correlation. Nippon Ishikai Zasshi (J Jpn Med Assoc) 2001; 126: 345-348. (in Japanese)
4 Kuroki N. Recent trends in work-related compensation involving job-related suicide and mental disease. Seishin Shinkeigaku Zasshi 2002; 104: 1215-1227. (in Japanese) 5 Aldwin CM. Stress, Coping, and Development. New York:
The Guilford Press; 2000.
6 Lazarus RS, Folkman S. Stress, Appraisal and Coping.
New York: Springer; 1984.
7 Hurrell JJ, McLaney MA. Exposure to job stress: a new psychometric instrument. Scand J Work Environ Health 1988; 14: 27-28.
8 Beck AT. The past and future of cognitive therapy. J Psychother Pract Res 1997; 6: 276-284.
9 Kawakami N, Haratani T, Kobayashi F, Ishizaki M, Hayashi T, Fujita O, Aizawa Y, Miyazaki S, Hiro H, Masumoto T, Hashimoto S, Araki S. Occupational class and exposure to job stressors among employed men and women in Japan. J Epidemiol 2004; 14: 204-211.
10 Kawakami N, Haratani T, Araki S. Effects of perceived job stress on depressive symptoms in blue-collar workers of an electrical factory in Japan. Scand J Work Environ Health 1992; 18: 195-200.
11 Fujigaki Y, Asakura T, Haratani T. Work stress and depres- sive symptoms among Japanese information systems man- agers. Ind Health 1994; 32: 231-238.
12 Koivumaa-Honkanen H, Honkanen R, Viinamaki H, Heikkila K, Kaprio J, Koskenvuo M. Life satisfaction and suicide: a 20-year follow-up study. Am J Psychiatry 2001;
158: 433-439.
13 Al-Windi A. The relations between symptoms, somatic and psychiatric conditions, life satisfaction and perceived health.
A primary care based study. Health Qual Life Outcomes 2005; 3: 28-36.
14 Faragher EB, Cass M, Cooper CL. The relationship between job satisfaction and health: a meta-analysis. Occup
Environ Med 2005; 62: 105-112.
15 Virtanen V, Kivimaki M, Elovainio M, Vahtera J. Selection from fixed term to permanent employment: prospective study on health, job satisfaction, and behavioral risks. J Epidemiol Community Health 2002; 56: 693-699.
16 Kambara N, Highchi K, Shimizu N. Reliability and validity of Locus of Control scale. Kyoiku Shinrigaku Kenkyu (Jpn J Educ Psychol) 1982; 30: 302-307.
17 Ozeki Y, Haraguchi M, Tsuda A. Analysis of covariance structures of psychological stress process for college stu- dents. Jpn J Health Psychol 1994; 7: 20-36.
18 Shima S, Shikano T, Kitamura T, Asai M. New self-rating scales for depression. Clin Psychiatry 1985; 27: 717-723.
19 Karasek R. Demand/control model: a social, emotional, and physiological approach to stress risk and active behaviour development. In: Stellman JM, Editor-in-Chief.
Encyclopaedia of occupational health and safety, 4th edition.
Geneva: International Labour Office; 1998. p. 34. 6-34. 15.
20 Homes TH, Rahe RH. The Social Readjustment Rating Scale. J Psychosom Res 1967; 11: 213-218.
21 Bromberger JT, Harlow S, Avis N, Karavitz HM, Cordal A.
Racial/ethnic differences in the prevalence of depressive symptoms among middle-aged women: the Study of Women's Health Across the Nation (SWAN). Am J Public Health 2004; 94: 1378-1385.
22 Lee Y, Shinkai S. Correlates of cognitive impairment and depressive symptoms among older adults in Korea and Japan. Int J Geriatr Psychiatry 2005; 20: 576-586.
23 Iwata N, Okuyama Y, Kawakami Y, Saito K. Prevalence of depressive symptoms in a Japanese occupational setting: a preliminary study. Am J Public Health 1989; 79: 1486- 1489.
24 Rotter JB. Generalized expectancies for internal versus external control of reinforcement. Psychol Monogr 1966;
80: 1-28.
25 Kageyama T, Kobayashi T, Kawashima M, Kanamaru Y.
Development of the Brief Scales for Coping Profile (BSCP) for workers: basic information about its reliability and valid- ity. Sangyo Eiseigaku Zasshi 2004; 46: 103-14. (in Japanese)
26 Radoloff LS. The CES-D Scale: A self-report depression scale for research in the general population. Appl Psychol Meas 1977; 1: 385-401.
27 Osterlind SJ, Tabachnick BG. SPSS for Windows Workbook. 4 th ed: Using Multivariate Statistics. Needham Heights: Allyn and Bacon; 2001.
28 Grimm LG, Yarnold PR. Reading and Understanding
Multivariate Statistics. Washington: American
Psychological Association; 1995.
29 Tango T, Yamaoka K, Takagi H. Logistic Kaiki Bunseki (Logistic Regression Analysis). Tokyo: Asakura-Shoten;
1997. (in Japanese)
30 Nakata A, Haratani T, Takahashi M, Kawakami N, Arito H, Kobayashi F, Araki S. Job stress, social support, and preva- lence of insomnia in a population of Japanese daytime workers. Soc Sci Med 2004; 59: 1719-1730.
31 Nakata A, Haratani T, Takahashi M, Kawakami N, Arito H, Kobayashi F, Fujioka Y, Fukui S, Araki S. Association of sickness absence with poor sleep and depressive symptoms in shift workers. Chronobiol Int 2004; 21: 899-912.
32 Kobayashi K, Sonoda T, Mori M. The relationship between depressive symptomatology and some relevant factors: a pilot survey of adolescent students. Sapporo Igaku Zasshi (Sapporo Med J) 2003; 72: 49-57. (in Japanese)
33 Kobayashi K, Kobayashi R, Kubo S, Sonoda T, Mori M.
Depressive symptomatology and some relevant factors:
investigations at a junior college in Hokkaido, Japan.
Nippon Koshu Eisei Zasshi (Jpn J Public Health) 2005; 52:
55-65. (in Japanese)
34 Takakura M, Sakihara S. Psychosocial correlates of depres- sive symptoms among Japanese high school students. J Adolesc Health 2001; 28: 82-89.
35 Iwata N, Buka S. Race/ethnicity and depressive symptoms:
A cross-cultural/ethnic comparison among university stu- dents in East Asia, North and South America. Soc Sci Med 2002; 55: 2243-2252.
36 Rosal MC, Ockene IS, Ockene JK, Barrett SV, Ma Y, Hebert JR. longitudinal study of students' depression at one medical school. Acad Med 1997; 72: 542-546.
37 Takakura M, Sakihara S. Gender differences in the associa- tion between psychosocial factors and depressive symptoms in Japanese junior high school students. J Epidemiol 2001;
10: 383-391.
38 Allison S, Roeger L, Martin G, Keeves J. Gender differ- ences in the relationship between depression and suicidal ideation in young adolescents. Aust N Z J Psychiatry 2001;
35: 498-503.
39 Pikhart H, Bobak M, Pajak A, Malyutina S, Kubinova R, Topor R, Debakova H, Nikitin Y, Marmot M. Psychosocial factors at work and depression in three countries of Central and Eastern Europe. Soc Sci Med 2004; 58: 1475-1482.
40 Noguchi T, Yamada N. Epidemiology in mood disorders.
Rinsho Seishin Igaku 2000; 29: 823-827. (in Japanese) 41 Rabois D, Haaga DAF. Cognitive coping, history of depres-
sion, and cigarette smoking. Addict Behav 1997; 22: 789- 796.
42 Breslau N, Peterson EL, Schultz LR, Chilcoat HD, Andreski P. Major depression and stages of smoking: a longitudinal
investigation. Arch Gen Psychiatry 1998; 55: 161-166.
43 Ezoe S, Morimoto K. Behavioral lifestyle and mental health status of Japanese factory workers. Prev Med 1994; 23: 98- 105.
44 Kojima M, Senda Y, Nagaya T, Tokudome S, FurukawaT.
Alexithymia, depression and social support among Japanese workers. Psychother Psychosom 2003; 72: 307-314.
45 Kawakami N, Kobayashi F, Araki S, Haratani T, Furui H.
Assessment of job stress dimensions based on the job demands-control model of employees of telecommunication and electric power companies in Japan: reliability and valid- ity of the Japanese version of the job content questionnaire.
Int J Behav Med 1995; 2: 358-375.
46 Kaplan GA, Goldberg DE, Everson SA, Cohen RS, Salonen R, Tuomilehto J, Salonen J. Perceived health status and morbidity and mortality: evidence from the Kuopio Ischaemic Heart Disease Risk Factor Study. Int J Epidemiol 1996; 25: 259-265.
47 Heistaro S, Jousilahti P, Lahelma E, Vartiainen E, Puska P.
Self-rated health and mortality: a long-term prospective study in eastern Finland. J Epidemiol Community Health 2001; 55: 227-232.
48 Ludman E, Von Korff M, Katon W, Lin E, Simon G, Walker E, Unutzer J, Bush T, Wahab S. The design, imple- mentation, and acceptance of a primary care-based interven- tion to prevent depression relapse. Int J Psychiatr Med 2000; 30: 229-245.
49 Clarke GN, Hawkins W, Murphy M, Sheeber LB, Lewinsohn PM, Seeley JR. Targeted prevention of unipolar depressive disorder in an at-risk sample of high school ado- lescents: a randomized trial of a group cognitive interven- tion. J Am Acad Child Adolesc Psychiatry 1995; 34: 312- 321.
50 Beardslee WR, Gladstone TR, Wright EJ, Cooper AB. A family-based approach to the prevention of depressive symptoms in children at risk: evidence of parental and child change. Pediatrics 2003; 112: 119-131.
51 Roberts RE, Andrews JA, Lewinsoh PM, Hops H.
Assessment of depression in adolescents using the Center for Epidemiologic Studies Depression Scale. Psychol Assess 1990; 2: 122-128.
Address for correspondence:
Kota Kobayashi, MD
Department of Public Health, Sapporo Medical University School of Medicine, South 1, West 17, Chuo-ku, Sapporo 060- 8556 Japan
Email: [email protected]
Tel: 011-611-2111 (2742)
Fax: 011-641-8101
北海道の労働者における抑うつ症状と 認知方策および満足度との関係
小 林 幸 太 1 ), 三 宅 浩 次 2 ), 岡 野 五 郎 3 ), 森 満 1 )
1)札幌医科大学医学部公衆衛生学講座(主任 森 満 教授)
2)北海道産業保健推進センター
3)札幌医科大学医学部運動科学教室
近年日本では,うつ病,うつ状態,および自殺の増加が,
特に労働現場において社会問題化してきており,予防介入 が必要とされる.それ故本調査は,抑うつ症状と認知方策,
その他の要因との関係を検討し,精神保健の予防介入の手 がかりを見出すために企画実行された.