Perinatal Factors Affecting Serum Hepcidin Levels in Low-Birth-Weight Infants
Kenji Ichinomiyaa, bKenichi Maruyama aTakahiro Inoue b Aya Koizumi a, b Fumitaka Inouea Kazuyo FukudaaYu YamazakiaHirokazu Arakawab
aDepartment of Neonatology, Gunma Children’s Medical Center, and b Department of Pediatrics, Gunma University Graduate School of Medicine, Gunma , Japan
Keywords
Neonate ・ Prematurity ・ Iron ・ Cord blood ・ Inflammation ・ Hypoxia ・ Erythropoiesis
Abstract
Background: Hepcidin, an iron-regulatory hormone, plays a key role in preventing iron overload.
Few studies have investigated the regulation of hepcidin in low-birth-weight (LBW) infants who are vulnerable to iron imbalance. Objectives: To identify perinatal factors associated with serum hepcidin levels in LBW infants. Methods: Ninety-two LBW infants with a median gestational age (GA) of 32.6 weeks and birth weight of 1,587 g were prospectively enrolled. Serum hepcidin-25 (Hep25) levels were measured from umbilical cord blood using liquid chromatography-tandem mass spectrometry. The relationship between Hep25 levels and prematurity or other possible hepcidin-regulatory factors was evaluated. Results: The median Hep25 level was 7.3 ng/mL (interquartile range: 2.85–16.38). log(Hep25) correlated with birth weight ( r = 0.229, p = 0.028), log(interleukin-6 [IL-6]) ( r = 0.408, p < 0.001), log(erythropoietin) ( r = –0.302, p = 0.004),
transferrin saturation ( r = 0.29, p = 0.005), soluble transferrin receptor ( r = –0.500, p < 0.001), and log(ferritin) ( r = 0.696, p < 0.001). Serum iron and hemoglobin levels did not correlate with log(Hep25). Hep25 levels were higher among infants with chorioamnionitis and infants born vaginally and lower among infants born to mothers with pregnancy-induced hypertension than among infants without the respective characteristics. Stepwise multiple linear regression analysis confirmed the significant association of log(Hep25) with GA, log(IL-6), log(erythropoietin), and soluble transferrin receptor. Conclusions: Among LBW infants, GA, IL-6, erythropoietin, and soluble transferrin receptor were associated with Hep25 levels. Therefore, prematurity, inflammation, hypoxia, and erythropoietic activity may be important perinatal factors that affect hepcidin levels.
Introduction
Although iron is an essential element for normal growth and health, an overload of iron can cause potentially harmful effects due to its pro-oxidative property. In premature infants who are
vulnerable to iron imbalances [1–3] , iron overload has been associated with adverse outcomes including bronchopulmonary dysplasia [4] , retinopathy of prematurity [5] , and necrotizing enterocolitis [6] . Therefore, prevention of iron overload in these infants would decrease the complications of premature birth and, consequently, improve their long-term outcomes.
Clarification of iron regulation in premature infants is a necessary first step toward implementing preventions strategies.
Hepcidin, a small 25-amino acid peptide predominantly synthesized by the liver, is a hormone that negatively regulates iron levels [7] . Hepcidin reduces intestinal absorption of iron and the release of iron from the reticuloendothelial system through its induction of the degradation of ferroportin, which is an exporter of cellular iron into the blood. Therefore, the activity of hepcidin decreases serum levels of iron. Conversely, insufficient production of hepcidin results in an increase in the volume of free iron and, therefore, a consequent increase in oxidative stress that is the root cause of various complications associated with prematurity [8] . Therefore, sufficient production of hepcidin is necessary to meet the demands of systemic iron metabolism in premature infants.
Recent studies [9, 10] have shown an upregulation of hepcidin levels with increased iron levels and inflammation, with erythropoiesis and hypoxia resulting in downregulation of hepcidin. To date, however, only a few studies have investigated the association between hepcidin levels and these conditions in premature infants who are often exposed to various perinatal factors
associated with inflammation and hypoxia [11, 12] . Moreover, the influence of prematurity on hepcidin levels remains unclear. Therefore, the aim of our study was to clarify the perinatal factors affecting serum hepcidin levels in premature infants.
Methods Study Subjects
This prospective observational study was conducted at a single tertiary care perinatal center (Gunma Children’s Medical Center, Shibukawa, Japan) between July 2014 and July 2015. Infants with low birth weight (LBW) admitted to the neonatal intensive care unit immediately after birth were eligible. Infants with a major anomaly, chromosomal abnormality, or other congenital diseases (e.g., hematological disease or inborn error of
metabolism) were excluded. Written informed consent was obtained from the parents of all infants according to a protocol approved by the Institutional Review Board. Demographic and clinical data were collected
prospectively from maternal and infant medical records. We used the following clinical definitions.
Pregnancy-induced hypertension was defined as new-onset hypertension with proteinuria or edema. Small for gestational age was defined as a birth weight under the 10th percentile of the population reference birth weight [13] . Chorioamnionitis was defined from placental histology, using Blanc’s criteria [14] . Nonreassuring fetal status was diagnosed by a persistent bradycardia or recurrent decelerations in the heart rate.
Laboratory Analysis
At the time of delivery, umbilical cord blood was collected, via syringe aspiration from the umbilical artery, for blood gas analysis (Stat Profile CCX; Nova Biomedical, Waltham, MA, USA) and from the umbilical vein for other laboratory analyses. To collect serum, the umbilical venous sample was clotted at room temperature and subsequently centrifuged for 10 min at 3,000 rpm within a few hours of delivery, and the serum was stored at – 80 ° C until analysis. Serum hepcidin-25 (Hep25), the bioactive form of hepcidin, was measured using a liquid chromatography-tandem mass spectrometry assay (MCProt Biotechnology, Kanazawa, Japan), based on previously described methods [15] . Serum levels of interleukin- 6 (IL-6) (Human IL-6 CLEIA Fujirebio;
Fujirebio, Tokyo, Japan) and erythropoietin (EPO) (Access EPO, Beckman Coulter, Tokyo, Japan) were measured by chemiluminescent enzyme immunoassay. Soluble transferrin receptor (sTfR) was measured by Luminex Assay (R&D Systems, Minneapolis, MN, USA). Duplicate measurements were performed for all cytokines in each sample. Serum iron, total iron-binding capacity, and ferritin were measured with an automated analyzer (JCA-BM6050; JEOL, Tokyo, Japan). The percent transferrin saturation (TS) was
calculated as 100 times the serum level of iron divided by the total iron-binding capacity. As part of our routine clinical testing, an arterial blood sample taken within 2 h of delivery was sent for complete blood counts (Sysmex XS-500i; Sysmex, Kobe, Japan) and C-reactive protein (JCA-BM6050).
Statistical Analysis
The median and interquartile ranges (IQR) were calculated for continuous variables, with counts and percentages calculated for nominal parameters. The normality of the data distribution was assessed using the Kolmogorov-Smirnov test. Correlations were tested between continuous variables with Pearson or Spearman rank correlation, as appropriate for the distribution of the data. For each characteristic, univariate
between-group comparisons were made using the Mann-Whitney U test. The logarithmic transformations of Hep25, IL-6, EPO, ferritin, and lactate were used in order to stabilize the variance of these measures. The association of hepcidin levels and immaturity was evaluated using a stepwise multiple linear regression model, controlling for confounding variables. Continuous variables with significant correlations to the log(Hep25) and gestational age (GA) were selected for the multivariate linear regression, with the exception of ferritin which is thought to be upregulated as the result of stimulating effect of hepcidin [16] . A twosided p value of <0.05 was considered statistically significant for all tests, and all statistical analyses were performed using the SPSS, version 23.0 (IBM SPSS Japan, Tokyo, Japan).
Results
Study Population
Among the 105 eligible infants, blood samples could not be collected in 6 infants, and informed consent could not be obtained for 7. Therefore, our study group consisted of 92 Japanese infants, with a median GA of 32.6 weeks (IQR: 26.3–35.6) and a median birth weight of 1,587 g (IQR:
817–1,951). Relevant maternal and infant characteristics of our study group are summarized in
Table 1 .
Hep25 and Perinatal Factors
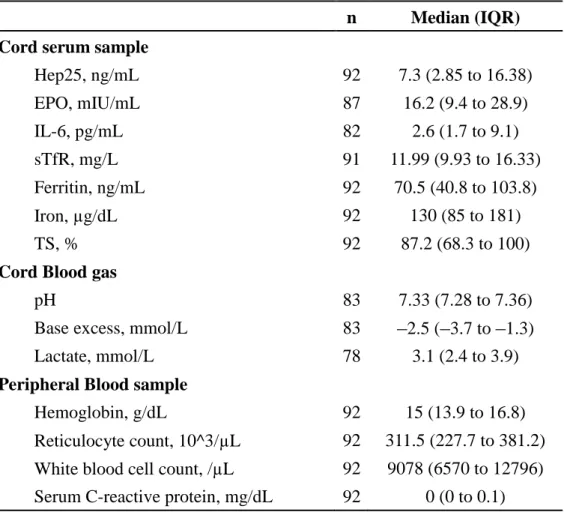
The median Hep25 level was 7.3 ng/mL (IQR: 2.85–16.38). The summary data for iron indices and other measured variables are reported in Table 2 . All missing measurements were due to an insufficient sample volume of cord blood. Although a significant correlation between
log(Hep25) and birth weight ( r = 0.229, p = 0.028) was identified, there was no significant correlation between log(Hep25) and GA ( r = 0.162, p = 0.123; Fig. 1 ). Hep25 levels were higher among infants with chorioamnionitis and infants born vaginally, and lower among infants born to mothers with pregnancy-induced hypertension than among infants without these characteristics. There were no significant associations between Hep25 and sex, Apgar score at 5 min, small for gestational age, multiple gestation, nonreassuring fetal status, premature rupture of membranes of >24 h, or antenatal steroid administration ( Table 3 ).
Hep25 Correlations with Hematological and Biochemical Indices
log(Hep25) was positively correlated to log(IL-6) ( r = 0.408, p < 0.001), TS ( r = 0.29, p = 0.005), log(ferritin) ( r = 0.696, p < 0.001), and umbilical artery pH ( r = 0.221, p = 0.045), and negatively correlated to sTfR ( r = –0.500, p < 0.001) and log(EPO) ( r = –0.302, p = 0.004).
There were no significant correlations between the log(Hep25) and serum iron, hemoglobin, reticulocyte count, or C-reactive protein ( Table 4 ). A stepwise multiple linear regression analysis, including birth weight, GA, log(IL-6), log(EPO), sTfR, cord blood pH, and TS, identified GA, log(IL-6), log(EPO), and sTfR to be independently associated with log(Hep25).
GA was a strong predictor of log(Hep25), with a standardized β of 0.647 ( p < 0.001; Table 5 ).
Discussion
We measured cord blood Hep25 to identify the perinatal factors affecting serum hepcidin levels in premature infants, and found that GA was significantly associated with Hep25 levels, after adjusting for the major regulatory stimuli for hepcidin, in LBW infants. This finding suggests that hepcidin levels increase with maturity in these infants. In addition, we identified a significant association between Hep25 levels and IL-6, EPO, and soluble transferrin receptor levels, indicating that inflammation, hypoxia and erythropoietic activity are also important factors that affect hepcidin levels in LBW infants during the perinatal period.
In their investigation of hepcidin levels in neonates, Lorenz et al. [11] identified higher levels of hepcidin in the umbilical cord blood of infants born at term compared to that of preterm infants. However, Lorenz et al. did not include hypoxic or inflammatory factors as predictor variables in their multiple regression analysis. Moreover, infants born at term constituted nearly half of their study group. We revealed that GA is a significant factor affecting the hepcidin levels, after adjusting for hypoxic and inflammatory factors, in LBW infants.
In agreement with previous studies [16, 17] , we identified a strong association between levels
of hepcidin and inflammation in our cohort. Previous research has shown inflammation to be associated with an increase in hepcidin synthesis, this increase being mediated in large part by IL-6 signaling via the STAT-3 pathway [9] . To the best of our knowledge, the correlation between hepcidin and IL-6 has not been previously evaluated in LBW infants. Our finding of a significantly higher level of hepcidin among infants with chorioamnionitis or delivered
vaginally is indicative of a possible inflammatory response associated with infection or labor, which promotes inflammatory priming and cytokine activation [18] , a key perinatal factor underlying an increase in hepcidin levels in infants with LBW.
We identified a positive correlation between serum levels of ferritin and hepcidin. Although serum ferritin levels are typically an indicator of iron stores, ferritin is often elevated with systemic inflammation, in which case it is a reactant of an acute phase rather than a marker of iron overload [19] . As previously reported [16] , an inflammation-induced increase of hepcidin has a stimulating effect on ferritin production, due to an internalization and degradation of ferroportin. This stimulating effect causes elevated levels of cytoplasmic iron, leading to an increased expression of ferritin. Thus, ferritin levels in cord blood are likely to reflect the effect of hepcidin rather than providing an accurate measure of stored iron because prematurity is often associated with an inflammatory state. Therefore, we did not include ferritin as a predictor variable in multivariate analysis.
Collard [3] noted that if the hepcidin system is not well developed in premature infants, these infants would be unable to increase their hepcidin levels according to their physiological needs.
As a result, levels of plasma-free iron can reach an abnormally high level due to an excessive iron efflux from cytosol to plasma. Additionally, high levels of TS in premature infants are indicative of a poor iron-binding and antioxidant capacity [20] . Therefore, premature infants are at a high risk for iron-induced oxidative damage. Using multiple regression analysis, we identified a lower GA to be associated with lower levels of hepcidin. Therefore, there is a significant association between prematurity and hepcidin levels. Herzlich et al. [21] reported that hepcidin levels increased significantly in preterm infants who received red blood cell transfusion, which would increase hepcidin expression, at 1 month of age, compared to those who received a transfusion in less than 1 month. Our results indicate that the hepcidin system might be influenced by prematurity and that the capacity to synthesize sufficient levels of hepcidin to prevent excessive iron efflux in premature infants is insufficiently developed.
EPO is one of the important signals which decrease hepcidin synthesis [9] . We identified a negative correlation between EPO and hepcidin levels. Infants born to mothers with
pregnancy-induced hypertension and under hypoxic conditions, with relatively high EPO levels [22] or a low iron load, had significantly lower hepcidin levels than infants born with LBW without these additional risk factors. In adults, levels of hepcidin have been reported to decrease
with EPO administration [23] . Variation in hepcidin level has been used to assess effective erythropoiesis in patients with renal failure [24] . However, the effects of EPO administration as a treatment for anemia in prematurity on hepcidin levels have been less well studied in infants with LBW. It might be helpful to evaluate the efficacy and appropriate dosage of EPO
administration using variation in hepcidin levels as the outcome measure.
Serum levels of sTfR reflect cellular demands on iron and erythropoiesis [25] . Therefore, depleted stores of iron and enhanced erythropoiesis lead to increased sTfR synthesis. In contrast to ferritin levels, sTfR levels are unaffected by the state of inflammation [26] . We identified a significant negative correlation between hepcidin and sTfR levels, indicating that iron-deficient erythropoiesis may lead to a decrease in hepcidin synthesis in infants with LBW.
The association between hepcidin levels and GA identified by multivariate analysis was not identified on univariate analysis. We speculate that this disparity between univariate and multivariate results can be explained by the underlying cause of delivery, and specifically the presence of inflammation or hypoxia. In our cohort, GA was positively correlated with EPO and negatively with IL-6 (data not shown). These confounding factors might weaken, or even mask, the correlation between hepcidin levels and GA in univariate analysis.
To the best of our knowledge, our study is the first to report measurements of serum Hep25 using mass spectrometry in neonates. Previous studies [11, 27] measured hepcidin levels using enzyme-linked immunosorbent assays which cannot differentiate Hep25 from other inactive isoforms of hepcidin, such as hepcidin-20 and -22 [28] . This would explain the relatively low median hepcidin levels in our cohort compared to previously published levels. Our use of bioactive Hep25 provides a precise assessment of the serum hepcidin levels associated with the hepcidin-regulatory system.
Our study has several limitations that need to be acknowledged. As with any observational study, it was not possible for us to establish causality between hepcidin levels and clinical factors. Therefore, in order to examine these relationships, we measured key cytokines of hepcidin synthesis as a biochemical confirmation of clinical factors. Second, it is possible that our results were influenced by residual confounding variables, including maternal levels of hepcidin and other iron indices. According to Rehu et al. [27] , hepcidin levels in cord blood were associated with cord blood iron status, independent of maternal iron status. However, since the maternal-fetal iron transfer has not been fully characterized, it is worthwhile to consider the effect of maternal iron status on fetal-hepcidin levels. Third, we have only assessed major factors influencing hepcidin levels “at birth” in premature infants; future studies should attempt to examine the change of hepcidin levels “after birth” and to clarify the relationship between hepcidin and free iron levels, including their effects on neonatal morbidities or outcomes.
In conclusion, we contribute new information regarding the effects of prematurity and other
stimuli related to birth on hepcidin levels. Our findings improve the understanding of iron metabolism and provide direction for defining preventive and therapeutic measures that avoid the complications of iron imbalance in premature infants.
Acknowledgement
We are deeply grateful to Ms. S. Hayashi for technical assistance; to Dr. T. Takizawa, Dr. T. Fujiu, and Mr. A.
Aizawa for many useful suggestions; and to Dr. T. Takagi, Dr. T. Kyoya, and Dr. S. Kogure for support of the cord blood sample collection. We acknowledge support from the Medical Research Program of Gunma Prefectural Government and the Medical Research Program of Gunma Children’s Medical Center.
Disclosure Statement
The authors have no conflicts of interest to disclose.
References
1 Hirano K, Morinobu T, Kim H, Hiroi M, Ban R, Ogawa S, Ogihara H, Tamai H, Ogihara T: Blood transfusion increases radical promoting non-transferrin bound iron in preterm infants. Arch Dis Child Fetal Neonatal Ed 2001; 84:F188–F193.
2 Rao R, Georgieff MK: Iron therapy for preterm infants. Clin Perinatol 2009; 36: 27–42.
3 Collard KJ: Iron homeostasis in the neonate. Pediatrics 2009; 123: 1208–1216.
4 Korhonen P, Tammela O, Koivisto AM, Laippala P, Ikonen S: Frequency and risk factors in bronchopulmonary dysplasia in a cohort of very low birth weight infants. Early Hum Dev 1999; 54: 245–258.
5 Romagnoli C: Risk factors and growth factors in ROP. Early Hum Dev 2009; 85(suppl 10): S79–S82.
6 Collard KJ: Transfusion related morbidity in premature babies: possible mechanisms and implications for practice. World J Clin Pediatr 2014; 3: 19–29.
7 Park CH, Valore EV, Waring AJ, Ganz T: Hepcidin, a urinary antimicrobial peptide synthesized in the liver. J Biol Chem 2001; 276: 7806–7810.
8 Ganz T: Hepcidin, a key regulator of iron metabolism and mediator of anemia of inflammation. Blood 2003; 102: 783–
788.
9 Rishi G, Wallace DF, Subramaniam VN: Hepcidin: regulation of the master iron regulator. Biosci Rep 2015; 35:e00192.
10 Zhao N, Zhang AS, Enns CA: Iron regulation by hepcidin. J Clin Invest 2013; 123: 2337– 2343.
11 Lorenz L, Herbst J, Engel C, Peter A, Abele H, Poets CF, Westerman M, Franz AR: Gestational age-specific reference ranges of hepcidin in cord blood. Neonatology 2014; 106: 133–139.
12 Muller KF, Lorenz L, Poets CF, Westerman M, Franz AR: Hepcidin concentrations in serum and urine correlate with iron homeostasis in preterm infants. J Pediatr 2012; 160: 949–953.e2.
13 Itabashi K, Fujimura M, Kusuda S, Tamura M, Hayashi T, Takahashi T, Goishi K: The new standard of birth weight for gestational age (in Japanese). J Jpn Pediatr Soc 2011; 114: 1271–1293.
14 Blanc W: Perinatal disease; in Naeye RL, Kissane JM, Kaufman N (eds): Pathology of the Placenta, Membranes, and Umbilical Cord in Bacterial, Fungal, and Viral Infections in Man. Baltimore, Williams & Wilkins, 1981, pp 67–132.
15 Kaneko Y, Miyajima H, Piperno A, Tomosugi N, Hayashi H, Morotomi N, Tsuchida K, Ikeda T, Ishikawa A, Ota Y,
Wakusawa S, Yoshioka K, Kono S, Pelucchi S, Hattori A, Tatsumi Y, Okada T, Yamagishi M: Measurement of serum hepcidin-25 levels as a potential test for diagnosing hemochromatosis and related disorders. J Gastroenterol 2010; 45: 1163–
1171.
16 Ganz T, Nemeth E: Iron sequestration and anemia of inflammation. Semin Hematol 2009; 46: 387–393.
17 Nemeth E, Rivera S, Gabayan V, Keller C, Taudorf S, Pedersen BK, Ganz T: IL-6 mediates hypoferremia of inflammation by inducing the synthesis of the iron regulatory hormone hepcidin. J Clin Invest 2004; 113: 1271–1276.
18 Malamitsi-Puchner A, Protonotariou E, Boutsikou T, Makrakis E, Sarandakou A, Creatsas G: The influence of the mode of delivery on circulating cytokine concentrations in the perinatal period. Early Hum Dev 2005; 81: 387–392.
19 Nemeth E, Ganz T: Anemia of inflammation. Hematol Oncol Clin North Am 2014; 28: 671–681.
20 Silvers KM, Gibson AT, Russell JM, Powers HJ: Antioxidant activity, packed cell transfusions, and outcome in premature infants. Arch Dis Child Fetal Neonatal Ed 1998; 78:F214–F219.
21 Herzlich J, Litmanovitz I, Regev R, Bauer S, Sirota G, Steiner Z, Arnon S: Iron homeostasis after blood transfusion in stable preterm infants – an observational study. J Perinat Med 2016; 44: 919–929.
22 Teramo KA, Widness JA: Increased fetal plasma and amniotic fluid erythropoietin concentrations: markers of intrauterine hypoxia. Neonatology 2009; 95: 105–116.
23 Ashby DR, Gale DP, Busbridge M, Murphy KG, Duncan ND, Cairns TD, Taube DH, Bloom SR, Tam FW, Chapman R, Maxwell PH, Choi P: Erythropoietin administration in humans causes a marked and prolonged reduction in circulating hepcidin. Haematologica 2010; 95: 505–508.
24 Honda H, Kobayashi Y, Onuma S, Shibagaki K, Yuza T, Hirao K, Yamamoto T, Tomosugi N, Shibata T: Associations among erythroferrone and biomarkers of erythropoiesis and iron metabolism, and treatment with longterm
erythropoiesis-stimulating agents in patients on hemodialysis. PLoS One 2016; 11: e0151601.
25 Infusino I, Braga F, Dolci A, Panteghini M. Soluble transferrin receptor (sTfR) and sTfR/log ferritin index for the diagnosis of iron-deficiency anemia. A meta-analysis. Am J Clin Pathol 2012; 138: 642–649.
26 Skikne BS: Serum transferrin receptor. Am J Hematol 2008; 83: 872–875.
27 Rehu M, Punnonen K, Ostland V, Heinonen S, Westerman M, Pulkki K, Sankilampi U: Maternal serum hepcidin is low at term and independent of cord blood iron status. Eur J Haematol 2010; 85: 345–352.
28 Kroot JJ, Laarakkers CM, Geurts-Moespot AJ, Grebenchtchikov N, Pickkers P, van Ede AE, Peters HP, van
Dongen-Lases E, Wetzels JF, Sweep FC, Tjalsma H, Swinkels DW: Immunochemical and mass-spectrometry-based serum hepcidin assays for iron metabolism disorders. Clin Chem 2010; 56: 1570–1579.
Table 1 Clinical characteristics of the infants and their mothers Infants
Gestational age, weeks 32.6 (26.3 to 35.6)
Birth weight, g 1587 (817 to 1951)
Apgar score at 5 min (n = 91) 8 (7 to 9)
Male sex 38 (41)
Small for gestational age 38 (41)
Non-reassuring fetal status 36 (39)
Mothers
Age, years 31.5 (28 to 35)
Multiple gestation 30 (33)
Vaginal delivery 37 (40)
Antenatal steroid administration 33 (36) Premature rupture of membranes >24 h 20 (22) Pregnancy-induced hypertension 16 (17)
Chorioamnionitis 32 (35)
n = 92; data are shown as either the median (interquartile range) or n (%).
Table 2 Hematological and biochemical indices
n Median (IQR) Cord serum sample
Hep25, ng/mL 92 7.3 (2.85 to 16.38)
EPO, mIU/mL 87 16.2 (9.4 to 28.9)
IL-6, pg/mL 82 2.6 (1.7 to 9.1)
sTfR, mg/L 91 11.99 (9.93 to 16.33)
Ferritin, ng/mL 92 70.5 (40.8 to 103.8)
Iron, µg/dL 92 130 (85 to 181)
TS, % 92 87.2 (68.3 to 100)
Cord Blood gas
pH 83 7.33 (7.28 to 7.36)
Base excess, mmol/L 83
–2.5 (–3.7 to –1.3)Lactate, mmol/L 78 3.1 (2.4 to 3.9)
Peripheral Blood sample
Hemoglobin, g/dL 92 15 (13.9 to 16.8)
Reticulocyte count, 10^3/µL 92 311.5 (227.7 to 381.2) White blood cell count, /µL 92 9078 (6570 to 12796) Serum C-reactive protein, mg/dL 92 0 (0 to 0.1)
IQR, interquartile range; Hep25, hepcidin-25; EPO, erythropoietin; sTfR, soluble
transferrin receptor; IL-6, interleukin-6; TS, transferrin saturation.
Table 3 Associations between Hep25 and clinical characteristics
n Median Hep25(IQR), ng/mL r p
Infants
GA, weeks
192 0.162 0.123
Birth weight, gm
192 0.229 0.028
Apgar score at 5min
191 0.064 0.545
Male sex
Yes 38 7.30 (1.60 to 13.60) 0.343
No 54 6.90 (3.50 to 18.40)
Small for gestational age
Yes 40 8.65 (1.85 to 16.38) 0.804
No 52 5.85 (3.27 to 14.85)
Non–reassuring fetal status
Yes 36 11.80 (3.37 to 19.35) 0.194
No 56 5.90 (2.85 to 12.12)
Mothers
Age, year
192
–0.0810.441
Multiple gestation
Yes 30 5.75 (1.80 to 9.65) 0.057
No 62 8.70 (3.40 to 20.98)
Vaginal delivery
Yes 37 11.70 (5.10 to 24.40) 0.007
No 55 5.00 (1.80 to 11.80)
Antenatal steroid administration
Yes 33 7.90 (3.40 to 21.10) 0.466
No 59 6.10 (2.65 to 14.00)
Premature rupture of membrane
>24 h
Yes 20 5.95 (4.00 to 30.93) 0.213
No 72 7.65 (2.05 to 14.40)
PIH
Yes 16 3.15 (0.67 to 8.25) 0.016
No 76 7.95 (3.70 to 18.00)
CAM
Yes 32 10.75 (4.10 to 30.77) 0.017
No 60 5.90 (1.85 to 13.45)
Numerical variables compared using a Mann-Whitney U test.
1Pearson’s correlations tested against log (Hep25). Hep25, hepcidin-25; IQR, interquartile range; GA, gestational age; PIH, pregnancy-induced hypertension; CAM, chorioamnionitis
Table 4 Correlation between log (Hep25) and laboratory indices
n r p
Cord serum sample
Log (EPO) 87
–0.3020.004
Log (IL-6) 82 0.408 <0.001
sTfR 91
–0.500<0.001
Log (ferritin) 92 0.696 <0.001
Iron 92 0.119 0.259
TS 92 0.29 0.005
Cord blood gas
pH 83 0.221 0.045
Base excess 83 0.136 0.22
Log (lactate) 78
–0.1260.272
Peripheral blood sample
Hemoglobin 92 0.097 0.358
Reticulocyte count 92 0.017 0.872
White blood cell count 92 0.12 0.254 Serum C-reactive protein
192 0.131 0.212
1
Correlation evaluated using the Spearman rank sum test. Hep25, hepcidin-25; EPO,
erythropoietin
;IL-6, interleukin-6; sTfR
,soluble transferrin receptor
;TS
,transferrin
saturation.
Table 5 Result of stepwise multiple regression analysis for log (Hep25)
B (95% CI) β p
GA
0.083 (0.059 to 0.108) 0.647 < 0.001
Log (IL-6)
0.767 (0.585 to 0.950) 0.729 < 0.001
Log (EPO) –0.552 (–0.858 to –0.246) –0.3700.001
sTfR –0.033 (–0.057 to –0.009) –0.2630.007
Hep25, hepcidin-25; GA, gestational age; IL-6, interleukin-6; EPO, erythropoietin;
sTfR, soluble transferrin receptor; B, partial regression coefficient and
β, standardizedregression coefficient. Adjusted R
2= 0.625, Durbin–Watson 2.096. Variables included in the analysis were birth weight, GA, log (IL-6), log (EPO), sTfR, cord blood pH, and transferrin saturation.
Fig. 1. Correlation of log(Hep25) with birth weight ( r = 0.229, n = 92, p = 0.028) ( a ) and gestational age ( r = 0.162, n = 92, p = 0.123) ( b ). Hep25, hepcidin-25.