細菌の薬剤感受性検査は,ディスク拡散法と微量液体希釈 法にて行われている。さらに最小発育阻止濃度(Minimal In-
hibitory Concentration: MIC)の測定は寒天平板希釈法
1)と微 量液体希釈法2)により行われる。また,以前よりルシフェリ ン・ルシフェラーゼ試薬を用いた化学発光法にてATP
の測 定が報告されている3)。この方法を用いて菌体内のATP
を測 定することにより,有意な細菌尿のスクリーニング4)を行った り,食品中や消毒液中の細菌数の測定が行われてきた。ATP 測定による細菌数の測定は短時間で結果が得られ,細菌数の 評価には有用である。菌体内ATP
の測定により,抗菌薬中で の細菌の増殖を測定し,抗菌力の評価ができないか検討し,日 本化学療法学会標準法5)(以下標準法と略す)に準じた微量液 体希釈法による成績と比較,検討した。I. 材 料 と 方 法 1.供試菌株
菌株は,当教室に保存された臨床分離株
3
菌種45
株(methicillin-sensitive
Staphylococcus aureus
(MSSA)15
株,methicillin-resistantStaphylococcus aureus
(MRSA)15
株,Pseudomonas aeruginosa15
株)を用いた。2.供試薬剤と検討濃度
MSSA,MRSA
については,ampicillin(ABPC),piper-acillin
(PIPC),cefazolin(CEZ),cefotiam(CTM),cef-tazidime
(CAZ),minocycline
(MINO),amikacin
(AMK),arbekacin
(ABK),imipenem
(IPM),ofloxacin
(OFLX),clarithromycin
(CAM),vancomycin(VCM)の12
薬剤を用いた。濃度は
ABPC
とPIPC
では0.25〜16 µ g ! mL
の7
段階連続希釈系列,CEZ,CTM,CAZ,MINO,AMK,ABK
に つ い て は0.25〜32 µ g ! mL
の8
段 階 連 続 希 釈 系 列,IPM,OFLX,CAM,VCMでは0.125〜16 µ g ! mL
の8
段階連続希釈系列で行った。P. aeruginosaについて は,PIPC,CAZ,MINO,AMK,ABK,IPM,OFLX
の7
薬剤についてMSSA
と同様の濃度で検討した。96
穴マイ クロプレートに各種抗菌薬を含むミューラーヒントン培 地100 µ L
を分注し希釈系列を作成した。3.化学発光法による菌体内 ATP
の測定細 菌 を 含 む ミ ュ ー ラ ー ヒ ン ト ン 培 地
50 µ L
を と りHEPES buffer 50 µ L, ATP
抽出液50 µ L
を加え,5
分後に ルシフェリン・ルシフェラーゼ50 µ L
を加え,ルミカウ ンター1000
にて化学発光値(RLU)を測定した。4.薬剤感受性試験 1) 化学発光法
12
薬剤の希釈系列が作成された96
穴マイクロプレー トに供試菌5×10
4をイノキュレーター(長瀬産業)にて 接種し,4時間または6
時間培養後に各well
より50 µ L
菌液をとり,菌体内ATP
測定に用いた。2) 日本化学療法学会標準法
化学発光法に使用したものと同じ
96
穴マイクロプ レートを使用し,供試菌5×10
4をイノキュレーター(長 瀬産業)にて接種し,35℃ にて 18〜24
時間培養し,肉眼 にて混濁,沈殿物を確認し,MICを決定した。【原著・基礎】
化学発光法を用いた菌体内
ATP
測定による薬剤感受性測定吉田 正樹1,2)・柴 孝也1,2)・細谷 龍男1)
1)東京慈恵会医科大学内科学講座*,2)同 感染制御部
(平成
16
年12
月13
日受付・平成17
年1
月21
日受理)ルシフェリン・ルシフェラーゼ試薬を用いた化学発光法は菌体内
ATP
を短時間で測定できる。この化 学発光法を用いた薬剤感受性検査も短時間で測定可能である。臨床分離株3
菌種45
株(MSSA 15株,MRSA 15
株,Pseudomonas aeruginosa15
株)を用いて,各種薬剤中の細菌の増殖および薬剤感受性検 査を測定し,標準法との比較を行った。MSSA
ではampicillin
のMIC
は化学発光法と標準法での一致率は60% と低く,さらに ofloxacin
では20% と低値であった。 Ampicillin
とofloxacin
を除く薬剤では高い一 致率を認めた。MRSA
では試験薬剤すべてにおいて高い一致率も認めた。P. aeruginosa
では一致率が低 かった。抗菌薬の種類,細菌の種類により標準法と化学発光法の一致率に違いが認められた。抗菌薬と 菌種を選べば,化学発光法による薬剤感受性検査は短時間に結果が得られ,標準法と一致率が高く,標 準法の代用となりうる。標準法との乖離は認められる菌種,薬剤もあり,実際に臨床検査として臨床像 に一致する検査法であるかはこれからの研究を待たなければならない。標準法より臨床経過を反映する 検査法になる可能性もあり期待される。Key words: chemiluminescent assay,ATP,Antibacterial activity
*東京都港区西新橋
3―25―8
10
410
310
210
1
10
410
310
210
1
10
410
310
210
1
Luminescence ( RLU )
ampicillin MIC 4 μ g/mL
amikacin MIC 32 μ g/mL
vancomycin MIC 1 μ g/mL
0 2 4 6 0 2 4 6 0 2 4 6
Time(hrs)
0.25 μ g/mL 4 μ g/mL
0.5 μ g/mL
8 μ g/mL 16 μ g/mL 32 μ g/mL
1 μ g/mL 2 μ g/mL
II. 結
果1.細菌数と化学発光値の相関
MSSA
をミューラーヒントン培地にて培養した菌液を 用いて2
倍の希釈系列を作成し,化学発光値を測定した ところ,細菌数が1 ! 2
6×6.76×107以上で菌量と化学発光 値 の 間 に は 相 関(R2=0.989)が 認 め ら れ た。同 様 にMRSA,P. aeruginosa
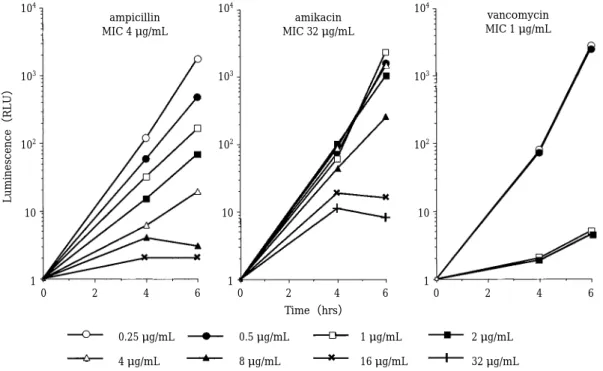
についても良好な相関を認めた。2.化学発光値の経時的変化
MSSA
をABPC,AMK,VCM
のそれぞれの濃度にて4
時間と6
時間接触後の菌体内ATP
量を測定した(Fig.1)
。ABPC
とAMK
では4
時間培養,6時間培養ともに濃 度依存的に菌の発育が抑制された。AMK
の6
時間培養で は16 µ g ! mL
と32 µ g ! mL
で 菌 の 発 育 が 抑 制 さ れ て い る。VCM
では4
時間培養と6
時間培養の両方で1 µ g ! mL
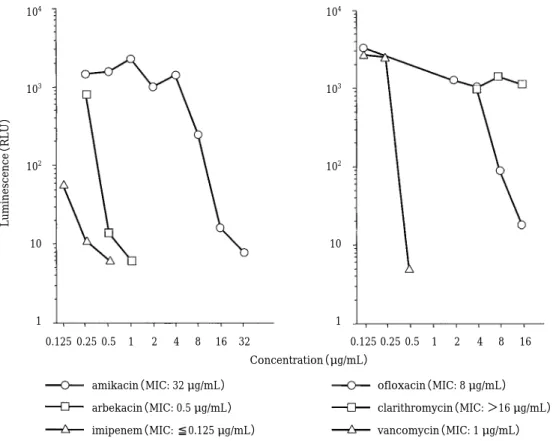
以上で抑制された。3.薬剤濃度と 6
時間培養後の菌体内ATP
の変化それぞれの薬剤存在下における
6
時間培養後の化学発 光値と薬剤濃度の関係をFigs. 2,3
に示した。薬剤濃度 が上昇するにつれて化学発光値は減少し,MICに近い値 では低い値を示す。ABPC,PIPC,CEZ,CTMでは2
倍 の濃度(1管)の違いで,化学発光値としては約20〜40 RLU
の違いであり濃度の上昇とともに徐々に低下する が,ABK,AMK,VCM,OFLXはある濃度までは高値を 示し,それ以上の濃度で急激に低下する。4.化学発光法と標準法による MIC
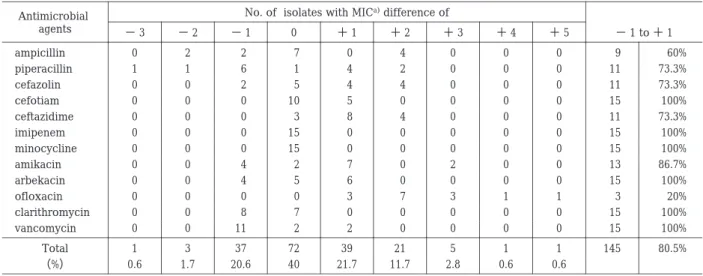
の一致率化学発光値が
30
以下に低下した最小濃度を化学発光 法によるMIC
と定義し,得られたMIC
と標準法より得 ら れ たMIC
の 一 致 率 をTable 1(MSSA)
,Table 2(MRSA)と
Table 3
(P. aeruginosa)に示した。化学発光 法によるMIC
が標準法によるMIC
より高くなる場合は プラスとなり,低くなる場合はマイナスで示されている。化学発光法と標準法による
MIC
を比較し,1管以内のず れを完全一致とした。MSSAではCTM,IPM,MINO,
ABK,CAM,VCM
は 一 致 率 が100% で あ り,AMK
は86.7%, PIPC, CEZ, CAZ
では73.3%, ABPC
は60.0%,
OFLX
は20.0% であった
(Table 1)。CEZ,CAZ,AMK,
OFLX
ではプラスの菌株が多く,化学発光法によるMIC
が標準法より高く出ていることがわかる。一 方,MRSAに つ い て は
PIPC,CTM,CAZ,ABK,
OFLX,CAM,VCM
は100% で あ り,ABPC,MINO,
AMK
は86.7%, CEZ, IPM
は73.3% であっ た
(Table 2)。APBC,IPM,MINO
ではマイナスの菌株が多く,化学発光法による
MIC
が標準法より低く出ており,AMKでは 高く出ている。MSSA
とMRSA
の一致率を比較すると,CTM,ABK,
CAM,VCM
は100% で一致しており,AMK
では86.7%
で同一,CEZでは
73.3% で同一であった。PIPC,CAZ
は73.3% と 100%,OFLX
は20% と 100% , ABPC
は60% と 86.7%,MINO
は100% と 86.7%,IPM
は100%
と
73.3% と感受性菌と耐性菌で乖離がみられた。全体で
は
MSSA
はのべ180
株中145
株(80.5%),MRSAはのべ180
株中166
株(92.2%)が一致した。P. aeruginosa
の一致率をみると,−1〜+1の完全一 致率は54.3% であり S. aureus
よ り 低 く,そ の 中 で はIPM,AMK,OFLX,の 一 致 率 が 73.3% と 高 か っ た。
MINO
は 一 致 率 は26.7% と 低 い 値 で あ っ た。PIPC,
Fig. 1. Time variations in bacterial ATP based on antimicrobial agent concentration.
10
410
310
210
1
10
410
310
210
1
Luminescence ( RLU )
0.25 0.5 1 2 4 8 16 0.25 0.5 1 2 4 8 16 32
Concentration (μ g/mL)
ampicillin (MIC: 4 μ g/mL)
piperacillin (MIC: 16 μ g/mL)
cefazolin (MIC: 32 μ g/mL)
cefotiam (MIC: 8 μ g/mL)
ceftazidime (MIC: 32 μ g/mL)
minocycline (MIC: 32 μ g/mL)
10
410
310
210
1
10
410
310
210
1
Luminescence ( RLU )
0.125 0.25 0.5 1 2 4 8 16 32 0.125 0.25 0.5 1 2 4 8 16
Concentration (μ g/mL)
amikacin (MIC: 32 μ g/mL)
arbekacin (MIC: 0.5 μ g/mL)
imipenem (MIC: ≦0.125 μ g/mL)
ofloxacin (MIC: 8 μ g/mL)
clarithromycin (MIC: >16 μ g/mL)
vancomycin (MIC: 1 μ g/mL)
Fig. 2. Bacterial ATP cultivated after 6 hrs under function from antimicrobial agent.
Fig. 3. Bacterial ATP that was cultivated after taking 6 hrs under the function from antimi-
crobial agent.
Table 1. Distribution of differences in MICs of 12 antimicrobial agents for 15 Methicillin-sensitive Staphylococcus aureus (MSSA)
determined by chemiluminescence ATP assay versus standard broth microdilution
− 1 to + 1 No. of isolates with MIC
a)difference of
Antimicrobial
agents − 3 − 2 − 1 0 + 1 + 2 + 3 + 4 + 5
60%
9 0
0 0
4 0
7 2
2 0
ampicillin
73.3%
11 0
0 0
2 4
1 6
1 1
piperacillin
73.3%
11 0
0 0
4 4
5 2
0 0
cefazolin
100%
15 0
0 0
0 5
10 0
0 0
cefotiam
73.3%
11 0
0 0
4 8
3 0
0 0
ceftazidime
100%
15 0
0 0
0 0
15 0
0 0
imipenem
100%
15 0
0 0
0 0
15 0
0 0
minocycline
86.7%
13 0
0 2
0 7
2 4
0 0
amikacin
100%
15 0
0 0
0 6
5 4
0 0
arbekacin
20%
3 1
1 3
7 3
0 0
0 0
ofloxacin
100%
15 0
0 0
0 0
7 8
0 0
clarithromycin
100%
15 0
0 0
0 2
2 11
0 0
vancomycin
80.5%
145 1
1 5
21 39
72 37
3 1
Total
0.6 0.6
2.8 11.7
21.7 40
20.6 1.7
(%) 0.6
a)
Zero indicates the number of isolates for which MICs were identical: − 1, + 1, ect. Indicate ± log2 dilution differences.
Table 2. Distribution of differences in MICs of 12 antimicrobial agents for 15 Methicillin-resistant Staphylococcus aureus (MRSA) determined by chemiluminescence ATP assay versus standard broth microdilution
− 1 to + 1 No. of isolates with MIC
a)difference of
Antimicrobial
agents − 3 − 2 − 1 0 + 1 + 2 + 3
86.7%
13 0
0 0 7
6 2
0 ampicillin
100%
15 0
0 0 12
3 0
0 piperacillin
73.3%
11 0
0 0 10
1 4
0 cefazolin
100%
15 0
0 0 9
6 0
0 cefotiam
100%
15 0
0 0 12
3 0
0 ceftazidime
73.3%
11 0
0 2 3
6 4
0 imipenem
86.7%
13 0
0 0 2
11 2
0 minocycline
86.7%
13 0
2 4 1
8 0
0 amikacin
100%
15 0
0 2 10
3 0
0 arbekacin
100%
15 0
0 4 8
3 0
0 ofloxacin
100%
15 0
0 0 15
0 0
0 clarithromycin
100%
15 0
0 0 5
10 0
0 vancomycin
92.2%
166 0
2 12 94
60 12
0 Total
0 1.1 6.7
52.2 33.3
6.7
(%) 0
a)
Zero indicates the number of isolates for which MICs were identical: − 1, + 1, ect. Indicate ± log2 dilution differences.
Table 3. Distribution of differences in MICs of 7 antimicrobial agents for 15 Pseudomonas aeruginosa determined by chemiluminescence ATP assay versus standard broth microdilution
− 1 to + 1 No. of isolates with MIC
a)difference of
Antimicrobial
agents − 4 − 3 − 2 − 1 0 + 1 + 2 + 3 + 4 + 5
46.7%
7 0
0 0
8 3
4 0
0 0
0 piperacillin
26.7%
4 4
4 2
1 2
2 0
0 0
0 ceftazidime
73.3%
11 1
1 0
2 0
5 6
0 0
0 imipenem
26.7%
4 0
0 0
0 0
2 2
5 4
2 minocycline
73.3%
11 0
0 0
2 4
5 2
2 0
0 amikacin
60%
9 0
0 0
2 2
5 2
4 0
0 arbekacin
73.3%
11 0
0 2
2 3
4 4
0 0
0 ofloxacin
54.3%
57 5
5 4
17 14
27 16
11 4
2 Total
4.8 4.8
3.8 16.2 13.3
25.7 15.2
10.5 3.8
(%) 1.9
a)
Zero indicates the number of isolates for which MICs were identical: − 1, + 1, ect. Indicate ± log2 dilution differences.
CAZ,IPM,OFLX
ではプラスの菌株が多く,化学発光法 に よ るMIC
が 標 準 法 よ り 高 く 出 て い る の に 対 し てMINO
では低く出ている。III. 考
察菌体内には
ATP
が存在し,生菌数とATP
量が相関す るといわれている。それを利用し,バイオフィルム内の 細菌数の測定6)や抗菌薬のpostantibiotic effect
の測定7)に利用でき る と の 報 告 が あ る。ま た,ATP-biolumine-
scence
法を用いた結核菌8,9)やマイコバクテリウム10)の薬 剤感受性検査が報告されている。一般細菌に対する薬剤 感受性検査も行われ報告されている11〜14)。本研究においても
Fig. 1
に示されるように,抗菌薬の存在下における細菌数の増加を反映して
ATP
量の増加が認められた。化 学発光法では抗菌薬の存在下での菌数の測定が可能とな り,その測定に要する時間も短時間であり抗菌薬の効果 判定に有力な方法であると考えられた。6時間という短 時間においても濃度低下とともに菌数の増加が認められ た。β
―ラクタム系薬であるABPC,PIPC,CEZ,CTM,
CAZ,IPM
は濃度低下とともに徐々に増加している。これに対して
AMK,ABK,OFLX,VCM
はある濃度以下 になると急激に菌数が増加することがわかる(Figs. 2,3)
。MICの測定の標準法がある時間で肉眼的に判断して いるのに対して,化学発光法は微量の菌数を測定し,数 値化しているので,6時間以上経過した後に増加するも のについては標準法と乖離してしまう。一致率の低い菌種でも接種菌量を増加させることで従 来の方法との一致率が上昇したとの報告もある14)。ま た,メナジオン添加により一致率が上昇したとの報告も ある13)。しかし,標準法と化学発光法は検査の意味する ところが違うので,MIC測定との一致率ばかりにこだわ る必要がなく,MIC測定の標準法は
18〜24
時間の時点 での肉眼的に観察できる細菌の増殖であり,化学発光法 は6
時間でのATP
測定による細菌の増殖である。プラス の菌株は化学発光法での菌株の発育はみられるが,標準 法で検出できるまで菌株は増殖しない株であり,最初は ある菌量までは増殖したが,その後に増殖の速度が低下 した可能性がある。逆にマイナスの菌株は6
時間では発 育が化学発光法で検出されるまで達しないが,18〜24 時間では菌株が増殖するものであるといえる。抗菌薬存 在下での菌株の発育速度やどこまで発育するかによると 思われる。それゆえ,菌種によっては2
つの方法で測定 したMIC
は一致しないのは当然であると思われる。菌種 や薬剤により標準法との一致率には乖離を認めること は,今までにも報告されている11〜14)。腸球菌属に対するCEZ
のMIC
の一致率が35%,プロテウス属, Acinetobac- ter baumannii
でのMIC
の一致率が59%,46% と低い
との報告もある13)。フィラメント化した菌体が死滅する までに時間が掛かることが,一致率の低い原因であると いう報告もある11,13)。ブドウ球菌ではCAM
の一致率が70%,LVFX
の一致率が83.3% と他の薬剤より一致率が
低いとの報告12)があるが,われわれの結果では
MSSA,
MRSA
ともにCAM
の一致率は100% であり,MSSA
のOFLX
の一致率は20% と低かった。同じブドウ球菌であ
るMSSA
とMRSA
においても,一致率の近い薬剤と大き く異なった薬剤があり乖離していた。ABKやVCM
を除 いて,薬剤の耐性が増すに従って2
つの方法によるMIC
はよく一致しているように思われる。このことは高度耐 性菌の方が薬剤含有培地において安定した菌の発育をしており,
6
時間後と18〜24
時間後の一致率が高い可能性がある。
2
つの方法によるMIC
の一致率の報告は薬剤,菌種により差異があることは確かである。また,標準法 による薬剤感受性検査が抗菌薬の臨床効果として必ずし も反映されない場合もある。この短時間の菌量増加を測 定できる化学発光法による
MIC
のほうが臨床効果と相 関する可能性も考えられる。化学発光法による薬剤感受性検査は短時間に結果が出 る。抗菌薬と菌種を選べば,化学発光法による薬剤感受 性検査は短時間に結果が得られ,標準法と一致率が高く,
標準法の代用となりうる。標準法との乖離は認められる 菌種,薬剤もあり,実際に臨床検査として臨床像に一致 する検査法であるかはこれからの研究を待たなければな らない。標準法より臨床経過を反映する検査法になる可 能性もあり期待される。
文 献
1) National Committee for Clinical Laboratory Stan- dards: Approved standard M2-A6, M100-S8. Perform- ance standards for antimicrobial disk susceptibility tests. NCCLS, Wayne, PA, 1997
2) National Committee for Clinical Laboratory Stan- dards: Approved standard M7-A4, M100-S8. Methods for dilution antimicrobial susceptibility tests for bac- teria that grow aerobically. NCCLS, Wayne, PA, 1997 3) Lyman G E , DeVincenzo J P : Determination of pi-
cogram amounts of ATP using the luciferin-luciferase enzyme system. Analytical Biochemistry 21: 435〜443, 1967
4) Alexander D N, Ederer G M, Matsen J M: Evaluation of an adenosine 5 -triphosphate assay as a screening method to detect significant bacteriuria . Journal of Clinical Microbiology 3: 42〜46, 1976
5) 日本化学療法学会抗菌薬感受性測定法検討委員会:
微量液体希釈法による
MIC
測定法(微量液体希釈 法)。Chemother 38: 102〜105, 19906) Kumon H, Ono N, Iida M, et al: Combination effect of fosfomycin and ofloxacin against Pseudomonas grow- ing in a biofilm . Antimicrob Agents Chemother 39 : 1038〜1044, 1995
7) Mackenzie F M , Gould I M , Chapman D G , et al : Postantibiotic effect of meropenem on members of family Enterobacteriaceae determined by five meth- ods. Antimicrob Agents Chemother 38: 2583〜2589, 1994
8) Nilsson L E, Hoffner S E, Ansehn S: Rapid susceptibil-
ity testing of Mycobacterium tuberculosis by biolumi- nescence assay of mycobacterial ATP . Antimicrob Agents Chemother 32: 1208〜1212, 1988
9) 山崎利雄,佐藤直樹,山下研也,他:生物発光を用い
た結核菌の迅速薬剤感受性試験法(第IV
報):改良し たATP
法と参照法との比較。臨床病理51: 194〜200, 2003
10) Becker B, Lang H R M, Schimke D, et al: Evaluation of bioluminescence assay for rapid antimicrobial sus- ceptibility testing of Mycobacteria. Eur J Clin Micro- biol 4: 556〜561, 1985
11) Hattori N, Nakajima M, O hara K, et al: Novel Antibi- otic susceptibility tests by the ATP-Bioluminescence method using filamentous cell treatment. Antimicrob
Agents Chemother 42: 1406〜1411, 1998
12) Manome I, Ikedo M, Saito Y, et al: Evaluation of a novel automated chemiluminescencent assay system for antimicrobial susceptibility testing. J Clin Micro- biol 41: 279〜284, 2003
13) 小原忠博,上岡恵美,小勝負恭子,他:化学発光法を
用いた迅速薬剤感受性検査に関する臨床細菌学的検 討―ラピッドミル 栄研 の使用経験を含めて―。JpnJ Antibiot 55: 281〜290, 2002
14) 高倉るみ枝,有田健一,小原忠博,他:化学発光法を
用いたMRSA
の判定と薬剤感受性報告。感染症誌77:
654〜660, 2003
Antimicrobial susceptibility testing by chemiluminescence ATP assay Masaki Yoshida1,2), Kohya Shiba
1,2)and Tatsuo Hosoya
1)
1)