原 著 〔東女医大誌 第56巻 第1号頁 89∼99 昭和61年1月〕
サーモグラフィによる乳癌の診断に関する研究
東京女子医科大学 放射線医学教室(主任 オオ ハシ ヤス ピコ 大 橋 泰 彦 重田帝子教授) (受付 昭和60年10月26日)AStudy on the Diagnosis of Breast Cancer by Thermography
Yasuhiko OHASHI
Department of Radiology(Director:Prof. Akiko SHIGETA) Tokyo Women’s Medical College
Diagnostic accuracy of breast cancer by thermography remained unsatisfactory partly due to the absence of specific diagnostic criteria used to differentiate between normal and abnormal thermograms. In order to improve thermographic diagnosis, application of a computer to the quantitative analysis of breast thermograms has been undertaken, developing an on−1ine image processing system with reference to various diagnostic criteria such as areolar temperature(At), hot spot temperature(Ht), vein tem− perature(Vt), vein pattern(Vp), breast temperature(Brt)and edge sign(E).
ROC curves and information capacity of these criteria were calculated and it was found that Vp (index)was the best criterion and the single operating point giving maximum information capacity, on the ROC curve for Vp(index)showed a true−positive rate of 77.9(%and a false−positive rate of 27.3〔%. Finally, diagnostic criteria for malignancy on breast thermograms were established by combination of Vp(index)and other criteria, then true−positive rate and false−positive rate for the computer diagnosis were 85.6(殆and 30.9(%respectively.
The problem still remained that low diagnostic accuracy rate was observed in cancers small in size or in stage I, and high incidence of false−positive cases was observed in fibroadenoma or in papilloma.
緒 言 サーモグラフィは温度測定の技術として,工業 用センサーを始めとして,広く産業界で応用され ている技術である.
医学においては,1956年Lawsonによって
evaporographを用いて乳癌を画像として表現す ることに成功1)して以来,腫瘍の診断をはじめと して,循環障害の判定等に広く応用されて来た,1968年癌研究会附属病院において,BARNES
社製Thermograph M−1Aを導入した.以来,乳 癌の診断に対するサーモグラフィの可能性につい て,種々の検討を加えた. 方 法 1968年サーミスタ・ボロメータを検出器とするBARNES面出Thermograph M・1Aを導入した
が,同時にThermometerを導入し,絶対温度の測 定を行なった. サーモグラフィの施行にあたっては,それが温 度測定であるところがら,環境温の調整が不可欠 である.外乱の影響を遮断することはもちろん, 外気温は出来るだけ低くしたほうが温度パターン のコントラストを得るのにすぐれているとされる が,実際には約21℃に設定した. 乳房のサーモグラム撮影にあたっては,撮影部 を外気に露出し,15分間放置することによって着 衣の影響を除き,個人特有の温度パターンを表示 する. 撮:影体位については,臥位の方が体動の影響を受けずにすむが,この体位では鏡を使用しなけれ ぽならない場合が多く,そのために遠距離撮影と なってしまう.温度パターンを詳細に検討するた めに,坐位で行なうことにした. 撮影にあたっては,腋窩部のcross radiationを 避けるために,両上腕を挙上した. サーモグラム上の温度パターンは温度幅を狭く とるとより明らかとなるが,全体のパターンを 失ってしまう.そこで,まず広い温度幅のサーモ グラムを撮り,全体の輪郭を確認した後に,同じ 位置で温度幅を狭くし,より明瞭な温度パターン のサーモグラムを撮り,それらを重ねて高温域の 温度パターンを解析した2). 1973年,インジウム・アンチモンを検出器とし, 一層分解能が向上した,B本電子製サーモピュ アーMAを導入し,更に診断の向上を期した.本 装置では温度パターンがより一層明瞭にサーモグ ラム上に表示し得るようになっている. なお,サーモピュアーによって得られた温度情 報は,SONY三三データレコーダーDFR−2515に よって磁気テープに記録保存した. 磁気テープには,10℃の範囲での温度情報を記 録出来るので,生体の温度情報はすべてテープに 保存出来るのみならず,それらの情報を再生する 過程で種々の画像処理を行なうことが可能となっ ている. 本装置によるサーモグラムでは,血管パターン がより明瞭にとらえ得るようになり,診断にあ たっては,この血管パターンの解析に重点を置く こととした. 撮影にあたっては,広く血管パターンを把握す るために,正面像のみならず,左右の斜位像をも 加えることとした. 次に,サーモグラムにおいて得られる大量の温 度情報をより客観的に把握するために,コン ピューターの導入を試みた. 乳房サーモグラム処理システムのブロックダイ アグラムはFig.1に示す通りである3).すなわち, サーモビュァーMAとTOSBAC−40A(東芝製)を オンラインで結びサーモピュアーで検出した乳房 部の温度情報を対話形式で収集,画像表示,処理 Thermoviewer MA (JEOL) Data recorder (SONY) Interface Magnetic disk Printer TOSBAC・40A (Toshiba)
Hard copy unit
1
↓
Tektronix 4010 graphiC terminal
Fig.1Block diagram of breast themogram
processing SyStem およびファイリングを行なうシステムである. 収集データはすべてデータレコーダの磁気テー プにファイルしてあるが,必要に応じて磁気ディ スクにファイルする方法と,直接磁気ディスクに ファイルする方法とが可能である.データサイズ はサーモグラム当り150(lines)×(pixels/line) で,磁気ディスクにファイルされる各画素の温度 は0.1℃ステップでディジタルに交換された1バ イトデータである. 画像処理はTTYとの対話形式に従って進めら れ,処理されるサーモグラムはTektronix 4010グ ラフィックターミナルに16レベルのドットパター ンで表示される.次いで処理領域をカーソル入力 によって指示することにより各種処理が実行され る. 処理結果はすべてプリンタに出力され,同時に 磁気ディスクにファイルされる. 処理内容は,Barashらの診断基準4)を一部参考 にした6つの診断基準について実行された.各処 理とその処理内容をTable 1に示す. ここで,Atは左右の乳輪近傍の温度処理, Htは 高温部近傍およびそれに対応する反対側の領域に 関する処理,Vtは左右の血管の高温域における処 理,Vpは左右の血管による高温域に関する処理, Brtは左右の乳房全体についての処理,およびE は左右乳房の輪郭線上の温度分布に関する処理を 示している.
一90一
Table l Contents obtained for each criterion by computer analysis
Criterion Processed contents
At Maximum temperature and co−ordinates, 高?≠?temperature, number of pixels, and
獅浮高b??of pixels per temperature leve1
Ht Same as At
Vt Maximum temperature and co−ordinates
Vp Number of pixels and sum of square of the
р奄???窒?獅モ??in number of pixels per tempera・ 狽浮窒?level of the bilateral breasts喰
Brt Maximum temperature and co−ordinates, 高?≠?temperature, number of pixels, and
獅浮高b??of pixels per temperature level榊
E Temperature distribution along contour of
狽??breast
皐These are data over the temperature level assigned
and are normalized by the total number Qf pixels in the processed area,
鉢Exclusive of the processed areas of At and Ht or At, Ht, and Vp
Table 2 Diagnostic Accuracy of Breast The㎜o−
graphy
Thermograph(Barnes)
@ (1968∼1972) Thermoviewer(JEOL)@ (1973∼1977)
Diagnosis Cancer Cancer−free Cancer Cancer・free
Correct hncorrect @TotaI 153 T7 Q10 124 R6 P60 49 P6 U5 44 P7 U1 Diagnostic `ccuracy Rate 72.8% 77.5% 75.3% 72.1% Overall @ Diagnostic `ccuracy Rate 74.8% 73.8%
Table 3 Characteristics of High Thermal Area
1) Centricity o 高nnOCentr1C multicentric Cancer mon Cancer 105 T8 92 S8 2)Border 結 果 1968年より1972年にかけて,癌研究会附属病院 内科及び外科を受診した乳腺疾患の患者370例に
ついてThermograph(BARNES)による乳房
サーモグラフィを施行した. その診断結果は,Table 2の通りであり,正診率 は癌については72.8%,癌でないものについては 77.5%,総合正診率は74.8%であった.False neg− ativeの比率がやや高いのは,背景の温度パター ンにまどわされて,癌を正しく認識し得ない場合 が多かったものと考えられる. 診断にあたっては,サーモグラム上に描出し得 た高温域をその性状により癌かそうでないかを判 定する訳であるが,この高温域の性状の分析につ いては,Table 3に示すごとく,それが単中心であ るか,多中心であるか,辺縁が整であるか,不整 であるか,血管パターンを伴っているか否か,温 度勾配が高いか低いかの根拠によって鑑別した が,このうちで最も鑑別に役立ったのは温度勾配 の高低による基準であった2). 更に1973年より1977年にかけて,乳腺疾患患者 126例について,日本電子製サーモピュアーにより 乳房サーモグラフィを施行した. regular irregular Cancer mon Cancer 48 R9 149 T9 3)Vascular process positive .獅?№≠狽撃魔 Cancer mon Cancer 132 T1 65 S7 4)Thermal gradient high 10W Cancer mon Cancer 165 R7 32 U1 その診断結果はTable 2に示す通り,癌65例に ついては正診率は75.3%であり,癌でないもの61 例については正診率は72.1%,総合正診率は 73.8%となった. Thermographによる成績と比較してみると, サーモピュアーにおいては,分解能の向上により血管パターンの認識はより明瞭となったため
(Fig.2), false negativeを減らすことは出来た が,その反面いわゆる読みすぎが増え,false posi− tiveが増加してしまった.
by Thermograph(Bames) by Thermoviewer(JEOL)
KM.,44y.o. female,1−Breast Cancer
Fig.2 Breast Themαograms
significant abnormal patternsとして ①periareolar heat
②10cal hot spot ③diffuse heat
④vascular discrepancy or unilateral vessel aCCentUat10n を挙げている. サーモピュアーにおいて,診断の根拠としたと ころは,もちろん著明な高温域の認められるとこ ろによるが(Fig.3−3),更に片側性あるいは両側 性の血管パターンの増強(Fig.3−1,3−5,3−6)で あり,一方斑状パターンの強調された症例(Fig. 3−4)も含まれ,傍乳頭温度上昇の認められる症例 (Fig.3−2)も旧例認められた. これらのtrue positiveと診断し得た症例の主 な根拠を腫瘍の大きさとの相関についてみると Table 4のごとくになる. 血管パターンを片側性あるいは両側性に伴った 高温域を示した症例が最も多くを占めている (45%)が,血管パターンを伴わない高温域を示す のみの症例も8例(16%)認める.これらは比較 的大きさの小さい癌に認められる所見であり,更 に小さい癌では,単に片側性に血管パターンが強 調されただけという症例が多くなっている. false negativeに終った症例はThermograph では57例,サーモピュアーでは16例認めたが,そ のうちで高温域も又著明な血管パターンも示さな い,すなわち全く温度上昇を示さない「冷たい癌」
Fig.3−1 Unilateral Vascular Exaggeration
Fig.3−2 Preareolar Heat
はThermographにて7例,サーモピュアーにて 5例認めた.これらの症例の診断に対してサーモ グラフィは全く無力である(Table 5),
Thermographにおいては,最も有力な診断根
Fig,3−3 Regular High Thermal Area Fig.3−5 High Thermal Area with Unilateral Vascular Exaggeration
Fig.3−4 Exaggerated Mottled Pattern
Fig.3−6 High Thermal Area with Bilateral Vas− cular Exaggeration
Table 4 Thermographical Findings of True Positive Cases by Thermoviewer(JEOL) correlated to the Size of Tumor
Tumor size(㎜)
0∼10 11−20 21∼30 31∼40 41∼50 51∼ Unilateral vascular exaggeration 2 3 2 1 0 0
Preareolar heat 0 2 0 0 0 0
Regular high thermal area 0 1 0 0 0 0
Irregular high thermal area 0 4 1 0 0 0
Exaggerated mottled pattern 0 0 0 1 0 1
High thermal area with
@unilateral vascular exaggeration 0 6 6 3 0 5
High thermal area with
@b至1atera置vascular exaggeration 0 0 0 2 0 0 拠とした温度勾配の概念もそれ程著明でない場合 もかなり認められることがサーモグラフィによる 良性・悪性の鑑別を困難なものにしている.また, 対側に著明な高温域を示したために,悪性所見と して認識し得なかった症例も16例認め,背景の血 管パターンあるいは斑状パターンが強調されたた めに腫瘍による高温域を認識し得なかった症例も 14例にのぼる.
Table 5 Analysis of the False Negative Cases
Thermograph Therrnoviewer Barnes JEOL
1 Negativethermogramsduetocoldtumors
TemperaturedifferencebelowO,5C 7Cases 5 Cases
2 Highestthermalareaontheoppositebreast 16 3 3 Exaggeratedthermalpatternofbackground mottledpattern 7 1 vascularpattern 7 2 4 Thermalgradientnotsoprominent 15 1 5 Misrecognition 5 4
Table 6 Diagnostic Accuracy of Benign Lesions of Breast Thermograph (Barnes) Thermoviewer (JEOL)
Diagnosis Diagnostic Diagnosis Diagnostic Accuracy Accuracy Correct llncorrect RateO% Correct .Incorrect RateO/o Fibroadenoma 10 7 58.8 3 3 50.0 Mastitis 7 3 70.0 1 o 100.0 Cyst 8 5 61.5 4 1 80.0 Granuloma 18 7 72.0 1 2 33.3 Mastopathia 51 13 79.7 11 7 61.1 Others 7 1 87.5 3 o 100.0 Normal 23 o 100.0 10 o 100.0
100 {A) Areolar temperature
-
e s.-o v q " o> 50
・-v ・-m o Qt o = -ts o 100 (B) Breast temperature-1-"
I・
'(/iCii . e At(max) × At{mean)A
eev
¢ vrd k o > so ・H p ,H m o A , tu s k e o o . . x . x Brt(max) Brt<mean)-L-L
SO 100 O So
False-positive rate (g) False-positive rate {x)
Fig. 4 Receiver operating characteristic (ROC) curves for areolar temperature, At (max), and At (mean), and breast temperature, Brt (max) and Brt (mean)
100
3
) B 畏 睾 50 お ’房 & 占 窺 0〔A) Vein paヒしern
X ● x ● ● メ ● ● Vp{index) XVp(ratio) 0 ユ00
E
3 簿 雲50 コ 窃 a あ 君 8 0 (B) Vein ヒemperaヒure ● ● ● ● ● ● Vt(max} 50 100 0 50False−posiしive raヒe (も} False−positive rate (竃)
Fig.5 Receiver operating characteristic(ROC)curves for vein temperature, Vt (max), and vein pattern, Vp(ratio)and Vp(index)
1 100 サーモピュアーにおいても対側乳房に高温域を 示した症例及び背景温度パターンが著明やために 癌と認識し得なかった症例は6例(全体の5%) 認める. 良性疾患における診断結果についてはTable 6 に示されるごとく,線維腺腫において,特に巨大 線維腺腫において高温を呈するためにサーモグラ ム上でも著明な高温域と血管パターンを伴い,鑑 別困難なものが多い.肉芽腫については,サーモ グラム上では全く正常に近いものと,全く悪性所 見に近いものとの両極端を示し,鑑別困難な場合 が多い.又乳頭腫をも含めた乳腺症にも鑑別しに くい症例が多い. 1977年より1980年にかけてコンピューターによ る乳房サーモグラフィの診断を試みた.対象とし た患者は159例の乳腺疾患患者である. Table 1に示した各種診断基準の診断能を定量 的に評価するため,Roc曲線をとるとFig.4及び Fig.5の如くになる. 又,Metzらが提唱した情報容量による解析方 法6)を採用して,各ROC曲線上で最大の情報容量: を与える点の結果はTable 7に示す通りである. この表において,Rは出力側の情報量,またHは
Table 7 Comparison of Diagnostic Abilities of Various Criteria Criterion True− 垂盾唐奄狽奄魔?i%) False・ 垂盾唐奄狽奄魔?i%) R(bit) RIH i%) At(max) 73,1(76/104) 56.4(31/55) 0,020 2.2 At(mean) 74,0(77/104) 60,0(33/55) 0,015 1.6 Vt(max) 53.8(56/104) 30.9(17/55) 0,035 3.8 Vp(ratio) 76.9(80/104) 36,4(20/55) 0,115 12.3 Vp(index) 77.9(81/104) 27,3(15/55) 0,178 19.1 Brt(max) 70.2(73/104) 47.3(26/55) 0,036 3.9 Brt(mean) 62.5(65/104) 41,8(23/55) 0,028 3.0
Table 8 Diagnostic criteria for malignancy on thermograms by computer analysis
1.In reference to Vt criteria
1)Vp index≧70
2)40≦Vp index〈70, Vt≧1.4
2,In reference to Brt criteria
Vp index≧70
3.In reference to At(mean)criteria
1)Vp index≧70
2)40≦Vp index〈70, At≧1,4
4.In reference to Vp ratio criteria
1)Vp index≧70
2)40≦Vp index<70, Vp ratio<0.4
5.In reference to Ht criteria
1)Vp index≧70
2)40≦Vp至ndex<70, Ht(mean)≧1.4
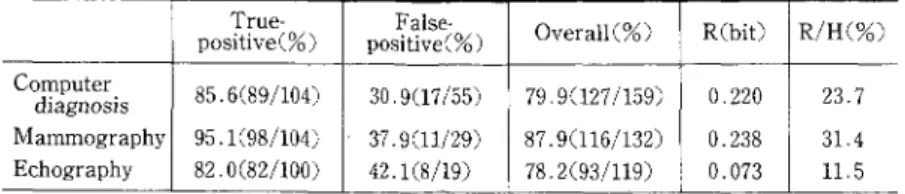
Table 9 Results of Computer Diagnosis of Breast Thermograms compared wlth Mammography and Echography on the Same Material
True− 垂盾唐奄狽奄魔?i%)
False・
垂盾唐奄狽奄魔?i%) Overall(%) R(bit) R/H(%)
Computer @diagnosis lammography dchography 85.6(89/104) X5.1(98/104) W2.0(82/100) 30,9(17/55) R7,9(11/29) S2.1(8/19) 79.9(127/159) W7,9(/16/132) V8.2(93/119) 0,220 O,238 O,073 23.7 R1.4 P1.5 入力型の情報量である. この結果から,しきい温度レベル以上の左右の 温度レベル別面階差の自乗和を示すVp(index) と,左右の面積比を示すVp(ratio)が,悪性と良 性を鑑別する良い診断基準であることが判明し た, なおHt及びEについては該当する症例数が少 なかったために,本解析から除外した. 以上の解析に従って,Vp(index)を中心とし て,悪性であると判定する診断基準はTable 8の ごとくになる.このコンピェーターによる診断基 準によって乳腺疾患患者159例についての診断結 果はTable 9に示す通りである.総合正診率は 79.9%であり,コンピューターを使わない正二二 より5%良い成績が得られた. 同時に施行したマンモグラフィを超音波検査の 結果と比較すると,サーモグラフィのコンピュー ター診断はマンモグラフィには及ばないものの, 超音波検査とほぼ同程度の成績を得た.
なおTable 9のHおよびRはtrue−positive
rateとfalse−positive rateがそれぞれROC曲線 上の1点であると仮定して計算した. 診断結果と腫瘍の大きさとの相関についてみる と(Table 10),301nm以上の癌については診断率 は100%である.10mm以下の癌について最も正 診率が低く,腫瘍の小さいほど診断が困難なこと はこれまでの結果と同じてある. 乳癌の病期別の診断成績はTable 11に示す通りである.stage Iの正常率は約70%, stage II, III
およびIVを加えたグループの正診率は約90%で, 両者の診断成績の差は1%の危険率で統計的に有
意であった.
又,乳癌の組織型別診断成績はTable 12に示す
Table 10 Diagnostic Accuracy according to the Size of Tumor in the Patients with Breast
Cancer
Tumor size Positive Negative Positive
qate(%) 0…10 2 2 50.0 11…20 30 !1 73.8 21…30 21 2 91.3 31…40 15 0 100.0 41…50 3 0 100.0 51…60 8 0 100.0 61・・ 7 0 100.0 Total 87 15 85.2
Table ll Relationship between Results of Com− puter Diagnosis and the Stage of Disease on Patients with Breast Cancer
Stage True−positive(%) False・negative(%)
1 69.7(23/33) 30.3(10/33) II 90,9(50/55) 9.1(5/55) HI 100.0(13/13) 0 (0/13) IV 100.0(1/1) 0 (0/1) II十III十IV 92.8(64/69) 7,2(5/69) 通りである.
正野率は髄様腺管癌(medullary tubular car−
cinoma)90.0%,乳頭腺管癌(papillotubular carcinoma)84.6%,硬癌(scirrhous carcinoma) 81.4%であったが,これらの差は統計的に有意で はなかった. なお,Table 11の結果では病期が不明の2例 を,またTable 12では組織型が不明の5例を除外 して嚇した. 正常及び各種良性疾患の診断成績をTable 13 に示す.症例数が少ないが,線維腺腫と乳頭腫の 成績が良くない.また1例のみであったが膿瘍も 一96一
Table 12 Re豆ationship between Results of Corn− puter Diagnosis and Histolo墓ical Types for Patients with Cancer
True−positive rate(%) Histology Stage 1 II III IV Total Papillgtubular @carclnoma 66.7 i6/9) 91.7 i11/12) 100.0 i4/4) 100.0 i1/1) 84.6 i22/26)
Medullary tubular carClnoma
85.7 i6/7) 90.0 i9/10) 100.0 i3/3) 90/0 i18/20) Scirrhous 64.3 87.5 100.0 81.4 carClnonユa (9/14) (21/24) (5/5) (35/43) Others 66.7 100.0 90.0 (2/3) (7/7) (9/!0)
Tab玉e 13 Results of Computer Diagnosis of Breast Thermograms for Normals and Patients with Benign Diseases
True−negative(%) False−positive(%) Normal 72.7(8/1D 27.3(3/11) Mastopathy 82.4(14/17) 17.6(3/17) Fibroadenoma 42.9(3/7) 57.1(4/7) Cyst 100.0(6/6) 0(0/6) Fibrosis 100.0(4/4) 0 (0/4) Papillomaワ 25.0(1/4) 75.0(3/4) Others 57.1(4/7) 42,9(3/7) 悪性と鑑別困難であった, 考 察
乳癌のサーモグラフィによる診断は1956年
Lawsonのevaporographによる乳癌の画像表示
をもってその甲矢となすD. 更に1960年Lloyd Williamsら7)セこよって乳癌 においては,高温を示すもの程その予後が不良で あるという事実が明らかにされて以来,乳癌の診 断に対して温度の上昇(∠T)が注目されて来た. Melanderら8)(1966年)は温度差∠Tを2℃以 上あるかないかを鑑別点として,癌と良性を判別 することが出来るとしている.彼等の撮影条件は 外気温が19℃とかなり低くなっており,この外気 が低いということによってコントラストが強調さ れ,診断が可能となるのであろうが,日本人では この外気温には堪え得ない. 我々の成績ではむしろ0。50Cを鑑別点とした方 が成績が良かった, 乳房サーモグラムの温度パターンの解析につい ては,正常人の温度パターンの分類がJonesら9) (1969年)によって詳細に検討された.彼らは特に 赤外線写真との対比によって血管のパターンが多 いか少ないかに分け,cold breasts, some vas− cularity, warm breasts, patch patternの4つのグループに分けている.そして,乳癌の診断にあ たっては,この正常パターンからの逸脱をもらて 異常であると診断すべきであると主張している. 異常パターンについては,古くはHarrisら10) (1966)により詳しい解析がなされており,又 Wallaceら11)(1968),Isardら12)(1968)の文献に も散見するが,1972年Isardら‘)がsigni丘cant abnormal patternとして,①periareolar heat,② loca互hot spot,③diffuse heat,④vascular di− Screpancy or unilateral veSsel aCcentuationの
4つを挙げていることは前述した通りである. なおこれらの事実をふまえて,NCIを中心とし た基準が1976年に発表されている13). 悪性所見の診断基準としては,Grosら14)(1972) Aartsら15)(1971)によるものがあるが, false− positiveがどうしても高い割合を占めている. Amalricら16)(1976)は・くうメータとして,① Hypervascularization,②Hot spot,③Whole breast hyperthermia,④Edge signの4つを挙 げ,これらをsuspiciousかmalignantかに分け, これらの所見の組み合わせによりサーモグラムを TH1よりTH5の5つに分け, TH1を正常, TH2 を良性型,TH3はsuspicious signを1つもってい るもの,TH4はrnalignant signを1つもっている もの,TH5はmalignant signを2っ以上もってい るものと定義した.そしてTH4及びTH5は当然 治療が必要なものと考えるが,又TH3のサーモグ ラムを注意深く観察すべきハイリスクの症例であ るとして重要視している.この考え方はフランス ではかなり普及し,検診に応用されつつある. この診断基準には温度差の規定があり,ある点 では定量的ではあるが,全体的に見ればあいまい さがぬぐい切れない. サーモグラフィの定量的解析の試みとしては Barashら4)(1973)によるものがある.すなわち
彼らはvein pattern(Vp), vein temperature (Vt), background temperature(Bt)及びare− oear temperature(At)の4つを診断基準にとり, 各々につき1∼4のスコアをつけ,1枚のサーモ グラムで10以上のスコアを示すものでは85%以上 に癌の可能性があると計算した. この診断基準が重要であることについては本論 文に示しているところである. サーモグラフィのコンピューター解析はZis− kinら17)(1975),Newmanら18)(1977),太山ら19) (1976)により試みられており,いずれも肉眼的読 影よりもすぐれた結果が得られるとしている.著 者の成績も同様であり,コンピューター解析によ る正物率の向上が得られた. 結 語 1)乳房サーモグラフィによる乳癌の診断は,コ ンピューターの導入により,二二率80%にまで高 め得た. 2)診断基準としては,血管パターンの処理であ るVp(index)が最もすぐれた診断能を持つこと が明らかとなったので,この処理を中心に診断基 準を設定した, 3)良性疾患でもVp(index)が陽性になるもの はかなり多く,線維腺腫,乳頭腫,肉芽腫,膿瘍 などについてはその陽性率がかなり高い.診断に おいてはこの考慮が必要である. 4)stage Iの乳癌においては診断率がやや低い のが問題である.この事実をもってサーモグラ フィが乳癌の検診に不適であるとする見方もある が,小さな癌では診断率が低いのはすべての検査 法の宿命と言えよう.更に一層の診断率を高める 工夫が必要である. 5)今回のコンピューターシステムの改善すべ き点は,第1にVp処理のしきい温度レベルのコ ンピューターによる自動決定,第2に処理領域設 定の規格化であり,更には処理時間の短縮により 容易に検査が施行されるようにしなければならな い点である.これらの点を考慮してより一層サー モグラフィが有用であらしめるよう望むところで ある. 尚,本論文の要旨は,第20回癌治療学会及び第1回 日本医学生物学サーモグラフィ学会にて発表した. 稿を終わるにあたり,御指導と御校閲をいただきま した田崎瑛生名誉教授ならびに重田帝子教授に厚く 感謝致します. 文 献
1)Lawson, R.M.:Implicatlons of surface tem. peratures in the diagnos圭s of breast cancer. Canad Med Assoc J 75309∼310(1956) 2)Ohashi, Y., et a1.: The diagnosis of preast cancer by thermography. K. Atsumi(ed.), Medical Thermography, Univ Tokyo Press 215 ∼252(1973)
3)Uchida,1., et aL= Quantitative diagnosis of breast thermograms. Nipp Acta Radiol 39401 ∼411 (1979)
4)Barash,1.M., et al.:Quant三tative thermo− graphy as a predictor of breast cancer. Cancer 31 769∼776 (ユ973)
5)Isard, HJ., et al.: Breast thermography after four years and 10,000 studies. Am J Radiol 115811∼821 (1972)
6)Metz, C.E., et a1.: Evaluation of receiver operating characteristics curve data in terms of
information theory with application in radiology. Radiology 109297∼303(1973) 7)Uoyd−Williams, K, et al.:Infra・red ther− mometry in the diagnosis of breast disease. Lancet(ii)1378∼1381 (1961)
8)Notter, G., et aL:ThermQgraphische Unter− suchung bei Erkrankungen der Brustdr廿se. Fort R6ntgenstr 105657∼664(1966) 9)Draper, J.W., et al.:Thermal patterns of the female breast。 Br J Radiol 42401∼410(1969) 10)Harris, D.L, et aL= Intrared in the diagnosis of a lump in the breast. Br J Cancer 20710∼721 (1966)
11)Wallace, J.D., et aL:Thermography in the diagnosis of breast cancer. Radiology 91 679∼685 (1968)
12)Isard, H.J., et aL:Breast thermography. Am
JRoentgenol 103921∼925(1968)
13)Lapayowker, M.S., et al.=Criteria for obtaining and interpretillg breast thermo− grams. Cancer 381931∼1935(1976) 14)Gros, Ch., et a1.: Die Diagnose von Brust−
karzinomen durch Infrarot The㎜ographie. Fortschr R6ntgenstr 116669∼674(1972) 15)Aarts, N.J.M., et aL:The contribution of thermography to the diagnosis of breast can・ cer. Electromedica 5192∼193(1971)
16)Amalric, R., et al.: Value and interest of dynamic telethe㎜ography in detection of breast cancer. Acta Thermographica 189∼96
(1976)
17)Ziskin, M.C., et al.:Computer diagnosis of breast thermograms, Radiology 112341∼347
(1975)
18)Newman, P., et al.:Asystem for automated diagnosis of abnormality in breast thermo− grams. Br J Radiol 50231∼232(1977)
19)太居英夫・他:コンピューターによる乳癌サーモ グラムの解析.医用電子と生体工学 1411!∼117