Akira SAITO
Faculty of Humanities and Social Sciences Jissen Women’s UniversityPerceived Quality of Service and Structure of
Customer Satisfaction in Travel Retail Channels:
Strategic perspective on marketing strategies
that target overseas tourists
Abstract
For tourism, shopping is considered to be among the oldest and important element. However, there has not been much research on the cross-linkages between shopping and marketing strategies in the travel retail channel. The purpose of this study is to provide suggestions for marketing strategies for the travel-retail channel. In this regard, the shopping behavior of Japanese tourists at duty-free shops in international airports and toward in-fl ight sales services is considered, with particular emphasis on the causal relationship between satisfaction and perceived quality.
1. Introduction
Shopping is considered to be among the oldest and most important elements for tourism. For many travelers, a sightseeing tour is unlikely to not include spending time in a store, commercial accumulation, and a local market (cf. Hudman & Hawkins 1989, Keown 1989). Studies on tourists’ shopping behavior can be roughly classified into three: shopping behavior at airport commercial spaces (cf. Crawford & Melewar 2003, Geuens, Vantomme & Brengman 2004), shopping behavior toward in-fl ight sales services (cf. Doong, Wang & Law 2012, Huang & Kuai 2006), and shopping behavior at the travel destination (cf. Lundberg 1976, Hudman & Hawkins 1989, Keowin 1989, Heung & Qu, 1998, Freathy & O’Connel 1999, Mak, and Tsang, Cheung 1999; Rosenbaum 2007, Rosenbaum & Spears 2005, 2006a, 2006b, Kim & Agrusa 2008).
However, research on tourists’ shopping behavior in airport commercial spaces is limited (Freathy & O’Connel 1999, Geuensa, Vantomme, & Brengman 2004). Moreover, research on tourists’ shopping behavior toward in-fl ight-sales services is limited in spite of its major eff ect on the travel retail market (Doong, Wang, & Law 2012). In addition, there is still a lack of
research on marketing strategies in a travel retail channel.
Accordingly, this study contributes to extant literature by focusing on marketing strategy in a distribution channel with overseas tourists as the target. In this regard, the shopping behavior of Japanese overseas travelers in duty-free shops in international airports and toward in-fl ight-sales services, which are the main distribution channels in travel retail, is considered. In particular, the causal relationship between the perceived quality of service and customer satisfaction is discussed.
This study has strategic implications for international airport management and airline management, where competition is severe. Airport management must pay serious consideration to commerce for travelers, that is, non-air transportation businesses, given that there exists severe competition among international airports (cf. Graham 2013) and airline-business managements are grappling with further deregulation (cf. Halpern and Graham 2013).
2. Literature review
2-1. Perceived quality and customer satisfaction from service
The causal relationship between perceived quality and customer satisfaction from service has been the subject of much debate. The following are the peculiar features of service transactions: intangible nature of goods, indivisibility of production and consumption, heterogeneity, and simultaneous disappearance (Zeithaml, Parasuraman & Berry 1985).
With regard to quality of service, unlike in manufacturing transactions where the quality of goods can be evaluated based on an objective attribute, service transactions are unique in that the customer’s participation defi nes the service itself, and hence evaluating the quality of service involves assessing perception of service.
As for customer satisfaction, there exists an “expectation-disconfirmation” paradigm (Oliver 1980): satisfaction is formed if there is prior expectation of service experience, and if this expectation is not met, quality is poor, and is fi ne otherwise. Thus, perceived quality is regarded as an antecedent factor of customer satisfaction.
Bitner (1990) used a causal model to verify that prior expectation from a service encounter aff ects customer satisfaction. Further, the research on the infl uence of customer satisfaction on service encounters has yielded customer satisfaction aff ects the perceived quality of service. Thus, views on the relation between perceived quality of service and customer satisfaction can be classified into two: one view presupposes that perceived quality affects customer satisfaction, and another that customer satisfaction aff ects perceived quality.
2-2. Measurement of perceived quality of service
SERVQUAL, a measure evaluating the quality of service, was developed in the 1980s. (Parasuraman, Zeithaml, & Berry 1985, 1988). This measurement technique was developed to measure subjective quality from consumers’ viewpoint on the premise that it is diffi cult to objectively evaluate quality of service. Parasuraman, Zeithaml & Berry (1985) present reliability, access, safety, credibility, customer understanding, reactivity, capability, care, material elements, and communication as the bases of valuation at the beginning. These valuation bases are not necessarily mutually independent, and some are overlapping. Parasuraman, Zeithaml & Berry (1988) compile five dimensions: reliability, reactivity, a material element, consensuality, and certainty. As for the questions, the 97 items were aligned to a 5-dimensional space of 22 queries.
In contrast, SERVPERF by Cronin & Taylor (1992) uses only perception without taking an expected value, unlike SERVQUAL.
SERVPERF proposed by Cronin & Taylor (1992) served as the conceptual base for SERVQUAL, given that the latter was difficult to implement in practice. There have been many researches that adopt this measure using only consumers’ perception (cf. Babakus & Boller 1992, Andaleeb & Basu 1994, Cronin et al. 2000, Brady et al. 2002).
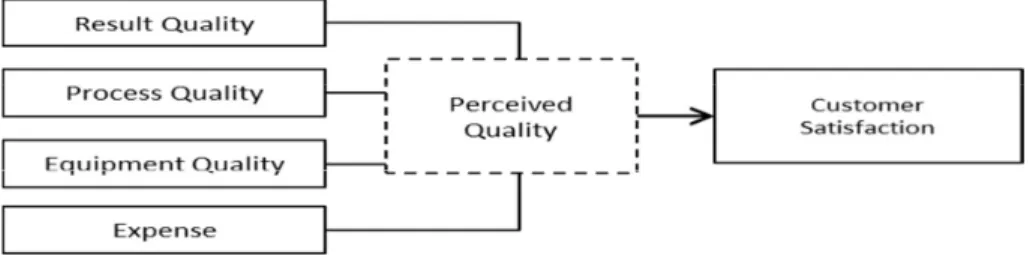
Since previous works on quality-of-service evaluation focused solely on quality of service, Kondo (2000), assuming that other information needed at the scene of considering purchase is not included, extracted the following four classifi cations of quality-of-service evaluation from the three dimensions of “quality of core service,” “marketing mix,” and “customer value”: result quality, process quality, equipment-quality and expense.
In addition, regarding the framework of quality-of-service evaluation, this study refers Kondo (2000) and consider the marketing mix element assuming that the other information needed for considering purchase is included.
3. Proposed model
In this study, the following conceptual structure models were set up regarding the causal relationship between perceived quality of service and customer satisfaction with reference to the previously mentioned works and frameworks of analysis.
Using the above model, at first the causal relationship between the four components comprising perceived quality (while shopping at duty-free shops in international airports and availing in-fl ight sales services) and customer satisfaction are revealed. Then, strategic improvements and implications for marketing strategies are examined.
4. Quantitative research overview
4-1. Objectives
This research seeks to reveal the causal relationship between the four components comprising perceived quality (while shopping at duty-free shops in international airports and while availing in-flight sales services) and customer satisfaction, and to derive implications from a marketing perspective.
4-2. Sample and data collection
This survey̶a two-stage online research̶was conducted between June 5 and June 9, 2014. As a preliminary survey, 6,925 individuals with international boarding experience within the past three years were considered. Of these, 442 samples were extracted based on shopping experience at airport duty-free shops and exposure to in-fl ight sales serviced.
In the fi nal sample, 57.7% were males and 42.3% were females; 0.2% were in their 20s, 8.4% were in their 30s, 19.7%, were in their 40s, 25.3% were in their 50s, and 23.3% were more than 60 years old; 23.1% were transiting (but not for leisure or business), 18% were on a business trip, 77% were tourists, and 5% were travelling for personal matters (visiting relatives/ acquaintances, etc.). In addition, with regard to the destination to which they were travelling (if travelling to multiple locations, the last destination was used): 49.8% were travelling to Asia, 21.5% were travelling to Europe, 21.5% were travelling to North America, 16.7% were travelling to Central and South America, 2% were travelling to the Middle East Africa, and 1.8% were travelling to other regions.
4-3. Variables
The variables for this survey are as shown below, and are based on the framework of Kondo (2000). Items that measure the variables in this research were presented in Table 1. All the variables were rated on a 7-point scale (1=not at all, and 7=extremely).
Figure 1: The Proposed Conceptual Structure Model concerning Perceived Quality of Service and Customer Satisfaction
4-4. Methods of analysis
To examine the causal relationship between satisfaction and perceived quality-of-service, multiple regression analysis was conducted using overall satisfaction from shopping as the objective variable, and using quality (3 items), process (4 items), equipment (2 items), and expenses (1 item; shopping at duty-free shops in international airports: 10 questions; availing in-fl ight sales services: 9 questions) as the explanatory variables.
To examine the satisfaction structure, standard partial regression coeffi cient was used for each explanatory variable item and CS portfolio analysis was performed.
5. Results and discussion
5-1. Multiple regression analysis: causal relationship between customer satisfaction and perceived quality for shopping at duty-free shops in international airports
Table 2 reports the results of multiple regression analysis for shopping at duty-free shops in international airports that explore the effects of explanatory variables upon customer satisfaction.
Several of the proposed variables are signifi cant predictors of customer satisfaction .The effect of result quality (“abundance of number of goods, merchandising”) on customer satisfaction was signifi cant ( β =0.2832, p < 0.01) , equipment quality”(“feel of the store”; ( β =0.1824, p < 0.05), expense (“charged selling price”; β =0.1653, p <0.01) were found to be signifi cant. See Table 2 for details.
Further, note that descriptive statistics for each index are shown in Table 3. Table 1: Variables related to perceived quality-of-service
Duty-free shops in international airports In-flight sales services Result
Quality
number of goods, merchandising Result Quality㻌
number of goods, merchandising
original and limited editions㻌 original and limited editions㻌
tenants㻌 Process
Quality㻌
knowledge of the salesperson㻌 Process
Quality
knowledge of the salesperson kindness of salesperson㻌 kindness of salesperson㻌 personality of salesperson㻌 personality of salesperson㻌 latest trend
latest trend㻌 Equipment
Quality
readability of the catalog㻌 Equipment
Quality
feel of the shopping area㻌 enjoyment of the catalog㻌 feel of the store㻌 Expense expense
Expense expense㻌 Satisfaction㻌 satisfaction㻌 Satisfaction satisfaction
5-2. Multiple regression analysis: causal relationship between satisfaction and perceived quality for in-fl ight sales services
Table 4 reports the results of multiple regression analysis for shopping toward in-fl ight sales services that explore the eff ects of explanatory variables upon customer satisfaction. Several of the proposed variables are signifi cant predictors of customer satisfaction .The eff ect of result quality (“abundance of number of goods, merchandising” ; β =0.2347, p < 0.01, “original products and limited editions”; β =0.1451, p < 0.01) on customer satisfaction was
signifi cant.
In addition, process quality (“personality of salesperson”; β = 0.2204, p < 0.01), equipment quality (“enjoyment of product catalog booklet”; β = 0.1559, p < 0.01), expense (“charged selling price”; β =0.3203, p < 0.01) were also found to be signifi cant. See Table 4 for details. Further, note that descriptive statistics for each index are shown in Table 5.
Table 2: Multiple regression analys is for shopping at duty-free shops in international airports
variables㻌 B㻌 SE㻌 β 㹄 t p
number of goods, merchandising㻌 0.2323** 0.0438 0.2832** 28.1069 5.3016 0.0000 original and limited editions㻌 0.0009 0.0509 0.0009 0.0003 0.0174 0.9861
tenants㻌 0.1118 0.0583 0.1128 3.6755 1.9172 0.0559
knowledge of the salesperson㻌 0.0708 0.0665 0.0769 1.1356 1.0656 0.2872 Kindness of salesperson㻌 0.0589 0.0694 0.0637 0.7204 0.8488 0.3965 personality of salesperson㻌 -0.0355 0.0603 -0.0363 0.3469 -0.5890 0.5562 latest trend㻌 -0.0312 0.0597 -0.0314 0.2722 -0.5217 0.6022 feel of the shopping area㻌 0.0198 0.0759 0.0200 0.0681 0.2610 0.7942 feel of the store㻌 0.1847* 0.0789 0.1824* 5.4836 2.3417 0.0197 expense㻌 0.1450** 0.0379 0.1653** 14.6224 3.8239 0.0002
㻔R2: 0.4307; * p < 0.05;㻌 **㻌 p < 0.01) Table 3: Descriptive statistics for shopping at duty-free shops in international airports
variables 㼚㻌 M s2 SD Range
number of goods, merchandising㻌 442 4.471 1.651 1.285 1.000 7.000 original and limited editions㻌 442 4.534 1.256 1.121 1.000 7.000
tenants 442 4.441 1.131 1.064 1.000 7.000
knowledge of the salesperson㻌 442 4.319 1.311 1.145 1.000 7.000 Kindness of salesperson㻌 442 4.367 1.298 1.140 1.000 7.000 personality of salesperson㻌 442 4.258 1.162 1.078 1.000 7.000
latest trend㻌 442 4.484 1.130 1.063 1.000 7.000
feel of the shopping area 442 4.665 1.135 1.065 1.000 7.000
feel of the store 442 4.640 1.083 1.041 1.000 7.000
expense㻌 442 4.500 1.443 1.201 1.000 7.000
5-3. CS portfolio analysis: satisfaction from shopping at duty-free shops in international airports
CS portfolio analysis is conducted based on the customer satisfaction and importance of each explanatory variable. The results are shown in Figure 2. The vertical axis represents satisfaction, the horizontal axis represents severity, and the intersection denotes the mean value.
The four quadrants are as follows: priority improvement items (satisfaction: low; importance: high), non-priority improvement items (satisfaction: low; importance: low), priority maintenance items (satisfaction: high; importance: high), and non-priority maintenance items (satisfaction: high; importance: low).
“Satisfaction” represents the average value of satisfaction for each explanatory variable. Then “importance”, each standard regression coeffi cient by the sum of each of the standard regression coeffi cient, represents the value obtained by dividing. It should be noted that, for the evaluation, explanatory variables with the negative of the partial regression coeffi cient was excluded.
Table 4: Multiple regression analysis for in-flight sales services
variables㻌 B SE β 䠢 t p
number of goods, merchandising㻌 0.2164** 0.0420 0.2347** 26.5014 5.1480 0.0000 original and limited editions㻌 0.1483** 0.0488 0.1451** 9.2263 3.0375 0.0025 knowledge of the salesperson㻌 0.0149 0.0626 0.0145 0.0565 0.2377 0.8122 Kindness of salesperson㻌 0.0382 0.0621 0.0369 0.3799 0.6164 0.5380 personality of salesperson㻌 0.2455** 0.0592 0.2204** 17.2154 4.1491 0.0000 latest trend㻌 -0.0798 0.0621 -0.0715 1.6522 -1.2854 0.1993 readability of the catalog㻌 -0.0765 0.0665 -0.0677 1.3231 -1.1503 0.2507 enjoyment of the catalog㻌 0.1714** 0.0643 0.1559** 7.1159 2.6676 0.0079 expense㻌 0.3188** 0.0399 0.3203** 63.8096 7.9881 0.0000 䠄R2: 0.5688;㻌 ** p < 0.01䠅 Table 5: Descriptive statistics for in-flight sales services
variables㻌 n㻌 M㻌 s2㻌 SD㻌 Range㻌
number of goods, merchandising㻌 442 3.464 1.542 1.242 1.000 7.000 original and limited editions㻌 442 4.439 1.254 1.120 1.000 7.000 knowledge of the salesperson 442 3.848 1.235 1.112 1.000 7.000 Kindness of salesperson 442 4.081 1.218 1.104 1.000 7.000 personality of salesperson 442 4.219 1.056 1.028 1.000 7.000
latest trend 442 4.032 1.051 1.025 1.000 7.000
readability of the catalog 442 4.398 1.025 1.012 1.000 7.000 enjoyment of the catalog 442 4.346 1.084 1.041 1.000 7.000
expense 442 4.066 1.322 1.150 1.000 7.000
Priority maintenance items are “abundance of number of goods, merchandising,” “feel of the store,” and “charged selling price.” The only priority improvement item is “variety of stores,” indicating that duty-free zones at airports should house a large variety of store selling diff erent kinds of merchandise.
5-4. CS portfolio analysis: satisfaction for in-fl ight sales services
CS portfolio analysis is conducted based on the customer satisfaction and importance of each explanatory variable. The results are shown in Figure 3. The vertical axis represents satisfaction, the horizontal axis represents severity, and the intersection denotes the mean value.
㻌 Figure 2: CS portfolio for shopping at duty-free shops in international airports
Table 6: Priority of each variabl e for shopping at duty-free shops in international airports
㻌 variables㻌 β importance satisfaction
A number of goods, merchandising㻌 0.2832 0.313 0.679
B original and limited editions㻌 0.0009 0.001 0.439
C tenants㻌 0.1128 0.125 0.653
D knowledge of the salesperson㻌 0.0769 0.085 0.503
E Kindness of salesperson㻌 0.0637 0.07 0.539
H feel of the shopping area㻌 0.0200 0.022 0.616
I feel of the store㻌 0.1824 0.201 0.658
The four quadrants are as follows: priority improvement items (satisfaction: low; importance: high), non-priority improvement items (satisfaction: low; importance: low), priority maintenance items (satisfaction: high; importance: high), and non-priority maintenance items (satisfaction: high; importance: low).
“Satisfaction” represents the average value of satisfaction for each explanatory variable. Then “importance”, each standard regression coeffi cient by the sum of each of the standard regression coeffi cient, represents the value obtained by dividing. It should be noted that, for the evaluation, explanatory variables with the negative of the partial regression coeffi cient was excluded.
Priority maintenance items are “abundance of number of goods, merchandising,” “feel of the store,” and “charged selling price.” The only priority improvement item is “variety of
㻌 Figure 3: CS portfolio for availing in-fl ight sales services
Table 7: Priority of each variable for availing in-flight sales services
variables㻌 β㻌 importance㻌 satisfaction㻌
䠝 number of goods, merchandising㻌 0.2347 0.24 1.08
䠞 original and limited editions㻌 0.1451 0.15 0.39
䠟 knowledge of the salesperson㻌 0.0145 0.01 0.89
䠠 Kindness of salesperson㻌 0.0369 0.04 0.68
䠡 personality of salesperson㻌 0.2204 0.22 0.59
䠤 enjoyment of the catalog㻌 0.1559 0.16 0.44
stores,” indicating that duty-free zones at airports should house a large variety of store selling diff erent kinds of merchandise.
The only priority maintenance item is “abundance of number of goods, merchandising.” However, “charged selling price,” “personality of salesperson,” “product catalog booklet,” and “original products and limited editions” emerged as priority improvement items. Thus, in-fl ight sales services should charge fair prices, employ immaculate sales personnel, have detailed product catalogs, and stock original/limited editions or products.
6. Limitations and future research
This study analyzes the causal relationship between perceived quality of service and customer satisfaction for Japanese tourists while shopping at duty-free shops in international airports and availing in-flight sales services. It thus discusses the cross-linkages between shopping and marketing strategies in the travel retail channel.
A limitation of this approach is that consumption needs, context of consumption, meaning of consumption, and value of consumption do not be considered. In other words, considering the attitudes (utilitarian, hedonic, luxury-oriented) towards shopping at duty-free shops in international airports and availing in-fl ight sales services, as revealed by Saito (2015a, b, c), may yield a more strategic adaptive model that may yield more concrete and focused implications. This is left for the future.
[1] Ahmet.K, “A Concept of Optimal Quality and an Application”, Total Quality Management and BusinessExcellence, 16/2, 2005, pp.243-255.
[2] Andaleeb.S.S, Basu.A.K, “Technical Complexity and Consumer Knowledge as Moderators of Service QualityEvaluation in the Automobile Service Industry”,Journal of Retailing, 70/4 , 1994, pp.367-81. [3] Anne Graham, Managing Airports 4th Edition: An international perspective, Routledge, 2013. [4] Asubonteng.P, McCleary.K.J, Swan.J.E, “SERVQUAL Revisited: a Critical Review of Service
Quality”, The Journal of Services Marketing, 10/6, 1996, pp.62-81.
[5] Babakus.E, Mangold.G.W, “Adapting The SERVQUAL Scale to Hospital Service: An Empirical Investigation”, Hospital Services Research, No.6, 1989, pp.767-786.
[6] Babakus.E, Boller.G.W, “An Empirical Assessment of the SERVQUAL Scale,” Journal of Business Reserch, 24/3, 1992, pp.253-268.
[7] Baron.S, Harris.K,“Services Marketing”,Palgrave Macmillan,1995. [8] Berry L.L. & A.Parasuraman “Marketing Services”, Free Press, 1991.
[9] Brady.M.K, Cronin.J, Brand.R.R, “Performance- Only Measurement of Service Quality: A Replication and Extension”, Journal of Business Reserch, 55/1, 2002, pp.17-31.
[10] Carman.J.M, “Consumer Perceptions of Service Quality: An Assessment of SERVQUAL Dimensions”,
Journal of Retailing, Vol.66, 1990, pp.33-55.
[11] Crawford, G, Melewar, T, “The importance of impulse purchasing behaviour in the international airport atmosphere”, Journal of Consumer Behaviour,3/1,2003, pp.85-98.
[12] Cronin.J.J, Taylor.S.A,“Measuring Service Qulity. A Reexamination and Extension”, Journal of Marketing, Vol.56, July, 1992, pp.55-68.
[13] Christopher.L.C, “The FAIRSERV Model: Consumer Reactions to Service Based on a Multidimensional Evaluation of Service Fairness”, Decision Sciences 38/1. 2007, pp.107-130.
[14] Clow.K.E, Vorhies.D.W, “Building a Competitive Advantage for Services Firm”, Journal of Services Marketing, Vol.7, 1993, pp.22-32.
[15] Cronin.J, S.A.Taylor, “Measuring Services Quality: A Reexamination and Extension,” Journal of Marketing, Vol.56, 1992, pp.55-68.
[16] Cronin.J, Brady.M.K, Hult.T.M, “Assessing the Eff ects of Quality, Value and Customer Satisfaction on Consumer Behavior Intentions in Service Environments”, Journal of Retailing, 76/2, 2000, pp.193-218. [17] Dabholkar.P.S, Thorpe.D.I, Rentz.J.O, “A Measure of Service Quality for Retail Stores: Scale
Development and Validation”, Journal of the Academy of Marketing Science, 1996, pp.3-16.
[18] Dabholkar, Pratibha A., “A Contingency Framework for Predicting Causality between Customer Satisfaction and Service Quality,” Advances in Consumer Research, 22/1, 1995, pp.101-108.
[19] Doong H, Wang H & Law R, “An Examination of the Determinants of In-Flight Duty-Free Shopping: Hedonic and Utilitarian Motivations”, International Journal of Tourism Research, 14/3, 2012, pp.303-306.
[20] Freathy, P, & O'Connell, F, “A Typology of European Airport Retailing”, The Service Industries Journal, 19/3, 1999, pp. 119-134.
[21] Geuens, M, Vantomme, D, & Brengman, M, “Developing a typology of airport Shoppers”, Tourism Management, 25, 2003, pp.615-622.
[22] Huang W & Kuai L., “The in-flight shopper”, Journal of Air Transport Management, 12/4, 2006, pp.207-211.
[23] Hudman L. E., & Hawkins D. E. Tourism in contemporary society, Englewood Cliff s, NJ: Prentice-Hall., 1989.
[24] Heung, V. C. S., & Qu, H., “Tourism shopping and its contributions to Hong Kong” Tourism Management, 19/4, 1998, pp.383‒386.
[25] Iacobucci, Dawn, Amy Ostrom, and Kent Grayson, “Distinguishing Service Quality and Customer Satisfaction: The Voice of the Consumer,” Journal of consumer psychology, 4 /3, 1995, pp.277-303. [26] Keowin, C., A Model of Tourist Propensity to Buy: Case of Japanese Visitors to Hawaii. Journal of
Travel Research, 27/3, 1989, pp.31-34.
[27] Kim, S.S. & Agrusa, J., “Segmenting Japanese Tourists to Hawaii According to Tour Purpose” Journal of Travel & Tourism Marketing, 24/1, 2008, pp.63-80.
[28] Kondo Takao, “Service Quality Assessment”, Tama University Journal of Management and Information Sciences, 4, 2000, pp.1-16. (in Japanese)
[29] Lundberg, D. E., The tourist business, CBI Publishing Company, 1976.
[30] Mak, B., Tsang, N. & Cheung, J., “Taiwanese tourists’ shipping preferences.” Journal of Vacation Marketing, 5/2, 1999, pp.190-198.
[31] Nigel Halpern and Anne Graham, Airport Marketing, Routledge, 2013.
[32] Parasuraman.A., Zeithaml.V.A. and Berry.L.L., “A Conceptual Model of Services Quality and Its Implications for Future Reserch”, Journal of Marketing, Vol.49. 1985, pp.41-50.
[33] Parasuraman.A., Zeithaml.V.A. and Berry.L.L,“SERVQUAL: A Multiple-Item Scale foe Measuring Consumer Perceptions of Service Quality”, Journal of Retailling, 64/1, 1988. pp.2-40.
[34] Parasuraman,A., Zeithaml.V.A. and Berry.L.L,“Refinement and Reassessment of the SERVQUAL Scale”, Journal of Retailing, 67/4, 1991, pp.420-450.
A Comparative Assessment Based on Psychometric And Diagnostic Criteria”, Journal of Retailing, Vol.70, 1994, pp.201-230.
[36] Rosenbaum, M., “The hedonic repeat visit: Exploring consumption diff erences among fi rst-time and repeat Japanese visitors in Hawaii”, Tourism Analysis, 11/5, 2007, pp.289-295.
[37] Rosenbaum, M. & Spears, D., “An exploration of spending behaviors among Japanese tourists”, Journal of Travel Research, 44/4, 2006a, pp.467-473.
[38] Rosenbaum, M. & Spears, D., “Who buys what? Who does that? The case of Golden Week in Hawaii”, Journal of Vacation Marketing, 12/3, 2006b, pp.246-255.
[39] Rosenbaum, M. & Spears, D., “Who buys that? Who does what? Analysis of cross-cultural consumption behaviours among tourists in Hawaii” Journal of Vacation Marketing, 11/3, 2005, pp.235-247.
[40] Saito Akira, “Shopping Behavior and Attitudes toward Shopping at the International Airport Terminal: A Casual Study between Attitudes and Expenditure Behavior of Japanese Overseas Tourist”, Journal of Japan Institute Tourism Research, 27/1, 2015a, pp.65-77. (in Japanese)
[41] Saito Akira, “Shopping Behavior of Tourists and Travel Retailing: An Emprical Study of the Casual Relationship between Attitudes and Duty-free goods magazine of in-fl ight sales service and Expenditure behavior-”, Journal of Japan Society for Distributive Sciences (JSDS), 36, 2015b, pp. 17-29. (in Japanese)
[42] Saito Akira, “Shopping behavior and attitudes toward the in-fl ight duty-free shopping: A causal study between attitudes and expenditure behavior of Japanese overseas tourists”, Journal of Industry and Economy, 15, 2015c, pp.164-177. (in Japanese)
[43] Spreng.R.A, Singh.A.K, “An Empirical Assessment of the SERVQUAL Scale and the Relationship between Service Quality and Satisfaction”, Enhancing Knowledge Development in Marketing, Chicago, IL: American Marketing Association, 1993, pp.1-6.
[44] Zeithaml.V.A.,“How Consumer Evaluation Process Diff er between Goods and Services”, J.H.Donnelly, W.R.George eds. Marketing of Services, AMA,1981, pp.186-190.