components on gut microbiome
and short-chain fatty acids in
a mouse model of metabolic
syndrome
Kazuchika Nishitsuji
1,2, Syunsuke Watanabe
1, Jinzhong Xiao
3, Ryosuke Nagatomo
4,
Hirohisa Ogawa
1, Takaaki Tsunematsu
1, Hitomi Umemoto
5, Yuki Morimoto
1, Hiroyasu Akatsu
6,
Koichi Inoue
4& Koichi Tsuneyama
1We previously showed that male Tsumura Suzuki obese diabetes (TSOD) mice, a spontaneous mouse model of metabolic syndrome, manifested gut dysbiosis and subsequent disruption of the type and quantity of plasma short-chain fatty acids (SCFAs), and daily coffee intake prevented nonalcoholic steatohepatitis in this mouse model. Here, we present a preliminary study on whether coffee and its major components, caffeine and chlorogenic acid, would affect the gut dysbiosis and the disrupted plasma SCFA profile of TSOD mice, which could lead to improvement in the liver pathology of these mice. Three mice per group were used. Daily intake of coffee or its components for 16 wk prevented liver lobular inflammation without improving obesity in TSOD mice. Coffee and its components did not repair the altered levels of Gram-positive and Gram-negative bacteria and an increased abundance of Firmicutes in TSOD mice but rather caused additional changes in bacteria in six genera. However, caffeine and chlorogenic acid partially improved the disrupted plasma SCFA profile in TSOD mice, although coffee had no effects. Whether these alterations in the gut microbiome and the plasma SCFA profile might affect the liver pathology of TSOD mice may deserve further investigation.
Metabolic syndrome is a disorder that encompasses a group of symptoms that are related to obesity and met-abolic modifications, and raises the risk of developing cardiovascular disease and type 2 diabetes mellitus1,2.
This syndrome has the clinical manifestations of hyperglycemia, insulin resistance, hyperlipidemia, nonalcoholic fatty liver disease (NAFLD), and progressive phenotype of NAFLD, nonalcoholic steatohepatitis (NASH)3–5. The
crucial characteristic of metabolic syndrome is persisting low-grade inflammation6. We previously showed that
Tsumura Suzuki obese diabetes (TSOD) mice, that were found to spontaneously develop type 2 diabetes mellitus in the original reports7,8, also spontaneously developed NASH9. Currently, TSOD mice are an accepted mouse
model of metabolic syndrome10.
Mammals possess diverse and extremely active gut microbiota that includes over 10 trillion microbial cells and 1000 microbial strains11. Gut microbiota affects the physiology of the hosts ranging from energy
metab-olism to immune responses12,13, and growing evidence supports that alterations in gut microbiota
compo-sition, i.e., changes that are referred to as gut dysbiosis, involve in the development of metabolic syndrome
1Department of Pathology and Laboratory Medicine, Graduate School of Biomedical Sciences, Tokushima University,
3-18-15 Kuramoto-cho, Tokushima, 770-8503, Japan. 2Department of Biochemistry, Wakayama Medical University,
811-1 Kimiidera, Wakayama, 641-8509, Japan. 3Next Generation Science Institute, Morinaga Milk Industry Co.,
Ltd., 5-1-83 Higashihara, Zama, Kanagawa, 252-8583, Japan. 4Laboratory of Clinical and Analytical Chemistry,
College of Pharmaceutical Sciences, Ritsumeikan University, 1-1-1 Nojihigashi, Kusatsu, Shiga, 525-8577, Japan.
5Education Support Room for Anatomy, Tokushima University, 3-18-15 Kuramoto-cho, Tokushima, 770-8503, Japan. 6Department of Medicine for Aging in Place and Community-Based Medical Education, Nagoya City University,
Graduate School of Medical Sciences, 1 Kawasumi, Mizuho-cho, Mizuho-ku, Nagoya, Aichi, 467-8601, Japan. Correspondence and requests for materials should be addressed to K.T. (email: [email protected]) Received: 3 January 2018
Accepted: 8 October 2018 Published: xx xx xxxx
including NAFLD, NASH, and diabetes mellitus especially from the aspect of inflammation that is associated with obesity14–26. The most plentiful product of undigested dietary fibers by bacterial fermentation are 1–6
carbons-containing short-chain fatty acids (SCFAs) which link gut microbiota and the host’s physiology12,27–29. In
addition to functioning as an energy substrate, SCFAs affect several physiological processes of the hosts’ tissues and organs by modulating anti-inflammatory responses and neuroendocrine system29,30. Thus, the gut microbiota
plays a critical role in the development of obesity and metabolic syndrome via regulating the types and quantity of SCFAs. Indeed, we previously reported that metabolic syndrome-affected TSOD mice demonstrated gut dysbiosis and subsequent disruption of the plasma SCFA profile31.
Coffee is one of the most popular beverages worldwide. It contains more than 1500 chemical components including phenolic polymers, polysaccharides, minerals, caffeine, and chlorogenic acid32. In addition to caffeine,
which is a major water-soluble component of coffee (1%), several other components such as chlorogenic acid (4%) are reportedly biologically active33. Consumption of coffee or chlorogenic acid has been associated with
alterations in the risk of metabolic syndrome and NAFLD34,35. Also, we previously reported that daily intake of
coffee, not caffeine-free coffee, prevented the onset of hepatic pathology without affecting obesity or hyperlipi-demia in TSOD mice36. Here, we focused on caffeine and chlorogenic acid as major bioactive coffee components,
and we hypothesized that coffee or its major components may improve the hepatic pathology in TSOD mice by repairing the gut dysbiosis and disrupted plasma SCFA profile.
Results
Daily intake of coffee or major coffee components prevented hepatic lobular inflammation in
TSOD mice.
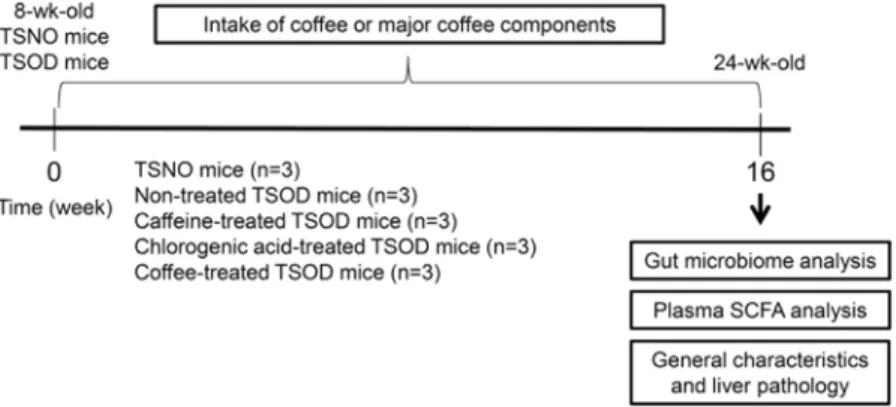
The experimental design of this study is shown in Fig. 1. We first analyzed the general character-istics and histopathology of the livers of 24-wk-old TSOD male mice that were given caffeine, chlorogenic acid, or coffee and age-matched Tsumura Suzuki non-obesity mice (TSNO mice, controls). As Fig. 2a,c shows, 24-wk-old TSOD mice demonstrated obesity-related alterations, such as increased body weight (1.5-fold increase, P < 0.01) and visceral fat (1.5-fold increase, P < 0.01), compared with TSNO mice. We did not detect significant differences in blood glucose levels in TSNO and TSOD mice (Fig. 2b). These obesity-related alterations were not improved by the intake of coffee or its components (Fig. 2a,c). The histopathological characteristics of the liver were scored according to our previous report9 (Fig. 2d–f). The average of NAS scores of TSOD mice were 3.7, which wascom-parable to those in our previous report (Fig. 2g)9. Liver lobular inflammation, i.e., infiltration of inflammatory
cells into liver parenchyma, was reduced in the coffee-, caffeine-, and chlorogenic acid-treated groups (Fig. 2d).
The gut microbiome in TSOD mice that were treated with coffee or its components.
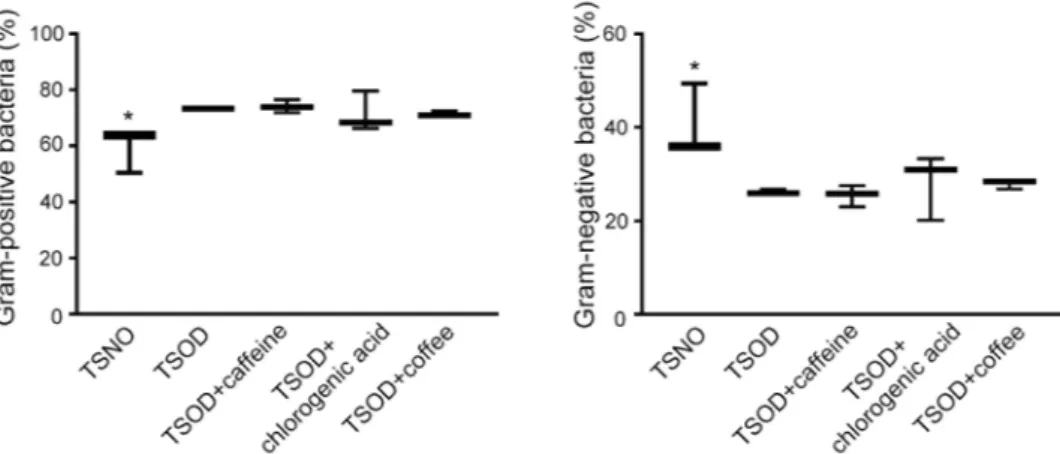
The use of fecal microbiota as a substitute for gut microbiota is generally accepted, so we analyzed the species in the microbi-ota via 16S ribosomal RNA (rRNA) gene sequencing of DNA obtained from the fecal samples. As Fig. 3 illustrates, 24-wk-old metabolic syndrome mice (TSOD mice) and age-matched TSNO mice (controls) had different levels of Gram-positive (1.2-fold increase, FDR adjusted Q < 0.05) and Gram-negative bacteria (0.8-fold decrease, FDR adjusted Q < 0.05), which is consistent with results found in our previous report31. However, we observed nosig-nificant changes in the contents of Gram-positive and Gram-negative bacteria among the untreated TSOD mice and the coffee- or coffee component-treated TSOD mice (Fig. 3). As in our previous report, we found a 1.1-fold increased percentage of Firmicutes with a favorable trend (FDR adjusted Q = 0.0594) and a significant decrease in Bacteroidetes (0.8-fold decrease, FDR adjusted Q < 0.05) in TSOD mice compared with TSNO mice (Fig. 4a)31.
The ratio of Firmicutes to Bacteroidetes was 1.6-fold higher in TSOD mice compared to TSNO mice (P < 0.05, Fig. 4b). Again, we observed no changes in the percentages of these bacteria (Fig. 4a,b). These results suggest that daily intake of coffee or its components did not repair the gut dysbiosis in TSOD mice.
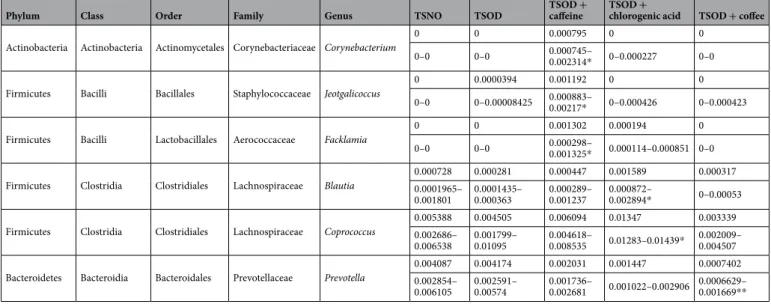
Instead, in the fecal samples from the mice, we found that the percentages of six genera changed signifi-cantly versus non-treated TSOD mice in the groups treated with caffeine, chlorogenic acid, or coffee (Table 1). These bacteria included Blautia, Coprococcus, and Prevotella, which have been implicated in inflammation or obesity37–43.
Figure 1. Experimental flow chart. Animals were divided into five groups (n = 3 in each group): TSNO mice; non-treated TSOD mice; caffeine-treated TSOD mice; chlorogenic acid-treated TSOD mice; and coffee-treated group. After the experiment, the liver was subjected to histopathological and immunohistochemical analysis.
The type and quantity of SCFAs in plasma.
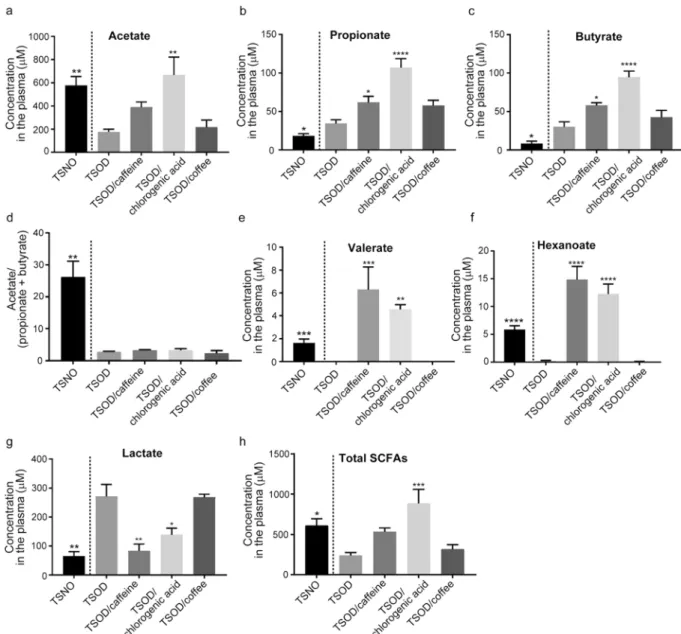
In our previous study, we reported dysbiosis and distur-bances in the type of plasma SCFAs in metabolic syndrome-affected TSOD mice29. Thus, we next investigatedthe effects of daily consumption of coffee or its components on plasma SCFA profiles in TSOD mice. Figure 5a indicates that chlorogenic acid recovered the reduced acetate level in TSOD mice. However, caffeine and chloro-genic acid increased the plasma concentrations of propionate and butyrate even more (propionate, 1.5- to 4-fold increase, P < 0.05 (caffeine-treated group) and P < 0.0001 (chlorogenic acid-treated group) versus non-treated Figure 2. General liver characteristics and pathological scores in 24-wk-old TSOD mice that were treated with coffee or its components and in age-matched TSNO mice. (a) Body weight (b) blood glucose level (c) ratio of visceral fat to body weight, and scores for (d) liver steatosis (e) lobular inflammation (f) hepatocellular ballooning and (g) NAFLD activity score (NAS). Data are means ± SD. *P < 0.05; **P < 0.01 versus all groups.
Figure 3. Analysis of the percentages of Gram-positive bacteria and Gram-negative bacteria in 24-wk-old TSOD mice that were treated with coffee or its components and in age-matched TSNO mice. Comparison of the percentages of Gram-positive bacteria and Gram-negative bacteria. Boxes show the interquartile ranges of the first and third quartiles; medians are shown by the lines in the boxes. If no error bars are shown, the experimental error was smaller than the symbol. *FDR adjusted Q < 0.05 versus non-treated TSOD, TSOD + caffeine and TSOD + coffee mice.
Figure 4. Analysis of fecal bacteria at the phylum level in caffeine-, chlorogenic acid-, and coffee-treated groups and in age-matched TSNO mice. (a,b) Comparison of the percentages (a) and ratio (b) of the Firmicutes bacteria and the Bacteroidetes bacteria in caffeine-, chlorogenic acid-, and coffee-treated groups. (a) Boxes show the interquartile ranges of the first and third quartiles; medians are shown by the lines in the boxes. If no error bars are shown, the experimental error was smaller than the symbol. *FDR adjusted Q < 0.05 versus non-treated TSOD mice. (b) Data are means ± SEM (n = 3). #P < 0.05 versus non-treated TSOD, TSOD + caffeine
group; butyrate, 1.5- to 3-fold increase, P < 0.05 (caffeine-treated group) and P < 0.0001 (chlorogenic acid-treated group) versus non-treated group; Fig. 5b,c). The ratio of acetate to butyrate plus propionate in TSOD mice therefore did not change in the caffeine- and chlorogenic acid-treated groups (Fig. 5d). The levels of the minor SCFAs valerate and hexanoate, which were almost not measurable in untreated TSOD mice, reached detectable levels in the caffeine-treated and chlorogenic acid-treated groups (Fig. 5e,f). The quantity of lactate, the pre-cursor of SCFAs29, was significantly reduced in the caffeine-treated and chlorogenic acid-treated groups (0.3-
to 0.5-fold decreases, P < 0.01 (caffeine-treated group) and P < 0.001 (chlorogenic acid-treated group) versus non-treated group, Fig. 5g). To our surprise, however, we found no significant changes in the type and quantity of plasma SCFAs in the coffee-treated group (Fig. 5a–h). In addition, the plasma concentration of lactate in the coffee-treated group was similar to that in the non-treated TSOD group (Fig. 5g).
Discussion
Metabolic syndrome significantly alters gut microbiota in humans and in animal models. The most prominent changes are a reduced abundance of Bacteroidetes that is accompanied by an increased occurrence of Firmicutes in obese mice19, humans17, and patients with NASH21. We also previously reported an increased occurrence of
Firmicutes species together with a corresponding decrease in Bacteroidetes species in TSOD mice31. In
addi-tion, we reported that the percentages of several bacteria at the family and genus levels were altered in TSOD mice, a spontaneous model of metabolic syndrome, which led us to conclude that TSOD mice had their own microbial signature, called the TSOD microbiome. As an important finding, this TSOD microbiome occurred independently of diet, which is consistent with findings in the report of Ley et al.19 and suggests that the TSOD
microbiome was related to metabolic syndrome.
Because of our previous report showing that coffee and its components prevented the development of NASH pathological characteristics in TSOD mice36, for this study we investigated the hypothesis that coffee or its
com-ponents can affect the gut microbiome and SCFA profile in TSOD mice and thereby improve hepatic inflamma-tion. Here, caffeine and chlorogenic acid treatments partly restored the disrupted plasma SCFA profile in TSOD mice. Because we fed all mice standard chow throughout the study, the determinant of the SCFA profile was pre-sumably the composition of the gut microbiota in these groups. Thus, our results suggest that although the effect of consumption of caffeine or chlorogenic acid on the gut microbiome is not accompanied by marked changes, these coffee components might repair the disrupted SCFA profile by modulating the gut microbial community. Additional experiments with a number enough of mice to allow possible correlations would be needed to evaluate this possibility.
Daily intake of coffee or its components did not improve the gut dysbiosis in TSOD mice. Rather, we found that the percentages of six microbial genera changed in these mice. These genera were completely different from genera that were altered in TSOD mice in our previous report31. Among them, we found that the percentages
of Blautia and Coprococcus in the Firmicutes phylum were higher in the chlorogenic acid-treated group than in the untreated group. The percentage of bacteria in these genera reportedly increased in obese individuals in a Japanese population44. Another study also reported an increased occurrence of Blautia in rats fed a high-fat
diet37. These data suggest a potential role of these genera in the development of obesity. However, the
occur-rence of Coprococcus correlated with fasting levels of gastrointestinal polypeptide in obese women38. Because
Firmicutes Clostridia Clostridiales Lachnospiraceae Coprococcus 0.0053880.002686– 0.004505 0.006094 0.01347 0.003339
0.006538 0.001799–0.01095 0.004618–0.008535 0.01283–0.01439* 0.002009–0.004507
Bacteroidetes Bacteroidia Bacteroidales Prevotellaceae Prevotella 0.0040870.002854– 0.004174 0.002031 0.001447 0.0007402
0.006105 0.002591–0.00574 0.001736–0.002681 0.001022–0.002906 0.0006629–0.001669**
Table 1. Bacteria whose percentages changed significantly in 24-wk-old TSOD mice that were treated with caffeine, chlorogenic acid, or coffee. Values are medians and interquartile ranges of the percentages. FDR adjusted Q-value of 0.05 was considered statistically significant. Q values versus untreated TSOD mice were calculated by the Benjamini and Hochberg method and the results were considered statistically significant when
gastrointestinal polypeptide is known to stimulate insulin secretion39, Coprococcus may protect against metabolic
syndrome. The percentage of Blautia bacteria reportedly increased in humans after consumption of whole grain, which may contribute to the anti-inflammatory effect of whole grain40. As an intriguing result, the daily intake of
chlorogenic acid in the present study improved the hepatic lobular inflammation of TSOD mice without altering the body weight. Because Blautia was reportedly involved in acetate production45, the increased abundance of
Blautia may contribute to the increased plasma concentration of acetate. However, given that the plasma SCFA
profile depends on the whole microbial community30, identifying a single bacterial species responsible for the
alteration of the quantity or type of plasma SCFAs in caffeine-treated and chlorogenic acid-treated groups will be difficult. The involvement of Prevotella species, which are Gram-negative rods, is relatively well-documented. A decrease in the percentage of Prevotella species was associated with improvement in endotoxemia and sys-temic inflammation in diabetic mice42. The abundance of Prevotella also reportedly increased in obese humans43.
In agreement with these reports, the percentage of Prevotella decreased in our coffee-treated TSOD mice. As
Prevotella has been implicated in degradation of dietary fibers46, the abundance of this bacteria might depend on
the brand of coffee. Involvement of these genera in Table 1 in the pathology of metabolic syndrome remains to be elucidated.
Figure 5. Analysis of plasma SCFAs in caffeine-, chlorogenic acid-, and coffee-treated groups and in age-matched TSNO mice. (a–d) Concentrations of the major SCFAs (a, acetate; b, propionate; and c, butyrate) and the ratio of acetate to propionate plus butyrate (d). (e–h) The concentrations of the minor SCFAs (e, valerate; and f, hexanoate) and the concentration of total plasma SCFAs (h). The Concentration of the precursor of SCFAs, lactate, was also determined (g). Data are means ± SEM (n = 3). *P < 0.05; **P < 0.01; ***P < 0.001; ****P < 0.0001 versus non-treated TSOD mice.
In summary, we showed that coffee and its components improved liver lobular inflammation in a spontaneous mouse model of metabolic syndrome, affected also the gut microbial community and, in the case of the coffee components additionally influenced plasma SCFA profile. Some of the bacterial genera identified could be fur-ther studied as potentially protective against the pathology of metabolic syndrome particularly that is associated with inflammation. Additional studies with more animals in each group and a longer consumption period are necessary to investigate the effects of coffee and its components on various pathological features of metabolic syndrome. Studies of patients are also a challenge for the future.
Methods
Animals.
Male twelve TSOD mice and three TSNO mice were purchased from the Institute for Animal Reproduction (Ibaraki, Japan). We reared two or three mice in plastic cages that were kept in a non-barrier-main-tained animal room under the following conditions: 23 ± 2 °C, 50 ± 10% relative humidity, and a 12/12-h light/ dark cycle. All mice were fed the basal diet MF (Oriental Yeast Co., Ltd., Tokyo, Japan) and had access to chlo-rinated water ad libitum. Eight-week-old TSOD mice were given coffee (Nescafe Gold Blend Gold Label; Nestle Japan, 0.5%) or its components, caffeine (INDOFINE Chemical Company, Inc., Hillsborough, NJ, 0.012%) or chlorogenic acid (INDOFINE Chemical Company, Inc., 0.0195%), by mouth, for 16 wk (referred to as the cof-fee-treated group, caffeine-treated group, and chlorogenic acid-treated group, respectively). Each group contained three mice. The content of caffeine or chlorogenic acid corresponded to that in 0.5% coffee. Coffee and its compo-nents were administered by dissolving the test substance in self-pumped water containing sodium hypochlorite. The animals had free access to these liquids. No differences were noted in the volume of liquids that the animals in the different groups drank throughout the study. The intake amounts of coffee and its components in the present study fell within the range of amounts recommended by the European Food Safety Authority. This study was per-formed according to the “Consensus Author Guidelines on Animal Ethics and Welfare” specified by the Institute for Animal Reproduction (Ibaraki, Japan), which were developed and published in 2010 by the International Association of Veterinary Editors. All experimental protocols were also approved by the animal research commit-tee of the Institute for Animal Reproduction.Analysis of the gut microbiome.
We used the isopropanol precipitation technique to extract DNA from fecal samples. In this method, we suspended mouse feces (30–40 mg) in phosphate-buffered saline (19× volume) and homogenized the sample with the FastPrep-24 homogenizer (MP Biomedicals, Santa Ana, CA). A sample that contained 250 μL of TE buffer (200 mM Tris-HCl, 80 mM ethylenediaminetetraacetic acid, pH 9.0), 500 µL of TE-saturated phenol (Nippon Gene Co., Ltd., Tokyo, Japan), 50 µL of 10% sodium dodecyl sulfate, and 0.3 g of glass beads (0.1 mm diameter; As-One Co., Ltd., Osaka, Japan, #BZ-01) was added to 200 μL of the homogenized samples of feces. These samples were homogenized again for 30 s with the FastPrep-24 homogenizer, and then they were centrifuged at 15,000 rpm at 4 °C for 5 min. We added a 400-μL sample of a mixture of phenol, chlo-roform, and isoamyl alcohol (25:24:1) (Nippon Gene Co., Ltd.) to the supernatant, vortexed it for 10 s, and cen-trifuged it at 15,000 rpm at 4 °C for 5 min. We added 250 μL of isopropanol obtained from Wako Pure Chemical Industries Ltd. (Osaka, Japan) to 250 μL of the supernatant, mixed it by flipping, and kept the mixture at room temperature for 10 min, after which we centrifuged the sample at 15,000 rpm at room temperature for 10 min. We removed the supernatant and washed the resultant pellet with 400 μL of ice-cold ethanol. We air-dried the extracted DNA and then dissolved it in 2000 μL of TE buffer (pH 8.0). We amplified the V3-V4 region of the bacterial 16 S rRNA gene by means of PCR with the TaKaRa Ex Taq HS Kit (TaKaRa Bio, Shiga, Japan) and the Tru357F primer set (5ʹ-CGCTCTTCCGATCTCTGTACGGRAGGCAGCAG-3ʹ) and Tru806R primer set (5ʹ-CGCTCTTCCGATCTGACGGACTACHVGGGTWTCTAAT-3ʹ). We concentrated the DNA by amplifying it, in triplicate, via PCR: 94 °C preheating for 3 min, and then 30 cycles of denaturation at 94 °C for 30 s, annealing at 50 °C for 30 s, extension at 72 °C for 30 s, and a terminal extension at 72 °C for 5 min. We then amplified the 16 S rRNA gene amplicons with a 2nd primer set that was adapted for the Illumina MiSeq (Illumina, San Diego, CA) as previously described53. DNA was amplified according to the above-mentioned thermal cycling pattern,except that the cycle number was 15, and the 2nd amplified PCR products were purified by using a QIAquick PCR Purification Kit (Qiagen, Hilden, Germany), after which purified PCR products were quantified with a Quant-iT PicoGreen dsDNA Assay kit (Thermo Fisher Scientific, Carlsbad, CA). After removing primer-dimer by using the QIAquick PCR Purification Kit, sequences of the libraries were determined by means of an Illumina MiSeq instrument with a MiSeq v3 Reagent kit (Illumina, San Diego, CA). Data were analyzed as previously described54 with several modifications. The Illumina paired-end reads that passed the quality filters were
using reference-based chimera checking in USEARCH (ver. 5.2.32)56 and the gold database (http://drive5.com/
otupipe/gold.tz). Non-chimeric sequences were analyzed with the QIIME software package (version 1.7.057,58)
by using closed-reference operational taxonomic unit (OTU) picking against 16S rRNA genes of 15 species of predominant human gut-derived microbiota and B. longum BB536.
Histopathological and immunohistochemical analyses.
We recorded the body weights at the start and at the end of the experimental period. Immediately after the animals were killed, we rapidly excised the liver and visceral fat and rinsed them in ice-cold saline. We fixed the excised organs with 10% neutral-buffered for-malin and embedded them in paraffin for histological analysis. We stored some liver samples at −80 °C. We cut formalin-fixed, paraffin-embedded liver tissue into 4-μm-thick serial sections and stained them with hematox-ylin and eosin. We also stained a frozen 5-μm-thick section with Sudan IV and hematoxhematox-ylin counterstaining for lipid analysis. We scored the liver histology by using a semiquantitative method: steatosis (scored 0–3), lobular inflammation (scored 0–3), and hepatocellular ballooning (scored 0–2), as described in our previous report9. Wescored three representative areas in each section and used the averages as the final scores. The sum of the scores of steatosis, lobular inflammation, and hepatocellular ballooning was presented as the NAFLD activity score (NAS).
Analysis of SCFAs in plasma.
We performed SCFA analysis for nine analytes. We purchased acetate, propi-onate, lactate, butyrate, isobutyrate, valerate, isovalerate, pivalate, and hexanoate from Wako Pure Chemical Co. We obtained propionate-d6, butyrate-d5, valerate-d9, and hexanoate-d11 from Sigma-Aldrich Co. (St. Louis, MO)and CDN Isotopes Co. (Quebec, Canada) for use as internal standards (IS). We purchased triphenylphosphine (TPP), 2,2-dipyridyl disulfide (DPDS), and 2-picolylamine from Tokyo Kasei Co. (Tokyo, Japan). We used meth-anol to prepare these stock solutions.
We used the Waters Acquity H Class ultra-performance liquid chromatography (UPLC) system (Waters Co., Milford, MA). We performed a reverse phase analysis via an Acquity UPLC BEH C18 column (1.7 μm,
2.1 × 100 mm) at 40 °C, with an injection volume of 5 μL. The mobile phase, which contained solvent A (0.1% formic acid in water) and solvent B (0.1% formic acid in methanol), was delivered at a 0.3 mL/min flow rate. We used the following gradient elution: B% = 2, 2, 35, 45, and 98 (0, 3, 10, 12, and 14 min). We operated the Waters Xevo TQD triple quadrupole mass spectrometer with an electrospray ionization (ESI) source in the positive mode, with the following ionization source conditions: capillary voltage, 2.00 kV; cone voltage, 20–70 V; collision energy, 10–40 eV; source temperature, 150 °C; and desolvation temperature, 400 °C. The cone gas flow was 50 L/h and the desolvation gas flow was 800 L/h, and they were obtained via a nitrogen source (N2 Supplier Model 24 S;
Anest Iwata, Yokohama, Japan). In view of a previous report describing derivatization of carboxylic acids59, we
used methanol to dilute mixed SCFAs and IS solutions. We reacted these solutions with 2-picolylamine in DPDS and TPP in acetonitrile for 10 min at 60 °C. We removed the reaction mixtures and re-dissolved them in 100 μL of methanol/water (80:20, v/v). We used UPLC-ESI-MS/MS to analyze the derivatization solutions (5 μL). We added thawed plasma samples to IS and mixed these samples with equal volumes of methanol and QuEChERS (Supel QuE PSA (EN) 25 mg), after which they were vortexed vigorously and centrifuged for 5 min at 15,000 rpm. We then removed the supernatant and re-dissolved the remaining residue in methanol and derivatized it by using the process described above for 2-picolylamine. We then used UPLC-ESI/MS/MS to analyze the samples.
Statistical analysis.
The statistical differences in the body weight, visceral fat, the ratio of Firmicutes to Bacteroidetes, and plasma SCFAs between groups were evaluated using one-way analysis of variance followed by Dunnett’s test (Fig. 2a,c, Fig. 4b, and Fig. 5), by means of Prism software (GraphPad Software, La Jolla, CA). We set the level of significance at P < 0.05. In order to assess whether significant differences occurred in an abundance of bacteria, a multiple-comparison procedure that controls the false-discovery rate (FDR) were performed by using the Benjamini and Hochberg method. FDR adjusted Q value of 0.05 was considered statistically significant (Fig. 3, Fig. 4a, and Table 1).References
1. Grundy, S. M. et al. Diagnosis and management of the metabolic syndrome: an American Heart Association/National Heart, Lung, and Blood Institute Scientific Statement. Circulation 112, 2735–2752 (2005).
2. Wilson, P. W., D’Agostino, R. B., Parise, H., Sullivan, L. & Meigs, J. B. Metabolic syndrome as a precursor of cardiovascular disease and type 2 diabetes mellitus. Circulation 112, 3066–3072 (2005).
3. Kaur, J. A comprehensive review on metabolic syndrome. Cardiol Res Pract 2014, 943162 (2014). 4. Nathan, C. Epidemic inflammation: pondering obesity. Mol Med 14, 485–492 (2008).
5. Matteoni, C. A. et al. Nonalcoholic fatty liver disease: a spectrum of clinical and pathological severity. Gastroenterology 116, 1413–1419 (1999).
6. Chassaing, B. & Gewirtz, A. T. Gut microbiota, low-grade inflammation, and metabolic syndrome. Toxicol Pathol 42, 49–53 (2014). 7. Miura, T. et al. Impairment of insulin-stimulated GLUT4 translocation in skeletal muscle and adipose tissue in the Tsumura Suzuki
obese diabetic mouse: a new genetic animal model of type 2 diabetes. Eur J Endocrinol 145, 785–790 (2001).
8. Takahashi, A. et al. Insulin resistance and low sympathetic nerve activity in the Tsumura Suzuki obese diabetic mouse: a new model of spontaneous type 2 diabetes mellitus and obesity. Metabolism 55, 1664–1669 (2006).
9. Nishida, T. et al. Spontaneous onset of nonalcoholic steatohepatitis and hepatocellular carcinoma in a mouse model of metabolic syndrome. Lab Invest 93, 230–241 (2013).
10. Tsuneyama, K. et al. Animal models for analyzing metabolic syndrome-associated liver diseases. Pathol Int 67, 539–546 (2017). 11. Sommer, F. & Backhed, F. The gut microbiota–masters of host development and physiology. Nat Rev Microbiol 11, 227–238 (2013). 12. Rooks, M. G. & Garrett, W. S. Gut microbiota, metabolites and host immunity. Nat Rev Immunol 16, 341–352 (2016).
13. Nicholson, J. K. et al. Host-gut microbiota metabolic interactions. Science 336, 1262–1267 (2012).
14. Dumas, M. E. et al. Metabolic profiling reveals a contribution of gut microbiota to fatty liver phenotype in insulin-resistant mice.
Proc Natl Acad Sci USA 103, 12511–12516 (2006).
15. Abu-Shanab, A. & Quigley, E. M. The role of the gut microbiota in nonalcoholic fatty liver disease. Nat Rev Gastroenterol Hepatol 7, 691–701 (2010).
Microbiol 3, 431–438 (2005).
28. Neves, A. L. et al. The microbiome and its pharmacological targets: therapeutic avenues in cardiometabolic diseases. Curr Opin
Pharmacol 25, 36–44 (2015).
29. Koh, A., De Vadder, F., Kovatcheva-Datchary, P. & Backhed, F. From Dietary Fiber to Host Physiology: Short-Chain Fatty Acids as Key Bacterial Metabolites. Cell 165, 1332–1345 (2016).
30. Ha, C. W., Lam, Y. Y. & Holmes, A. J. Mechanistic links between gut microbial community dynamics, microbial functions and metabolic health. World J Gastroenterol 20, 16498–16517 (2014).
31. Nishitsuji, K. et al. Analysis of the gut microbiome and plasma short-chain fatty acid profiles in a spontaneous mouse model of metabolic syndrome. Scientific Reports 7 (2017).
32. Dorea, J. G. & da Costa, T. H. Is coffee a functional food? Br J Nutr 93, 773–782 (2005).
33. Sato, Y. et al. In vitro and in vivo antioxidant properties of chlorogenic acid and caffeic acid. Int J Pharm 403, 136–138 (2011). 34. Yesil, A. & Yilmaz, Y. Review article: coffee consumption, the metabolic syndrome and non-alcoholic fatty liver disease. Aliment
Pharmacol Ther 38, 1038–1044 (2013).
35. Ma, Y., Gao, M. & Liu, D. Chlorogenic acid improves high fat diet-induced hepatic steatosis and insulin resistance in mice. Pharm
Res 32, 1200–1209 (2015).
36. Watanabe, S. et al. Daily Coffee Intake Inhibits Pancreatic Beta Cell Damage and Nonalcoholic Steatohepatitis in a Mouse Model of Spontaneous Metabolic Syndrome, Tsumura-Suzuki Obese Diabetic Mice. Metab Syndr Relat Disord 15, 170–177 (2017). 37. Lecomte, V. et al. Changes in gut microbiota in rats fed a high fat diet correlate with obesity-associated metabolic parameters. PLoS
One 10, e0126931 (2015).
38. Gomez-Arango, L. F. et al. Connections Between the Gut Microbiome and Metabolic Hormones in Early Pregnancy in Overweight and Obese Women. Diabetes 65, 2214–2223 (2016).
39. Meier, J. J., Nauck, M. A., Schmidt, W. E. & Gallwitz, B. Gastric inhibitory polypeptide: the neglected incretin revisited. Regul Pept
107, 1–13 (2002).
40. Martinez, I. et al. Gut microbiome composition is linked to whole grain-induced immunological improvements. ISME J 7, 269–280 (2013).
41. Hardy, H., Harris, J., Lyon, E., Beal, J. & Foey, A. D. Probiotics, prebiotics and immunomodulation of gut mucosal defences: homeostasis and immunopathology. Nutrients 5, 1869–1912 (2013).
42. Tilg, H. & Kaser, A. Gut microbiome, obesity, and metabolic dysfunction. J Clin Invest 121, 2126–2132 (2011).
43. Clarke, S. F. et al. The gut microbiota and its relationship to diet and obesity: new insights. Gut Microbes 3, 186–202 (2012). 44. Kasai, C. et al. Comparison of the gut microbiota composition between obese and non-obese individuals in a Japanese population, as
analyzed by terminal restriction fragment length polymorphism and next-generation sequencing. BMC Gastroenterol 15, 100 (2015). 45. Schiel-Bengelsdorf, B. & Durre, P. Pathway engineering and synthetic biology using acetogens. FEBS Lett 586, 2191–2198 (2012). 46. Flint, H. J., Scott, K. P., Duncan, S. H., Louis, P. & Forano, E. Microbial degradation of complex carbohydrates in the gut. Gut
Microbes 3, 289–306 (2012).
47. Ucar, F. et al. The relationship between oxidative stress and nonalcoholic fatty liver disease: Its effects on the development of nonalcoholic steatohepatitis. Redox Rep 18, 127–133 (2013).
48. Rolo, A. P., Teodoro, J. S. & Palmeira, C. M. Role of oxidative stress in the pathogenesis of nonalcoholic steatohepatitis. Free Radic
Biol Med 52, 59–69 (2012).
49. Vitaglione, P. et al. Coffee reduces liver damage in a rat model of steatohepatitis: the underlying mechanisms and the role of polyphenols and melanoidins. Hepatology 52, 1652–1661 (2010).
50. Cadden, I. S., Partovi, N. & Yoshida, E. M. Review article: possible beneficial effects of coffee on liver disease and function. Aliment
Pharmacol Ther 26, 1–8 (2007).
51. Panchal, S. K., Poudyal, H., Waanders, J. & Brown, L. Coffee extract attenuates changes in cardiovascular and hepatic structure and function without decreasing obesity in high-carbohydrate, high-fat diet-fed male rats. J Nutr 142, 690–697 (2012).
52. Gniechwitz, D., Reichardt, N., Blaut, M., Steinhart, H. & Bunzel, M. Dietary fiber from coffee beverage: degradation by human fecal microbiota. J Agric Food Chem 55, 6989–6996 (2007).
53. Odamaki, T. et al. Age-related changes in gut microbiota composition from newborn to centenarian: a cross-sectional study. BMC
Microbiol 16, 90 (2016).
54. Yatsunenko, T. et al. Human gut microbiome viewed across age and geography. Nature 486, 222–227 (2012). 55. Aronesty, E. Comparison of Sequencing Utility Programs. Open Bioinforma 7, 1–8 (2013).
56. Edgar, R. C., Haas, B. J., Clemente, J. C., Quince, C. & Knight, R. UCHIME improves sensitivity and speed of chimera detection.
Bioinformatics 27, 2194–2200 (2011).
57. Caporaso, J. G. et al. QIIME allows analysis of high-throughput community sequencing data. Nat Methods 7, 335–336 (2010). 58. Kuczynski, J. et al. Using QIIME to analyze 16S rRNA gene sequences from microbial communities. Curr Protoc Microbiol Chapter
1, Unit1E 5 (2012).
59. Higashi, T. et al. Simple and practical derivatization procedure for enhanced detection of carboxylic acids in liquid chromatography-electrospray ionization-tandem mass spectrometry. J Pharm Biomed Anal 52, 809–818 (2010).
Acknowledgements
The authors thank the Support Center for Advanced Medical Sciences, Institute of Biomedical Sciences, Tokushima University Graduate School. This work was supported by JSPS KAKENHI Grant-in-Aid for Scientific Research (B) Number 24390181, (C) Number 25340121, Grant-in-Aid for Challenging Exploratory Research Number 15K15098 to K.T. from the Japan Society for the Promotion of Science, and a research grant of 2012 and 2015 from the All Japan Coffee Association to K.T.
Author Contributions
K.N. performed the experiments, interpreted the data, and wrote the paper. J-z.X. analyzed the gut microbiome and interpreted the data. R.N. and K.I. measured the SCFA concentration and interpreted the data. S.W., H.O., T.T., H.U. and Y.M. performed the experiments. H.A. contributed reagents, materials, and analytical tools and supervised the entire project. K.T. designed the research, interpreted the data, and wrote the paper and takes full responsibility for the manuscript. All authors reviewed the results and approved the final version of the manuscript.
Additional Information
Competing Interests: J-z.X. is an employee of Morinaga Milk Industry Co., Ltd. Other authors declare that no competing interests exist.
Publisher’s note: Springer Nature remains neutral with regard to jurisdictional claims in published maps and institutional affiliations.
Open Access This article is licensed under a Creative Commons Attribution 4.0 International License, which permits use, sharing, adaptation, distribution and reproduction in any medium or format, as long as you give appropriate credit to the original author(s) and the source, provide a link to the Cre-ative Commons license, and indicate if changes were made. The images or other third party material in this article are included in the article’s Creative Commons license, unless indicated otherwise in a credit line to the material. If material is not included in the article’s Creative Commons license and your intended use is not per-mitted by statutory regulation or exceeds the perper-mitted use, you will need to obtain permission directly from the copyright holder. To view a copy of this license, visit http://creativecommons.org/licenses/by/4.0/.