JAIST Repository
https://dspace.jaist.ac.jp/
Title
Dynamics of a Probe Molecule Dissolved in Several Polymer Matrices with Different Side-Chain
Structures: Determination of Correlation Length Relevant to Glass Transition
Author(s) Nobukawa, Shogo; Urakawa, Osamu; Shikata, Toshiyuki; Inoue, Tadashi
Citation Macromolecules, 46(6): 2206-2215 Issue Date 2013-03-15
Type Journal Article
Text version author
URL http://hdl.handle.net/10119/12864
Rights
Shogo Nobukawa, Osamu Urakawa, Toshiyuki Shikata, and Tadashi Inoue, Macromolecules, 2013, 46(6), pp.2206-2215. This document is the unedited author's version of a Submitted Work that was subsequently accepted for publication in
Macromolecules, copyright (c) American Chemical Society after peer review. To access the final edited and published work, see
http://dx.doi.org/10.1021/ma302567j Description
Dynamics of a probe molecule dissolved in several polymer
matrices with different side chain structures: Determination of
correlation length relevant to glass transition
Shogo Nobukawa1,2*, Osamu Urakawa1*, Toshiyuki Shikata1†, and Tadashi Inoue1
1
Department of Macromolecular Science, Graduate School of Science, Osaka University, 1-1
Machikaneyama-cho, Toyonaka, Osaka 560-0043, Japan
2
School of Materials Science, Japan Advanced Institute of Science and Technology, Nomi,
Ishikawa 923-1292, Japan
Email: [email protected], [email protected]
TITLE RUNNING HEAD. Probe dynamics in polymers with different side-chains
* Corresponding author. E-mail: [email protected], [email protected],
† Present address: Department of Environmental and Natural Resource Sciences, Tokyo University of Agriculture and Technology, Fuchu, Tokyo 183-8509, Japan
Abstract
Dynamics of 4-pentyl-4’-cyanobiphenyl (5CB) dissolved in several polymers at
concentrations of 3- 7 wt% was examined by dielectric relaxation measurement. Glassy
(segmental) mode of the matrix polymer was also investigated by viscoelastic measurements
for the same samples. Polystyrene (PS), poly(4-methylstyrene) (P4MS), and
poly(4-tert-butylstyrene) (PtBS) were used as host polymers considering that they have the
same backbone structure but different side-chain bulkiness. Two dielectric relaxation modes
(slow and fast modes) of 5CB component appeared in all the mixtures and the relative
intensity of the fast mode increased in the order of PS < P4MS < PtBS, corresponding to the
order of the side-chain bulkiness and main chain stiffness. The effects of such chemical
structure differences on the two relaxation modes, particularly their temperature dependence
were examined in detail. Comparison of relaxation times for the fast mode and the
segmental dynamics of the matrix polymer suggests that the fast mode was attributed to the
restricted orientational fluctuation, which includes precession motion around the long axis, of
5CB molecule in a confined space formed by slow polymer chains. The dielectric intensity
of the fast mode increased with increasing side-chain bulkiness of polymers. This means
that the larger side-chain decreases the spatial restriction for the movement of guest 5CB
molecules in the glassy state. The slow mode was attributed to the rotational motion of 5CB
times of dielectric slow mode and viscoelastic glass mode were compared. Temperature
dependence of the slow mode was slightly different from that of the segmental motion of
polymer corresponding to the glass mode. From the difference between these relaxation
times, the correlation length relevant to the glass mode was determined as functions of
1. Introduction
The glass transition of materials including polymers, low-mass molecules (LMs),
miscible polymer blends, and polymer / LM mixtures has been widely studied for years.1-19
By cooling a material close to the glass transition temperature, Tg, the glassy relaxation
process (sometimes referred to as a-relaxation or segmental relaxation) is observed by viscoelastic (and also dielectric) measurements. Temperature dependence of its relaxation
time can be described with the William-Landel-Ferry (WLF) equation.5 In the case of
polymers, the most “relevant” motion to this relaxation mode is the micro-Brownian motion
of chain segment. In contrast, in neat LM systems the rotational motion of LMs is relevant
to this relaxation.20
Some polymer blends and polymer / LM mixtures, even in the miscible state, are
known to exhibit very broad glass transition revealed by differential scanning calorimetry
(DSC) measurement.15, 16 It has also been clarified that the component dynamics in such
mixtures has different temperature dependence. This means that each component has its
own effective glass transition temperature, Tgeff, if temperature dependence of the component
relaxation time is described by the WLF equation based on each Tgeff.13, 21-23 Such
phenomena are generally called “dynamic heterogeneity”.24, 25
Adachi et al. studied the dynamic heterogeneity of polystyrene (PS) / toluene (Tol)
this system, the rotational motion of Tol molecule decoupled from the segmental motion of PS
near the nominal (average) Tg. Furthermore, temperature dependence of the heat capacity
showed two step glass transitions; these two transitions occurred approximately at each Tgeff
of the two components. These experimental results show that PS / Tol system is
dynamically heterogeneous. On the other hand, trace amount of fluorescence dyes dissolved
in polymer matrices have been intensively used to probe the matrix polymer dynamics near
the glass transition by optical methods.7, 12, 28 In these studies, the probe motion was
anticipated to be cooperative with the polymer motion. However, dynamic heterogeneity of
PS / Tol system indicates that at least Tol molecule cannot be used as a probe molecule to
extract the PS dynamics. Then, a fundamental question arises: what kind of molecules can
be used as a probe to investigate the matrix polymer dynamics?
We have been focusing on the molecular size of LMs, which will be the key factor,
whether or not the LM dynamics couple with the matrix polymer dynamics. For the larger
size of LMs, the coupling will be stronger. By using LMs with much higher polarity
compared to the matrix polymer component, only the dielectric relaxation of LMs could be
observed. By such method, Urakawa et al.13, 22 and van den Berg et al.29 specified the
critical size of LMs to be between 0.65nm and 1.1 nm in PS matrix, at which LM motion and
segmental motion of PS couple each other, i.e., there is a crossover for both component
comparable with the length of Kuhn segment of PS (1.79nm).13, 22 According to Inoue30 and
Matsumiya et al.31, the size of the dynamic segment corresponding to the (Rouse)
beads-spring units for PS is similar to that of the Kuhn segment. Therefore, the critical LM
size estimated in their studies seems reasonable. It was also found that the component
dynamics in a dynamically homogeneous PS / 4-pentyl-4’-cyanobiphenyl (5CB) mixtures, i.e.,
rotational motion of 5CB, whose long axis is longer than the critical size, and global motion
of PS (terminal relaxation), had the same temperature dependence at T > Tg+20 K.32 This
result supported Urakawa’s conclusion. However, it is not clarified yet whether or not the
same T dependence holds in the vicinity of Tg, and how much difference there is in the
absolute values of the relaxation time between the rotational mode of 5CB and the segmental
mode of polymers.
Viscoelastic relaxation spectra for polymeric systems are known to be separable into
two modes reflecting the two different molecular motions: the terminal mode (including
rubbery region) originating in the orientation relaxation of whole polymer chains and the
glass mode due to more local motion. The terminal mode can be described by several
course-grained models such as tube model,33 beads-spring model,34 and so on. The motional
unit to be considered for the chain dynamics from the terminal to the rubbery region is so
called “Rouse segment”, whose size will not change by changing the temperature. In
intra- and inter-molecular interactions and is often denoted as just “glass segment” or
“cooperative rearranging region (CRR)”. Here, “glass segment” is a dynamical unit in a
single chain determined by both the intra- and inter-molecular interactions, while “CRR” is
the dynamical unit including neighbor molecules with which cooperative motion takes
place.17-19 Therefore, the notions of “segment” and “CRR” are not necessarily the same even
though they will have the similar length scales. Those sizes are believed to be dependent on
temperature in the vicinity of Tg.35 In this paper we compare the rotational motion of 5CB in
dynamically homogeneous 5CB / polymer mixtures with the viscoelastic glass mode as
functions of temperature and the relevant length scale of the glass mode is determined from
the length (long axis) of the rod-like LM molecule whose rotational relaxation time coincides
with the segmental relaxation time of polymer components.13, 32
Concerning the LM motion in polymer / LM mixtures, one important finding in our
previous studies32 is the existence of two separated relaxation modes (slow and fast modes)
both related to the LM motion. From the composition dependence of the fraction for the two
modes, we concluded that the rotational dynamics of a 5CB molecule took place in two steps.
The temperature dependence of relaxation time for the slow mode was similar to that for the
global chain dynamics, suggesting that the slow mode is governed by the fundamental
dynamical process of the coarse-grained polymer chain. On the other hand, the fast mode
the polymer chain motion. The LM concentrations of 5 - 20wt% (utilized in the previous
study) are in the region where the LM molecules are nearly isolated since the distance
between LMs (1.6-2.5 nm) is longer than the molecular size (1.3 nm in the long axis).
Therefore, the LM molecules are almost surrounded by polymers whose dynamics is slower
than the LM component. From this reason, confinement effect by the slow polymer matrix
will make the LM dynamics be localized. The fast mode was attributed to the restricted
motion (or wobbling motion) of LMs in a confined space which we call “cage” formed by less
mobile polymer chains. Furthermore, we think that the fast mode includes the precession
motion of rod like LMs about the long axis because it has lower energy barrier than the
fully-rotational motion. This was also reported by van der Berg et al.29
When a polymer has larger pendant groups, intermolecular distance between the
polymer backbones becomes farer. In this case, the cage restriction will be weakened,
probably resulting in the enhancement of the fast mode motion of LMs. In this study, in
order to evaluate the effect of the side-chain bulkiness, polystyrene (PS) and its derivatives,
poly(4-methylstyrene) (P4MS), and poly(4-tert-butylstyrene) (PtBS) were used as matrix
polymers. 5CB was chosen as a guest molecule of these three polymers. Dielectric and
viscoelastic measurements can probe the 5CB and polymer dynamics, respectively, because of
the following reasons; 5CB is dielectrically more active due its larger dipole moment than PS
to its high concentration and larger molecular sizes.
In our previous study only PS was examined as polymer matrix. By varying
polymer structures, the generality of the dynamical features observed in PS / LM systems will
be confirmed. The followings are the purposes of this study to be clarified: (1) examination of the relationship between the slow mode relaxation time of 5CB, t5CB, and segmental
relaxation time of PS, tseg, (2) determination of the relevant length scale to the glass mode
relaxation for the three polymers from the values of t5CB and tseg, and (3) examination of the
effect of the side chain bulkiness on the fast mode relaxation of LMs.
2. Experimental
2.1. Materials
Polystyrene (PS), poly(4-methyl styrene) (P4MS), and poly(4-tert-butyl styrene)
(PtBS) were synthesized by a living anionic polymerization of three monomers (styrene,
4-methyl styrene, and 4-tert-butyl styrene) with sec-butyl lithium as an initiator in benzene
solution. The weight-average molecular weight, Mw, and molecular weight distribution,
Mw/Mn, where Mn is a number-average molecular weight, were determined by
gel-permeation-chromatography (GPC) and the results are shown in Table 1.
4-pentyl-4’-cyanobiphenyl (5CB) was purchased from Wako Pure Chemical Industries, Ltd
[Table 1]
[Figure 1]
To prepare blend samples, polymer and 5CB at a weight ratio of 95/5 were dissolved
into benzene and then the solvent (benzene) was removed by freeze-dry method. To remove
any air bubbles and solvents remained inside the sample, all samples for dielectric and
viscoelastic measurements were annealed above Tg under vacuum for half a day. Since 5CB
slightly vaporized under vacuum, the blend compositions could not be precisely determined
by weighting. Therefore, the weight fraction of 5CB, W5CB, was determined by NMR
measurement using EXcalibur-270 (JEOL Ltd., Tokyo, Japan) or Mercury-300 (Varian,
California, USA) for deuterated chloroform solutions in which the small portion of the blend
film was dissolved. The W5CB values determined by NMR are shown in Table 2. The
compositions were checked before and after the dielectric and viscoelastic measurements and
confirmed that the values were almost unchanged.
[Table 2]
A dielectric relaxation (DR) measurement was performed using three instruments:
LCR meter (4284A, Hewlett Packard, USA), Fast-Fourier-Transform (FFT) analyzer (VC-2440, Hitachi, Japan), and impedance analyzer (β analyzer, Novocontrol Technologies GmbH & Co. KG, Germany). Temperature and frequency ranges were 300 − 430 K and 1
mHz − 3 MHz, respectively. To obtain dielectric data as functions of temperature, dielectric
permittivity was measured at frequencies scanned from 12 Hz to 200 kHz by LCR meter
(1693, Quad Tech Inc., USA) under gradual increase of temperatures from 100 K to 450 K
with a heating rate of 0.3 K min−1.
A dynamic viscoelastic relaxation measurement was conducted using a stress
rheometer (Physica MCR 301, Anton Paar GmbH, Austria) equipped with 4 mm parallel plate
for the same samples for which the DR measurements were made. The temperature and
frequency ranges were 338 − 453 K and 0.1 − 100 s−1, respectively.
A differential scanning calorimetry (DSC) measurement was performed to determine
the glass transition temperature, Tg, for each mixture from the midpoint of the jump in the
heat flow around the glass transition by using a differential calorimeter (DSC 6220,
EXSTAR-6000, Seiko Instruments Inc., Japan). After the viscoelastic measurements, Tg
values were checked again to confirm that the composition of mixtures did not change. The
determined Tg values for pure polymers and mixtures are shown in Tables 1 and 2,
3. Results and Discussion
3.1. Dielectric relaxation behavior of 5CB dissolved in three polymers
To examine the side-chain effect on the LM dynamics in polymer/LM mixtures,
dielectric relaxation behaviors of 5CB dissolved in PS, P4MS, and PtBS matrices are
compared. Urakawa et al.13 indicated that the LM motion became cooperative with the
dielectric a dynamics of PS when the LM size is comparable with or larger than the Kuhn
length, lK, of PS. Since the lK value is known to be almost the same with the Rouse segment
size,36-38 we estimated the corresponding lengths for PS, P4MS and PtBS, to be 1.79, 2.17 and
2.30 nm, respectively (listed in Table 1), from the reported molecular weight of the Rouse
segment39, Mseg, and the mean-square end-to-end distance divided by the molecular weight of
a repeating unit40, <R2>0/M. Note that this length increases with the size of the pendant
group of polymers.
Complex dielectric permittivity, ε* (= ε '–iε"), was measured as a function of
temperature, T, and angular frequency, w, for PS/5CB, P4MS/5CB and PtBS/5CB mixtures.
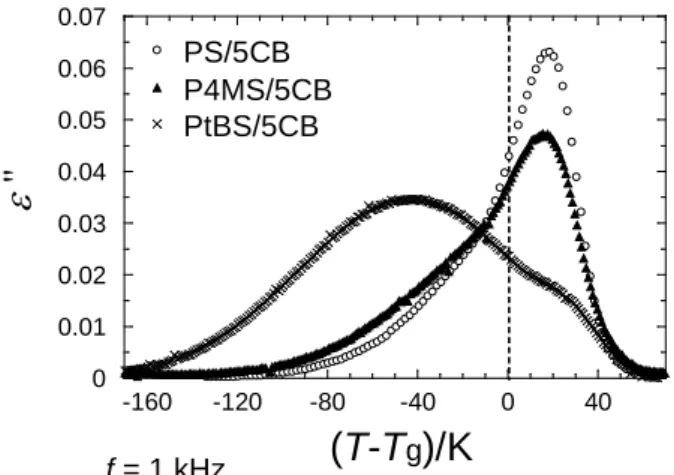
Here, ε ' and ε" are dielectric permittivity and loss, respectively. Fig. 2 shows T–Tg
dependence of dielectric loss measured at w = 6.3×10³
s–1 for three mixtures containing a
in P4MS and PtBS (4.4 and 4.8 wt%, respectively), this difference does not affect the
conclusion led by this study as will be mentioned later. Two relaxation processes appear
below and above the Tg. In our previous study,25 the major dispersion observed in PS/5CB
above Tg was assigned to the rotational motion of 5CB which was cooperative with the
segmental motion of polymers (slow mode) and the low temperature shoulder was ascribed to
the orientation fluctuation of 5CB in a confined space by the glassy matrix (fast mode). The
same assignment would be valid for the other two systems; P4MS/5CB and PtBS/5CB. The
relative intensity of the slow mode becomes weaker with increasing the side chain size of the
polymer (PS < P4MS < PtBS). Particularly, for PtBS/5CB system, the fast mode becomes a
major relaxation mode. This behavior indicates that side chain structure strongly affects the
dielectric relaxation behavior of the guest molecule.
[Figure 2]
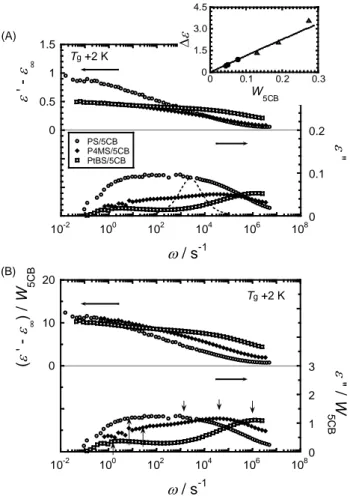
Fig. 3 (A) shows the frequency dependence of ε' and ε'' measured at Tg+2 K for the
same samples shown in Fig.2. If the rotational motion of polar molecules is characterized by
a single relaxation mode, the dielectric relaxation curve can be represented by the Debye
function.41 The ε'' curve of the Debye function is shown by the dashed curve in the Fig. 3(A) for reference. The observed ε'' curves are quite broad compared with the Debye spectrum
and have clear bimodal shape except for PS/5CB, indicating that two kinds of molecular
motion with very wide relaxation time distributions are involved in dielectric relaxation process. The top panel of this figure shows ε '–ε∞ as functions of w, where ε∞ is the limiting dielectric permittivity at high frequencies which can be determined by fitting the experimental data with eq (2) as will be mentioned later. The dielectric intensity, ∆ε, is given by the difference between ε ' at low frequencies (ε '(w = 0)) and ε∞ (∆ε = ε '(0)–ε∞). In the inset of this figure, the values of ∆ε are plotted against the weight fraction of 5CB, W5CB. The
plotted data includes our previous results.32 Dielectric intensity, ∆ε, of the polar molecule in
a continuous media is proportional to its volume fraction (~weight fraction) if the polar
molecules are uniformly dissolved without any orientation correlation for the electric dipoles. The linear relationship between ∆ε and W5CB is observed in the range of weight fraction
(~ 0.2), meaning that the observed broad and bimodal dielectric relaxation can be attributed to
the response of only 5CB molecules. In other word, the dielectric relaxation of polymer
component is negligible in the observed dielectric response.
[Figure 3]
In order to further check the validity of the above mentioned discussion, the ∆ε value was calculated from the electric dipole moment, µ, based on the Kirkwood formula42
the extension of the Onsager theory.43 ) 0 ( / 2 ) 2 ( 9 ) 0 ( 2 B 0 2 ε ε ε ε µ ρφ ε ε ε ∞ ∞ ∞ + + = − = ∆ T k M N g A (1)
Here, T is the absolute temperature, kB is the Boltzmann constant, ε0 is the dielectric constant
(or the vacuum permittivity), NA is Avogadro’s number, and ρ is the density. M and φ are the
molecular weight and the volume fraction of the polar molecule in mixture, respectively.
The Kirkwood factor, g, represents the magnitude of the orientation correlation for the dipole
vectors of polar molecules. Here we assume g = 1, since the concentration of 5CB is small enough. From the µ value of 5CB (4.4 D, 1 D = 3.33564 × 10⁻³⁰ C m) and those of the
monomer unit for PS (0.21 D), P4MS (0.09 D) and PtBS (0.11 D), which were estimated by
WinMopac software (Fujitsu, Japan), dielectric intensities of all the components were calculated and shown in the column of ∆εtheo of Tables 1 and 2. In this calculation, the
density values of 1.05, 1.02, and 0.95 g cm–3 for PS, P4MS, and PtBS, respectively, were used
and as for the ε∞ values, those of the corresponding neat polymers (2.51, 2.53, and 2.53, respectively) were used as an approximation considering the low concentration of 5CB. A
comparison of ∆ε values between polymers and 5CB, which are tabulated in Tables 1 and 2,
1 gives the linear relation, ∆ε ∝ φ5CB (∝ W5CB), in accord with the result shown in Fig. 3 (A).
Therefore, it can be concluded that the observed dielectric responses can be attributed only to
the molecular motion of the 5CB component.
For the quantitative comparison, both ε' – ε∞ (= ∆ε') and ε" data were divided by
W5CB and shown in Fig. 3 (B). The ∆ε'/W5CB value of three samples at the limiting low
frequency agrees with each other in experimental error, indicating that the sum of the
relaxation intensities of two relaxation modes is constant. This means that the rotational
motion of 5CB takes place in two-steps; partial rotational relaxation of 5CB via wobbling
motion and/or spinning motion about the long axis at high frequency (fast mode) and full
rotational relaxation at low frequency (slow mode). In Fig. 3 (B), the maximum frequencies
for the fast and slow modes are indicated by the arrows which were determined by fitting the
relaxation curves with eq (2) being discussed later. The difference in maximum frequencies
of the slow mode for three samples are within one decade at Tg+2 K, while that of the fast
mode is larger (more than 3 decades difference) and the peak frequencies shift higher side
with increasing the side-chain size and the Kuhn length (PS < P4MS < PtBS). Furthermore,
the relative intensity of the slow mode decreases in the order of PS < P4MS < PtBS and vice
versa for the fast mode. Concerning the large difference in the fast mode relaxation times
for three polymers, it depends on temperature; the difference becomes larger with decreasing
Additionally, the bimodal dielectric spectra for the three systems became wider with
decreasing temperature, suggesting that the two modes have different temperature
dependence.
These changes in the shape of dielectric spectra with polymer structures could be
thought to be due to the difference in the molecular packing around 5CB molecules in the
mixtures. In the case of PtBS, the larger side chain and longer Kuhn length will allow 5CB
molecules to rotate with wider angle before the polymer backbone (segment) motion starts,
and thus the amplitude of the local fluctuation motion (fast mode) would be larger. On the
other hand, in the case of PS, the average distance between polymer chain back-bone will be
shorter compared with the case of PtBS and P4MS due to the smaller side group and higher
backbone flexibility, the local wiggling motion of 5CB has small amplitudes. Thus, the fast
mode strongly reflects the difference in local environment surrounding the guest 5CB
molecule which will be determined by both the chain stiffness and the side-chain bulkiness.
3.2. Dielectric relaxation intensity and time of 5CB in mixtures
Since all the obtained dielectric spectra are broad and bimodal, it is difficult to
analyze them with a single Debye function.41 For glass mode spectra of polymers, the
Havliriak-Negami (H-N)44 and Cole-Cole (C-C)45 functions are generally used. As
relaxation spectrum, it has larger number of parameters than the C-C function and thus gives
some ambiguity in determining the fitting parameters: different combinations of the parameter
sets are sometimes possible to fit the same dielectric spectra. In order to avoid this problem,
we use the sum of two Cole-Cole type functions given by eq 2 to fit the data. We think this
equation is enough to separate the dielectric spectra into two modes and to determine the
average relaxation time and the relaxation strength of each mode.
∑
= ∞ + ∆ + = slow,fast * ) i ( 1 ) ( j j j j a wt ε ε w ε (2)Here, ∆εj, tj, and aj are respectively relaxation intensity, relaxation time, and symmetric
broadening parameter for j mode. In the case of the Debye function, aj becomes unity. All
the experimental data were successfully fitted by eq 2, and the used parameters, t j and ∆ε j,
for the slow and fast modes almost coincided with those previously determined for PS/5CB.32
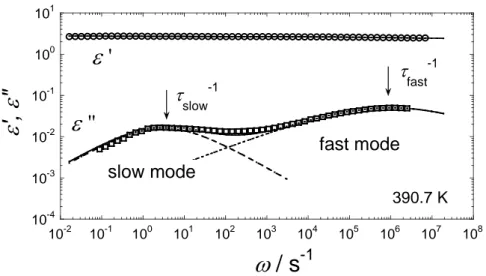
Fig. 4 displays a typical result of the fit for the PtBS/5CB mixture at 390.7 K. The arrows show the relaxation frequencies corresponding to tslow–1 and tfast–1. The a values for both
modes were smaller than unity (0.3 < a < 0.7), reflecting the broad relaxation time distribution. Fig. 5 shows aslow and afast values plotted against T–Tg. Both the values
[Figure 4]
[Figure 5]
Although broadness of the dielectric relaxation spectra changes with temperature the
relaxation times, tslow and tfast, reflect average rates of the two kinds of the 5CB motion in
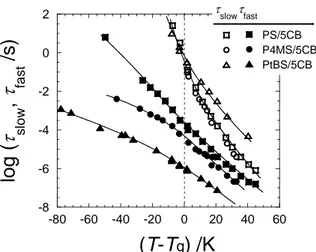
polymer matrices. In order to compare the dynamics of 5CB among three systems, PS/5CB, P4MS/5CB and PtBS/5CB, all tslow and tfast data are shown as functions of T–Tg in Fig. 6.
The tslow values increase with decreasing T and reach 1 s around T = Tg. This behavior is
common for all the mixtures. In addition, Fig. 6 shows that the temperature dependences of tslow for PS/5CB and P4MS/5CB are almost the same as functions of T–Tg while that for
PtBS/5CB is slightly different. This difference will reflect the nature of the glassy dynamics
intrinsic to the matrix polymers as will be discussed later. Concerning the fast mode, we
note that the tfast values are dependent on the polymer species and their temperature
dependence is different from that for tslow. These features will be discussed later. In the
next section, the relationship between the 5CB motion and polymer dynamics will be
examined in detail by comparing with the data of viscoelastic relaxation.
3.3. Comparison of dielectric and viscoelastic relaxation behavior
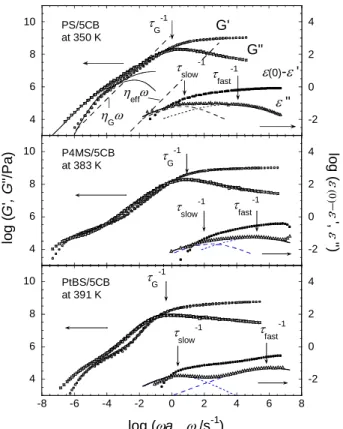
Viscoelastic spectra of the mixtures from the glassy to the flow regions are shown in
Fig. 7, along with the dielectric spectra obtained at the same reference temperature for
comparison. The storage and loss moduli, G′ and G′′, respectively, over a wide range of
frequencies were obtained by applying the method of reduced variables4 to the viscoelastic
data measured at several temperatures. Here aT is the frequency shift factor. The
viscoelastic spectra of PS/5CB and PtBS/5CB mixtures do not clearly show the rubbery
plateau region because of the lower Mw value than the molecular weight between the
entanglements, Me (1.7×10⁴ for PS, 3.7×10⁴ for PtBS).40 For those systems, the terminal
region of the G* can be well represented by the Rouse theory34 as shown with the solid curves
in Fig. 6. On the other hand, the spectrum of P4MS/5CB exhibits the rubbery plateau region
due to the entanglement effect because the Mw is higher than Me, which is estimated as
1.9×10⁴ by assuming the same number of repeating units with PS.
[Figure 7]
At high frequencies, G' reaches to 109 Pa which is the typical value for glassy
transition region. The inverse of the frequency at the loss modulus maximum can be
regarded as the segmental relaxation time, tG of polymer component, related to the glass
transition.46 Since we focus on the cooperativity between polymers and 5CB, the dielectric
and viscoelastic relaxation times between components are compared. The arrows shown in
Fig. 7 indicate the maximum frequency corresponding to the inverse of the relaxation times, tG (segmental motion of polymers), tslow, and tfast (rotational and wobbling motion of 5CB)
for each mixture. The segmental relaxation for the matrix polymer showed the broad
distribution of the relaxation time and especially the relaxation function in the high frequency
region overlapped with the fast mode relaxation of 5CB. However, we think that the fast
mode is more or less independent of the segmental motion of polymers because of the
appearance of the “clear” peak in dielectric loss spectra, which cannot be explained as the
motion of 5CB coupled with the high frequency component of the segmental motion. Fig. 7
shows that the tslow and tG look close but tslow is about 10 times shorter than tG. This
suggests that the slow mode of 5CB would reflect the smaller scale motion than the glass dynamics of polymers. In contrast, tfast locates at much shorter time region so that the fast
mode should be attributed to more localized motion in a confined space by immobilized
matrix polymers.
By using the method of reduced variables, temperature dependence of tG data over a
wide temperature range were obtained and shown in Fig. 8 along with tslow as functions of
T–Tg. The dashed lines were fitted results of the data by using the WLF function.5 Roland
et al. indicated that the glass relaxation mode and terminal relaxation mode of amorphous
polymers have different temperature dependence.46 Inoue et al.47 separated the viscoelastic
spectra of homopolymer systems into rubbery (R) (= terminal) and glassy (G) modes and
clearly showed that the R and G modes had different temperature dependence (different shift
factors, aT(R) and aT(G)). However, the difference in the two shift factors, aT(R) and aT(G),
is known to appear only in the vicinity of Tg. Although the determined aT at high
temperature (in the rubber ~ flow region) should be the R mode shift factor, the T dependence
of aT(R) and aT(G) in this region will be the same, based on the data reported by Roland et
al.46 This means that the obtained nominal shift factors for G* over all the temperature range
approximately correspond to the aT(G). Therefore, the temperature dependence of tG can be
approximately determined from the nominal shift factors.
[Figure 8]
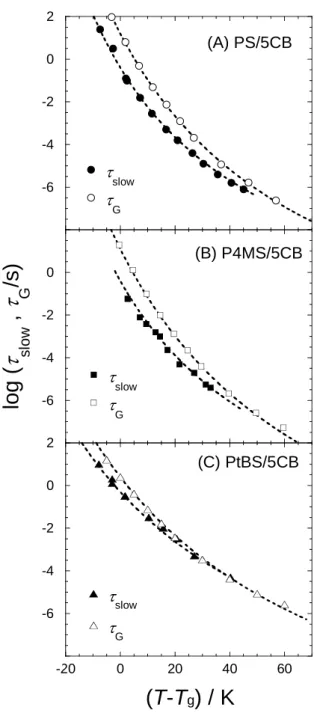
The figure shows that tG and tslow have slightly different temperature dependence
not be completely coupled with the G mode of polymers. We tentatively attribute these
features to the size difference between the 5CB molecule and the relevant length of the glass mode relaxation which might be dependent on temperature. Since tslow is about 2~100 times
shorter than tG, the average size of the motional unit responsible for the glass mode relaxation
(corresponding to the maximum of G″) will be larger than the size of 5CB, whose long axis is 1.3 nm. Moreover, tslow merges into the same line with tG at high temperature, indicating
that the dynamical scale of the polymer segment becomes close to the 5CB size with increasing temperature. From the difference between tslow and tG, the relevant length scale
for the G mode will be estimated in the next paragraph.
In several PS/LM mixtures32, the molecular-size dependence of the rotational
relaxation time for rod-like molecules was discussed previously based on the rotational
diffusion theory.48 We found that the dielectric relaxation time of several rod-like LMs,
DR rod r,
t , was proportional to the cube of the rod length, L, i.e., DR 3 rod
r, ∝L
t . It is considered that the relaxation time is governed by the two factors: friction coefficient, ζ
( )
T , and the length of a rod-like molecule.( )
3 DRrod
r, ~ζ T L
t (3)
Concerning the viscoelastic relaxation time of the glass mode, tG, the similar
expression will be possible,
( )
( ) ~G ζ ξ
Here, F(ξ) is a structure factor determined by the relevant length of the glass mode relaxation, ξ. Colby proposed the scaling relation for tG as tG ~ξz, and suggested z = 6.
49
However,
the friction factor is implicitly included in his equation, and thus it is not compatible with eq 4. Here, we assume that the functional form of F(ξ) is the same with eq 3, i.e., 3
) (ξ =ξ
F .
When the long axis of a rod-like molecule becomes comparable with the relevant length of
the glassy mode, two experimentally observed relaxation times will become the same. We
define this length of the rod-like molecule as critical length, Lc. From eqs 3 & 4, and the
assumptions described above, we can determine Lc, by the following equation. 3 / 1 slow G 5CB c 3 = t t L L (5)
Here tslow corresponds to tr,rodDR in eq 3 and because of the difference in the rank between
dielectric and viscoelastic relaxation times, numerical factor 3 is incorporated. The Lc can
be regarded as the relevant length of the glassy mode.
The Lc values in the three kinds of polymers, PS, P4MS, and PtBS are estimated as
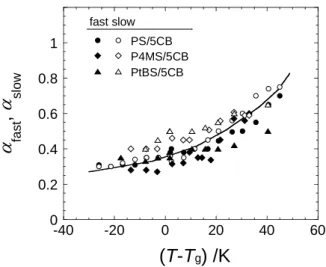
functions of temperature and shown in Fig. 9 (A). PS/5CB and P4MS/5CB mixtures have
larger Lc and their temperature dependence is stronger than the case of PtBS/5CB. This
result will be related to the difference in dynamic cooperativity and fragility of these three
polymers as reported by Erwin and Colby.50
The idea of cooperative rearranging region (CRR), which was originally introduced
glass transition. The CRR is related to a subsystem, which can rearrange its configuration
into another, independently of its environment upon a sufficient thermal fluctuation. Donth17,
51
theoretically related the volume of CRR to the change in heat capacity based on the Adam
and Gibbs theory.2 Ellison et al.12 estimated the length scales of CRR, ξCRR, at Tg from the
DSC data of PS, P4MS and PtBS to be 4.3, 4.1, and 3.2 nm, respectively, using the Donth’s
theory, and the values are shown in Fig. 9(A). In a practical comparison of the Lc and ξCRR
values, their reported ξCRR was corrected here by a factor of (6/π)1/3 because they regarded the
structure of CRR as cubic instead of sphere.
Capaccioli et al.18 estimated the number of the repeating unit NCRR from the results
of thermal and dynamic relaxation measurements.
2 2 0 dln ln d ∆ = T e M N C k N A p B CRR t β (6)
Here, ∆Cp is a specific heat capacity, M0 is the molecular weight of a repeating unit, and β is
the exponent in Kohlausch-Williams-Watts (KWW) function52, 53 φ (t), which can reproduce
asymmetric relaxation spectrum for glassy polymers and is given by, β t φ − = t t) exp ( (7)
From the tG data with using eq 6 and the relation of NCRR = (πρNA/6M0) ξCRR3, the size of
CRR, ξCRR, for the three polymers were estimated. For this calculation, ∆Cp of bulk
of 5CB. The results are also shown in Fig. 9 (B). The length scale, ξCRR estimated with the
method by Capaccioli et al. are similar to that by Ellison et al, suggesting that the CRR size in
the blend is almost the same with that in the bulk.
It can be seen that absolute values of Lc and ξCRR are different even though the trend
of the sample dependence is the same: Lc is up to about twice larger than ξCRR. The
estimation method of the ξCRR is based on the thermodynamic approach for the glass
transition, which conflicts the kinetic nature of glass transition. In contrast, the Lc was
estimated purely from dynamic data. Therefore, there will be a possibility that the ξCRR and
the Lc have essential difference.
Interestingly, the order of the Lc values at Tg (6.1±0.5, 6.6±0.5 and 3.1±0.3 nm in
PS, P4MS and PtBS mixtures) is not the same with that of the Kuhn segment length, lK, (1.79,
2.17, and 2.30 nm for PS, P4MS, and PtBS). The Kuhn length representing the polymer
chain flexibility is determined by the potential barrier of the internal rotation along the C-C
bond. Therefore, the difference in the length scales indicates that the critical length, Lc, of
the guest molecule is associated with not only the intra-molecular interaction but also the
inter-molecular cooperativity. Based on this idea, when polymers have long Lc and short lK,
e.g., in the case of PS and P4MS, the contribution of the inter-molecular cooperativity will be
higher. In contrast, when polymers have short Lc and long lK, the intra-molecular
The critical length, Lc, becomes close to lK with increasing temperature, meaning
that the inter-molecular interaction becomes weaker with increasing temperature.
Particularly, for PtBS at 40 oC higher than Tg, Lc is almost the same with lK and thus the
inter-molecular cooperativity will be negligible, and only the intra-molecular interaction will
dominate the segmental dynamics. In contrast, Lc’s even at the highest temperatures (T ~
Tg + 40 K) for PS and P4MS are longer than lK, indicating that the inter-molecular interaction
still affects the segmental dynamics at Tg + 40 K. Fig. 9 shows that PS and P4MS systems
exhibit stronger T-dependence than PtBS. Erwin and Colby50 compared temperature
dependences of the CRR size for some glass-forming liquids determined by 4D-NMR
experiment and concluded that the temperature dependence of CRR size is stronger for
materials with higher fragility index. Since PS and P4MS, whose Lc’s have stronger
temperature dependence, can be regarded to be more fragile than PtBS, it is concluded that a
larger side chain decreases the fragility index.
3.5. Fast mode of 5CB and glass transition
As mentioned in the introduction, the fast mode of 5CB in mixtures was assigned to
the orientational fluctuation of 5CB including the precession motion around the long axis, in
the confined space (cage) surrounded by polymer chain backbones.32 It is considered that
cage structure will be determined by the molecular packing around a 5CB molecule including
both the backbone and the side-chains of polymers. As already mentioned in the previous
section, the larger side-chain and longer Kuhn length of polymers would cause the less
confinement to the fluctuation motion of a 5CB molecule
In order to discuss the detail of the fast mode relaxation, temperature dependence of the dielectric intensity, ∆εfast, and relaxation time, tfast, are analyzed in this section. Fig. 10
shows the plot of ∆εfast normalized by W5CB vs. T/Tg. The trend of increasing ∆εfast with
temperature is observed. The dielectric intensity reflects the amplitude of the fluctuation motion of a 5CB molecule, and thus the increase of ∆εfast means that the confinement effect
on the fluctuation motion weakens at higher temperature. This is understandable because the
size of a cage which allows the fluctuation motion of a guest molecule will increase with
temperature.9, 54
[Figure 10]
Since the total dielectric intensity per one 5CB molecule is approximately constant in all three different mixtures, ∆εfast/W5CB reflects the contribution of the restricted partial
rotation to the full rotation of 5CB. As seen in Fig. 10, the values of ∆εfast/W5CB increases in
bulkiness. Urakawa et al. reported that the fast mode intensity increased with decreasing the
LM size in the same PS matrix.13, 22 By taking into account all these results, it is concluded
that the size ratios of the LM to the Kuhn segments and / or the side chain bulkiness of
polymers determine the strength of the fast mode. We think both factors contribute to
increase the cage size which will enhance the orientational fluctuation motion of LMs, resulting in the increase of ∆εfast.
Fig.11 shows the plots of tfast against Tg/T. The timescale of fast mode appears to
become shorter in the order of PS → P4MS → PtBS. Because it was found in the previous
report32 that tfast is independent of probe concentration in the plot against Tg/T, the difference
in the timescale indicates that the restriction of 5CB by the matrix polymer will be weakened
with increasing the side chain bulkiness. Additionally, the Tg/T dependence of tfast seems to
consist of the two Arrhenius forms: Two linear lines with different slopes can be drawn in this
plot. The temperatures, at which the slopes change, almost coincide with Tg for all the
mixtures, indicating that the fast mode will be also affected by the glass transition. This
behavior apparently resembles to the temperature dependence of specific volume or density for amorphous polymers, and is also reported for the β relaxation of a probe molecules in the PS/probe systems by van den Berg et al.29 and for the secondary relaxation in amorphous
poly(methyl methacrylate) by Bergman et al.55. Here, it is assumed that the T dependence of tfast can be expressed by the reciprocal sum of the two Arrhenius equations,
1 l a, l h a, h fast
)
/
exp(
1
)
/
exp(
1
− ∞ ∞
−
+
−
=
RT
E
RT
E
t
t
t
(8)where Ea and t ∞ are the apparent activation energy and the limiting relaxation time at high
temperatures, respectively. The subscripts, “h” and “l”, represent high and low temperature
components. The solid lines shown in the figure represent the fitted result with eq 8. From
these fitting, two activation energies, Ea,h and Ea,l, were estimated and tabulated in Table 2.
Ea,h was similar among all the mixtures while Ea,l decreased in the order of PS, P4MS and
PtBS. The confinement effect to the orientational fluctuation of 5CB becomes stronger with
decreasing temperature resulting in the increase of the relaxation time. However, the time
necessary for the structural equilibration (toward the equilibrium molecular packing) becomes
very long below Tg, and thus the deviation from the high-T Arrhenius equation will be due to
the non-equilibrium structure. In this sense, the difference in the apparent activation
energies below Tg will be related to the difference in the degree of equilibration among three
systems.
In this paper, the dynamics of 4-pentyl-4’-cyanobiphenyl (5CB) dissolved in three
polymers, polystyrene (PS), poly(4-methyl styrene) (P4MS), and poly(4-tert-butyl styrene)
(PtBS) was examined through dielectric relaxation (DR) measurements. Viscoelastic
relaxation (VR) measurements were also conducted on the same samples to examine the
segmental motion of polymer component.
The DR spectra of PS/5CB, P4MS/5CB, and PtBS/5CB mixtures reflecting the
molecular motion of 5CB showed two relaxation processes (fast and slow modes). The slow
mode was ascribed to the rotational motion of 5CB cooperative with the segmental motion of
the polymers and the fast mode to the fluctuation motion of 5CB molecule in the confined
space surrounded by less mobile polymer chains, respectively. The relative intensity of the
fast mode increased with increasing the side chain bulkiness and/or the chain rigidity
(represented by the Kuhn segment length). It was concluded that these two factors
contribute to the increase of the relative amplitude of the fast mode relaxation.
The relaxation times of glass mode, tG, of three polymers were determined from the
maximum frequency of the loss modulus spectra. Temperature dependence of tG was
slightly different form that of tslow. From this difference in two relaxation times, we
estimated the critical length of the rod-like molecule, Lc, with which the dielectric relaxation
time of a rod-like molecule becomes equal to the viscoelastic relaxation time of the glass
region) sizes reported so far, but no clear correlation was found between Lc and the Kuhn
length. This result suggested that the length scale relevant to glassy dynamics was governed
not only by the intra-molecular segmental motion but also by the inter-molecular cooperative
motion.
The fast mode relaxation time, tfast, in the three mixtures decreased in the order of
PS , P4MS, PtBS, corresponding to the order of the side-chain bulkiness and main chain
stiffness, compared at a constant T–Tg. In contrast, the dielectric intensities of the fast mode
increased in this order. From these results, it was concluded that confinement effect on the
fluctuation motion of a 5CB molecule became weaker in the order of PS, P4MS, and PtBS.
Acknowledgement
This work was partly supported by the Osaka University Global COE program,
“Global Education and Research Center for Bio-Environmental Chemistry” from the Ministry
of Education, Culture, Sports, Science, and Technology, Japan, by Grant-in-Aid for Scientific
Research B and Research Activity Start-up from the Japan Society for the Promotion of
Science (Grant Nos. 1806809, 20340112, 21350126 and 23850008), and by the Sasakawa
Tables
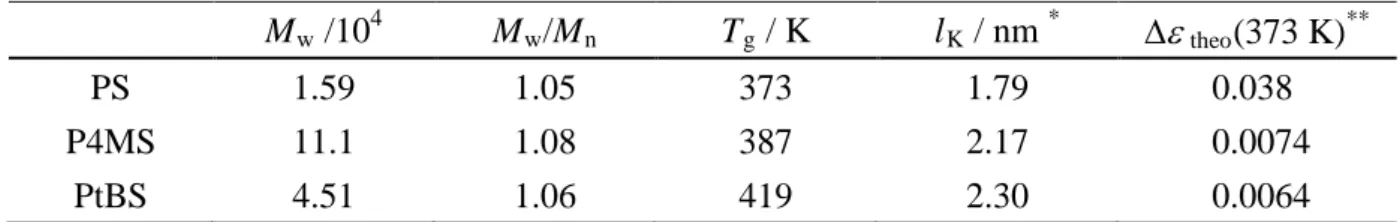
Table 1. Weight-average molecular weight, Mw, molecular weight distribution, Mw/Mn,
glass transition temperature, Tg, the Kuhn segment length, lK, and dielectric relaxation
intensity, ∆ε, for PS, P4MS, and PtBS.
Mw /104 Mw/Mn Tg / K lK / nm * ∆ε theo(373 K)**
PS 1.59 1.05 373 1.79 0.038
P4MS 11.1 1.08 387 2.17 0.0074
PtBS 4.51 1.06 419 2.30 0.0064
* determined from literature data37, 38 for characteristic ratio C∞ or mean-square-radius <S2>
** estimated by Onsager equation with dipole moment values calculated by WinMopac software (Fujitsu, Japan)
Table 2. Weight fraction of 5CB and Tg for various polymer/5CB mixtures. Dielectric
intensities, ∆εslow, ∆εfast, and ∆εtotal (= ∆εslow + ∆εfast), which were obtained at Tg+20 K by
fitting the data with eq 2, are shown. Apparent activation energies for the fast mode of 5CB, Ea,h and Ea,l, are also shown.
mixture W5CB Tg / K ∆εtheo (∆εtheo,5CB) ∆ε slow ∆ε fast ∆εtotal Ea,l / kJ mol
–1 Ea,h / kJ mol –1 PS 0.077 348 0.85 (0.81) 0.36 0.51 0.87 155±10 205±10 P4MS 0.044 373 0.42 (0.42) 0.09 0.34 0.44 85±10 210±20 PtBS 0.048 389 0.46 (0.46) 0.05 0.45 0.50 80±10 185±20
Table 3. Tg, lK, and the CRR size, ξCRR, for PtBS, P4MS, and PS taken from literature data12, 38
. The critical length, Lc, of LM in the mixtures was estimated from eq 6.
Tga/ K lK a /nm ξCRR b /nm Lc /nm
PtBS 419 2.30 3.2 3.1
P4MS 387 2.17 4.1 6.6
PS 373 1.79 4.3 6.1
a) already shown in Table 1
Figures
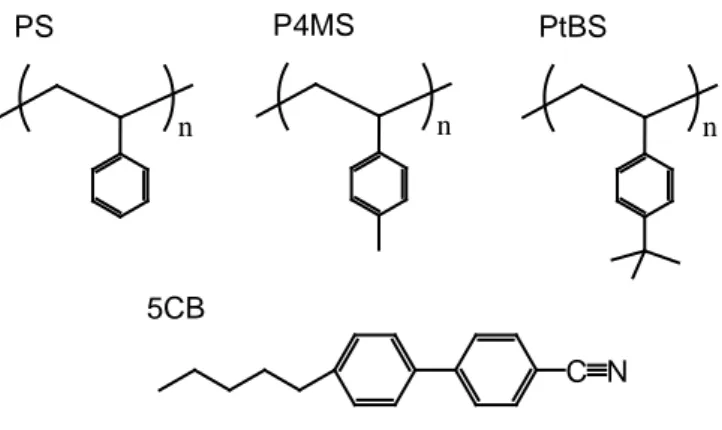
n PS C N 5CB n P4MS n PtBSFigure 1. Chemical structures of polystyrene (PS), poly(4-methyl styrene) (P4MS), poly(4-tert-butyl styrene) (PtBS), and 4-pentyl-4’-cyanobiphenyl (5CB).
0 0.01 0.02 0.03 0.04 0.05 0.06 0.07 -160 -120 -80 -40 0 40 PS/5CB P4MS/5CB PtBS/5CB
ε
"
(T-T
g)/K
f = 1 kHzFigure 2. Temperature dependence of dielectric loss, ε ″, for PS/5CB, P4MS/5CB and PtBS/5CB blends at 1 kHz. The temperature axis is normalized by each glass transition temperature, Tg.
Figure 3. (A) Angular frequency, w, dependences of dielectric permittivity and loss, ε ' and ε'', for PS/5CB, P4MS/5CB and PtBS/5CB mixtures at Tg + 2 K. The vertical axis on the
left side indicates the difference between the ε' and the limiting permittivity at high frequency, ε∞. The dashed line represents a single Debye function. The inset shows the relationship
between ∆ε and W5CB from the experimental data (closed circle) including our previous
results (opened triangle) already reported.32 (B) Frequency dependence of dielectric relaxation data divided by each weight fraction of 5CB, W5CB, for mixtures. The arrows
indicate the maximum frequencies for slow and fast relaxations which were determined by fitting with the Cole-Cole functions in eq 2.
-1.5 -1 -0.5 0 0.5 1 1.5 0 0.1 0.2 0.3 0.4 10-2 100 102 104 106 108 PS/5CB P4MS/5CB PtBS/5CB E E E C ε ' -ε ∞ ε " w / s-1 Tg +2 K (A) -20 -10 0 10 20 0 1 2 3 4 5 6 10-2 100 102 104 106 108 w / s-1 Tg +2 K ( ε ' -ε ∞ ) / W 5 CB ε " / W 5 CB (B) 0 1.5 3.0 4.5 0 0.1 0.2 0.3 ∆ ε W 5CB
10-4 10-3 10-2 10-1 100 101 10-2 10-1 100 101 102 103 104 105 106 107 108 slow mode fast mode
ε
',
ε
"
w
/ s
-1ε
'
ε
"
t slow -1 t fast -1 390.7 KFigure 4. A typical dielectric spectrum of PtBS/5CB mixture at 390.7 K. The solid and dotted lines represent the best fit results by using eq 2.
0 0.2 0.4 0.6 0.8 1 1.2 -40 -20 0 20 40 60 PS/5CB P4MS/5CB PtBS/5CB a fast , a slo w (T-Tg) /K fast slow
Figure 5. Temperature dependence of afast and aslow for various mixtures. The temperature
-8 -6 -4 -2 0 2 -80 -60 -40 -20 0 20 40 60 PtBS/5CB P4MS/5CB PS/5CB log (
t
slo w ,t
fast / s ) (T-Tg) /K t slowtfastFigure 6. Temperature dependence of slow and fast relaxation times for 5CB, tslow and tfast
in PS/5CB, P4MS/5CB and PtBS/5CB mixtures. The horizontal axis is normalized by each Tg.
4 6 8 10 -2 0 2 4 log (G ', G "/ P a) G" ε(0)-ε ' ε " G' t G -1 PS/5CB at 350 K log ( ε (0 ) − ε ' , ε ") t fast -1 η Gw η effw t slow -1 4 6 8 10 -2 0 2 4 P4MS/5CB at 383 K tG -1 t fast -1 t slow -1 4 6 8 10 -2 0 2 4 -8 -6 -4 -2 0 2 4 6 8 PtBS/5CB at 391 K t G -1 t fast -1 t slow -1 log (wa T, w /s -1 )
Figure 7. Comparison of composite curves for dielectric and viscoelastic spectra for PS/5CB, P4MS/5CB, and PtBS/5CB mixtures at the same reference temperature. Arrows indicate the maximum frequencies of the dielectric and viscoelastic losses for each data. The solid lines overlaid on the G* curves represent the Rouse modes. The solid and dotted lines overlaid on ε″ curves are the fitted results with eq 2.
Figure 8. Temperature dependence of the relaxation times for viscoelastic G mode of polymers and dielectric slow mode of 5CB, tG and tslow, respectively. (A) PS/5CB, (B)
P4MS/5CB, (C) PtBS/5CB mixtures. The dotted lines are the best fit-results by using the WLF function5, t = tref exp[–c1(T–Tref)/(c2 + T–Tref)] with proper numbers of parameters for
each mixture. -8 -6 -4 -2 0 2 t slow t G
log
(
t
slo w,
t
G/s
)
(B) P4MS/5CB -8 -6 -4 -2 0 2 t slow t G -20 0 20 40 60 (C) PtBS/5CB(T-T
g) / K
-8 -6 -4 -2 0 2 t slow t G (A) PS/5CB1 2 3 4 5 6 7 -20 0 20 40 60 PS P4MS PtBS L c o r
ξ
CR R / nm (T - T g) / K ξ CRR(ref) Lc (A) 1 2 3 4 5 6 7 -20 0 20 40 60 PS P4MS PtBSξ
CR R / nm (T - T g) / K ξ CRR(ref) ξCRR (B)Figure 9. (A) Temperature dependence of the critical length, Lc, estimated by using eq 5.
The size of CRR, ξCRR (ref), determined by Ellison et al.12 is also shown. (B) Temperature
dependence of ξCRR determined from the viscoelastic data by following Capaccioli et al.18
0 5 10 15 20 0.8 0.9 1.0 1.1 1.2 1.3 1.4 PS/5CB P4MS/5CB PtBS/5CB
∆
ε
fas t/
W
5 CB Tg / TFigure 10. Tg/T dependence of the dielectric fast mode intensity normalized by the 5CB
-8 -6 -4 -2 0 2 0.8 0.9 1.0 1.1 1.2 1.3 1.4 PtBS/5CB P4MS/5CB PS/5CB
log
(
t
fast/
s
)
T
g/ T
Figure 11. Plots of the fast mode relaxation time, tfast, against Tg/T for PS/5CB, P4MS/5CB
and PtBS/5CB mixtures. The solid lines represent the best fit results with the double Arrhenius function given by eq 7.
References
1. Fox, T. G.; Flory, P. J. J. Poly. Sci., 1954, 14, 315-319. 2. Adam, G.; Gibbs, J. H. J. Chem. Phys., 1965, 43, 139-146.
3. Cangialosi, D.; Alegria, A.; Colmenero, J. Phys. Rev. E, 2007, 76.
4. Ferry, J. D., Viscoelastic Properties of Polymers. 3rd ed.; Wiley: New York, 1980. 5. Williams, M. L.; Landel, R. F.; Ferry, J. D. J. Am. Chem. Soc., 1955, 77, 3701-3707. 6. Angell, C. A. J. Non-Cryst. Solids, 1991, 131, 13-31.
7. Inoue, T.; Cicerone, M. T.; Ediger, M. D. Macromolecules, 1995, 28, 3425-3433. 8. Roland, C. M.; Ngai, K. L. J. Non-Cryst. Solids, 1994, 172, 868-875.
9. Kanaya, T.; Tsukushi, T.; Kaji, K.; Bartos, J.; Kristiak, J. Phys. Rev. E, 1999, 60, 1906-1912.
10. Hirose, Y.; Urakawa, O.; Adachi, K. Macromolecules, 2003, 36, 3699-3708.
11. Hirose, Y.; Urakawa, O.; Adachi, K. J. Polym. Sci. Pt. B-Polym. Phys., 2004, 42, 4084-4094.
12. Ellison, C. J.; Mundra, M. K.; Torkelson, J. M. Macromolecules, 2005, 38, 1767-1778.
13. Urakawa, O.; Ohta, E.; Hori, H.; Adachi, K. J. Polym. Sci. Pt. B-Polym. Phys., 2006, 44, 967-974.
14. Colmenero, J.; Arbe, A. Soft Matter, 2007, 3, 1474-1485.
15. Zheng, W.; Simon, S. L. J. Polym. Sci. Pt. B-Polym. Phys., 2008, 46, 418-430.
16. Olson, B. G.; Srithawatpong, R.; Peng, Z. L.; McGervey, J. D.; Ishida, H.; Maier, T. M.; Halasa, A. F. J. Phys.-Condes. Matter, 1998, 10, 10451-10459.
17. Donth, E. J. Non-Cryst. Solids, 1982, 53, 325-330.
18. Capaccioli, S.; Ruocco, G.; Zamponi, F. J. Phys. Chem. B, 2008, 112, 10652-10658. 19. Fragiadakis, D.; Casalini, R.; Bogoslovov, R. B.; Robertson, C. G.; Roland, C. M. Macromolecules, 2011, 44, 1149-1155.
20. Runt, J. P.; Fitzgerald, J. J., Dielectric Spectroscopy of Polymeric Materials. American Chemical Society: Washington, DC, 1997.
21. Yoshizaki, K.; Urakawa, O.; Adachi, K. Macromolecules, 2003, 36, 2349-2354. 22. Urakawa, O.; Nobukawa, S.; Shikata, T.; Inoue, T. Nihon Reoroji Gakkaishi, 2010, 38, 41-46.
23. Watanabe, H.; Urakawa, O. Korea-Australia Rheo. J., 2009, 21, 235-244. 24. Colby, R. H. Polymer, 1989, 30, 1275-1278.
25. Miller, J. B.; McGrath, K. J.; Roland, C. M.; Trask, C. A.; Garroway, A. N. Macromolecules, 1990, 23, 4543-4547.
26. Adachi, K.; Fujihara, I.; Ishida, Y. J. Polym. Sci. Pt. B-Polym. Phys., 1975, 13, 2155-2171.
101, 139-146.
29. van den Berg, O.; Wubbenhorst, M.; Picken, S. J.; Jager, W. F. J. Non-Cryst. Solids,
2005, 351, 2694-2702.
30. Inoue, T. Macromolecules, 2006, 39, 4615-4618.
31. Matsumiya, Y.; Uno, A.; Watanabe, H.; Inoue, T.; Urakawa, O. Macromolecules,
2011, 44, 4355-4365.
32. Nobukawa, S.; Urakawa, O.; Shikata, T.; Inoue, T. Macromolecules, 2011, 44, 8324-8332.
33. McLeish, T. C. B. Ad. Phys., 2002, 51, 1379-1527. 34. Rouse, P. E. J. Chem. Phys., 1953, 21, 1272-1280.
35. Erwin, B. M.; Masser, K. A.; Colby, R. H. J. Non-Cryst. Solids, 2006, 352, 4776-4784.
36. Ding, Y.; Sokolov, A. P. J. Polym. Sci. Pt. B-Polym. Phys., 2004, 42, 3505-3511. 37. Maconnachie, A.; Fried, J. R.; Tomlins, P. E. Macromolecules, 1989, 22, 4606-4615. 38. Fetters, L. J.; Lohse, D. J.; Milner, S. T.; Graessley, W. W. Macromolecules, 1999, 32, 6847-6851.
39. Inoue, T.; Matsui, H.; Osaki, K. Rheo. Acta, 1997, 36, 239-244.
40. Fetters, L. J.; Lohse, D. J.; Richter, D.; Witten, T. A.; Zirkel, A. Macromolecules,
1994, 27, 4639-4647.
41. Debye, P.; Ramm, W. Ann. Phys.-Berlin, 1937, 28, 0028-0034. 42. Kirkwood, L. G. J. Chem. Phys., 1939, 7, 911.
43. Onsager, L. J. Am. Chem. Sci., 1936, 58, 1486-1493. 44. Havriliak.S; Negami, S. Polymer, 1967, 8, 161-210. 45. Cole, K. S.; Cole, R. H. J. Chem. Phys., 1941, 9, 341-351.
46. Roland, C. M.; Ngai, K. L.; Plazek, D. J. Macromolecules, 2004, 37, 7051-7055. 47. Inoue, T.; Onogi, T.; Yao, M. L.; Osaki, K. J. Polym. Sci. Pt. B-Polym. Phys., 1999, 37, 389-397.
48. Doi, M.; Edwards, S. F., The Theory of Polymer Dynamics. Oxford University Press: New York, 1986.
49. Colby, R. H. Phys. Rev. E, 2000, 61, 1783-1792.
50. Erwin, B. M.; Colby, R. H. J. Non-Cryst. Solids, 2002, 307, 225-231. 51. Donth, E. Acta Poly., 1984, 35, 120-123.
52. Williams, G.; Watts, D. C. Trans. Faraday Soc., 1970, 66, 80-85.
53. Koizumi, N.; Kita, Y. Bull. Inst. Chem. Res., Kyoto University, 1978, 56, 300-339. 54. Li, H. L.; Ujihira, Y.; Nanasawa, A. J. Radioanal. Nucl. Chem.-Artic., 1996, 210, 533-541.
55. Bergman, R.; Alvarez, F.; Alegria, A.; Colmenero, J. J. Chem. Phys., 1998, 109, 7546-7555.
Table of Contents