Study on Degradation of Cathode Catalyst Layers During Load
Cycling for Fuel Cell Vehicles
A Doctoral Thesis Presented to
Engineering for Functional Material Systems
Interdisciplinary Graduate School of Medicine and Engineering University of Yamanashi
March 2019 Chikara Takei
Contents
Chapter 1
General introduction
1-1 Hydrogen 1
1-2 Policy of each country 5
1-3 How polymer electrolyte fuel cells work 5
1-3-1 General issues for fuel cell vehicles 5
1-3-2 Degradation of cathode catalyst layer under load cycling 6
1-4 Research objective 8
1-5 References 9
Chapter 2 Load cycle durability of a graphitized carbon black-supported platinum catalyst in polymer electrolyte fuel cell cathodes 2-1 Introduction 12
2-2 Experimental 14
2-2-1 Preparation of membrane-electrode assembly (MEA) 14
2-2-2 MEA characterization 15
2-2-3 Durability evaluations in load cycles 16
2-2-4 Pt oxidation characteristic during simulated load cycles by use of an actual potentiostat 18
2-3-1 Effect of OCV/load holding time 18
2-3-2 Effects of both the current density range and RH on the degradation of cathode electrocatalyst 23
2-3-3 Effects of both the lower potential limit and RH on the PtO reduction charge during simulated load cycles 27
2-3-4 Mechanisms and suppress conditions for the degradation of the cathode performance in the load cycles using current density 28
2-4 Conclusions 32
2-5 References 33
Chapter 3 Platinum anti-dissolution mechanism of Pt/Nb-SnO2 cathode catalyst layer during load cycling in the presence of oxygen for polymer electrolyte fuel cells 3-1 Introduction 36
3-2 Experimental 39
3-2-1 Synthesis and characterization of platinum catalyst supported on niobium-doped tin oxide 39
3-2-2 Preparation of MEAs and single cells 39
3-2-3 Cell performance and load cycling evaluations 41
3-2-4 Evaluations for the Pt anti-dissolution mechanism using Pt/Nb-SnO2 CL 44
3-3 Results and discussion 44
3-3-1 Durability evaluation of the Pt/Nb-SnO2 CLs and Pt/GCB CLs
as a function of the cathode O2 concentration under
galvanostatic/potentiostatic operation 44
3-3-2 Pt anti-dissolution mechanism using Pt/Nb-SnO2 CLs 56
3-4 Conclusions 64
3-5 Supporting information 66
3-5-1 Cross-sections of MEAs using Pt/Nb-SnO2 CLs and Pt/GCB CLs after the durability evaluations 66
3-6 References 68 Chapter 4 General Conclusions 4-1 Conclusions 72 4-2 Future work 75 4-3 References 76 List of publications 77 Meeting abstracts 78 Patents 79 Acknowledgments 80
- 1 -
Chapter 1
General introduction
1-1 Hydrogen“Is hydrogen really necessary for our life in the future?” The answer is “Yes”. Global warming is one of the most serious crisis environmental issues in the world. According to the report by the United Nations, the global population will increase to over 9.7 billion by 2050 in Fig. 1-1 [1], and the amounts of CO2 emissions will increase year by
year, especially in developing countries such as India and Indonesia [2]. (Fig. 1-2)
Figure 1-2. Three speeds of CO2 emissions growth in the New Policies Scenario [2].
- 2 -
Developed countries agreed with the Paris Agreement in 2015. They have been taking on the challenge of reducing the CO2 emissions, as seen in Table 1-1 [3]. The utilization
of renewable energy is essential to achieve the targets. An important issue of renewable energy sources such as solar and wind is how to store the excess electricity. Hydrogen can effectively work in methods to store the excess of electricity over the MW-class in the long term [4]. (Fig. 1-3)
Year Japan USA Canada Germany France
2030 -26% -26-28% -30% -40% -40%
2050 -80% -80% -80% -80-95% -75%
Hydrogen can be produced from diverse energy resources, using a variety of process technologies. The energy resource options include fossil, nuclear, and renewables [5]. Hydrogen is a versatile, clean, and safe energy carrier that can be used as a fuel for power or in industry as a feedstock [4]. Hydrogen is produced from reformed natural gas using fossil fuels now and will be produced from the electrolysis of water in the
Figure 1-3. Hydrogen is most promising for long-term carbon-free seasonal storage [4]. Table 1-1. CO2 reduction targets in developed countries [3].
- 3 -
future. Distributed steam methane reforming technologies (e.g., CH4 + H2O → CO +
3H2) exist today for hydrogen to be cost-competitive with gasoline. Projections based
on high-volume production indicate that reforming natural gas at the fueling station can produce hydrogen at a cost close to $2/gge (gasoline gallon equivalent) [5]. However, methane reforming requires a lot of energy due to an endothermic reaction, and then the reaction also emits CO2 as a by-product. This method of hydrogen production is not an
optimal solution in the future. Hydrogen should be mainly produced by the use of renewable energy, as follows:
There are three main pathways to produce zero-emission hydrogen: through steam methane reforming, using bio-methane, or combined with carbon capture and storage or utilization through electrolysis using electricity generated by renewables and through gasification of biomass [4]. In the future, the electricity generated by the renewable energy drastically fluctuates, depending on the output power of solar and wind generation. Fig. 1-4 shows a simulation for Germany in 2050 in which excess power can be used to produce hydrogen for seasonal energy storage [4]. The period of oversupply in summer yields 110 TWh, and the oversupply is transformed to hydrogen. The hydrogen is then supplied for seasonal storage in winter.
In the case of the battery storage, it is difficult to store the huge amount of electricity, because the volume density of lithium ion batteries, several hundred Wh/L-class, is lower than hydrogen, which is several thousand Wh/L-class [6]. Therefore, hydrogen is suitable for storing the huge amount of electricity.
- 4 -
Figure 1-4. Excess power can be used to produce hydrogen for seasonal energy storage (simulation for Germany 2050, in GW) [4].
- 5 -
1-2 Policy of each country
Various countries announced their policies to end sales of internal combustion engines (ICEs) in the future (Table 1-2) due to the threat to public health from rising levels of NOx emissions [7]. For these policies, all automotive companies must develop fully electric or hybrid cars. For example, Volvo announced a plan to not to develop new vehicles with only ICEs, including gasoline and diesel engines, from 2019 [8].
Country Policy Vehicle
France End sales of ICEs (petrol and diesel) from 2040 No mention UK End sales of ICEs (petrol and diesel) from 2040 No mention Netherlands New vehicles with zero-emission by 2030 ZEV
Norway New vehicles with zero-emission by 2050 EV, PHEV, FCV India End sales of ICEs (petrol and diesel) from 2030 Technology neutral
USA Launch ZEV from April, 2018 EV, PHEV, FCV
China Launch NEV from April, 2018 EV, PHEV, FCV
1-3 How polymer electrolyte fuel cells work 1-3-1 General issues for fuel cell vehicles
Polymer electrolyte fuel cells (PEFCs) are one of the on-board components with high power density and high efficiency. PEFCs are examples of a very promising alternative technology to internal combustion engines in the future. The power generation principle of PEFCs is as follows [9]:
Anode: H2 → H+ + e- E˚ = 0 V vs. SHE
Cathode: 1/2O2 + 2H+ + 2e- → H2O E˚ = 1.23 V vs. SHE
Total: H2 + 1/2O2 → H2O E˚ = 1.23 V vs. SHE Table 1-2. Policies for electric vehicle-shift.
- 6 -
Theoretical power generation efficiency (∆G°/∆H°) is 83% at 25°C. This efficiency is higher than that of the internal combustion engine. To use on-board PEFCs is one of the most optimal approaches to design vehicles with high efficiency.
Fig. 1-5 shows the components of fuel cell (FC) stack cost [10]. Catalyst cost is the highest of all components. Various drive patterns, including idling, start-up/shut-down, and load cycling, affect the degradation of the cathode catalyst and membrane. For that reason, the cathode catalyst requires higher catalyst loading. Therefore, it is important to reduce the catalyst loading for lower cost of the FC stack. In particular, it is the most difficult of all drive patterns to design the FCV systems for suppressing Pt degradation, because load cycling depends on acceleration.
1-3-2 Degradation of cathode catalyst layer under load cycling
The degradation of the Pt catalyst is caused by increasing size of Pt nanoparticles (NPs) due to Pt dissolution/redeposition with Ostwald ripening [11], and the dissolution of Pt NPs due to the growth of oxides of Pt [12-14]. As a result, the cell performance decreases due to the decrease of electrochemically active surface area (ECSA) and mass
- 7 -
activity (MA). In particular, the degradation of the Pt catalyst supported on carbon heavily depends on different voltage cycle profiles [15-17], relative humidity [18], and operating temperature [19] under load cycling. The degradation of Pt accelerates under cycled voltage conditions, with increasing the upper voltage or decreasing the lower voltage [20]. Uchimura et al. measured the changes of ECSA and MA during potential cycling for varying the lower potential while keeping the upper potential constant at 0.95 V and varying the upper potential while keeping the lower potential at 0.60 V. The losses in ECSA and mass activity were the highest (~70%) during the potential cycling in the potential range between 0.60 V and 0.95 V, whereas the losses were suppressed to ~20% in the potential range of 0.60-0.80 V and 0.80–0.95 V [20].
The degradation of the Pt catalyst exhibits a good relationship with the reduction and oxidation of Pt during load cycling. The oxidation of the Pt catalyst accelerates with increasing potential, and the surface of the Pt catalyst is covered with a monolayer of oxide in the 1.15-1.20 V range due to the place exchange mechanism that takes place at the interface between the oxide and Pt metal surface [21]. At high potentials of 1.30-1.50 V, the surface is passivated with PtO and continues to dissolve at a lower rate, corresponding to PtO + 2H+ → Pt2+ + H
2O [22]. The losses of ECSA accelerate with
increasing oxide growth of the Pt catalyst. Yasuda et al. reported that Pt ions were generated by the dissolution of Pt catalyst during potential cycling, the Pt ions moved to the membrane, and the redeposition of Pt occurred by reduction due to hydrogen in the membrane [23]. These results indicate that high potentials, over 1 V, are necessary to be avoided in order to enhance the load cycle durability.
Most of the load cycle durability studies have been conducted with potential cycling in H2/N2 atmosphere using a potentiostatic mode in order to simplify the durability
- 8 -
evaluation or to make clear the electric potential effect on the degradation of the catalyst. However, on-board fuel cells are operated by a current load from the motor in H2/air
atmosphere, and water is generated. Therefore, the actual load cycle durability should be estimated under condtions including the influence of a current load with generated water and oxygen to design a system with high durability for fuel cell vehicles.
1-4 Research objective
In the present research, I investigated the degradation of the electrocatalyst in terms of Pt dissolution, Pt deposition, and Pt particle growth in both the catalyst layer (CL) and membrane under various load cycle conditions, as a function of the following: the open circuit voltage (OCV)/load holding time, current density range, relative humidity (RH), and support material, i.e., graphitized carbon black (GCB) and tin oxide (SnO2).
In Chapter 2, I investigated the load cycle durability and evaluated it as a function of OCV/load holding time, load rate and RH with a graphitized carbon black-supported platinum catalyst (Pt/GCB) in the cathode. The degradation of Pt NPs is not only caused by the potential profiles, but also by the current load and oxygen. Kongkanand et al. reported that steady-state X-ray absorption spectroscopy (XAS) measurements conducted on dispersed Pt nanoparticles suggested that, only when under O2-sparging,
place exchange between adsorbed oxide(s) and the Pt surface layer(s) was initiated at potentials as low as 0.75 V [24]. These results by Kongkanand indicated that the oxygen affected both the oxygen reduction and the dissolution of Pt NPs in the actual drive mode. In addition, a distribution of current density occurs, because the generated water occurs during the load cycling with a current load. The degradation of Pt NPs during the load cycling using a galvanostatic mode would be different from that during the
- 9 -
potential cycling using a potentiostatic mode.
In Chapter 3, the durability of cathode catalyst layers (CLs) using Pt/Nb-SnO2
(niobium-doped tin oxide) is compared with that of Pt/GCB as a function of the cathode oxygen concentration during galvanostatic/potentiostatic operation under H2/N2, H2/air,
and H2/O2 conditions. In our previous study, the durability Pt/Nb-SnO2 CLs was
investigated during potential cycling using a potentiostat [25-27]. In these results, the durability of Pt/Nb-SnO2 CLs was higher than that of Pt/GCB CLs during
start-up/shut-down cycling and load cycling using the potentiostatic mode. In this Chapter, I researched the degradation of Pt/Nb-SnO2 CLs during load cycling that
simulated the actual drive mode using a current load.
I summarized the results of Chapters 2 and 3 in Chapter 4 as general conclusions. These results provide information on the degradation of Pt under realistic FCV operating conditions, for example, those in a range-extender system.
1-5 References
[1] World Population Prospects 2017 Revision by United Nations:
https://population.un.org/wpp/Publications/Files/WPP2017_DataBooklet.pdf [2] World Energy Outlook 2017 by IEAs: https://www.iea.org/weo/.
[3] 10th Hydrogen and Fuel Cell Strategy Council by Ministry of Economy, Trade and Industry:
http://www.meti.go.jp/committee/kenkyukai/energy/suiso_nenryodenchi/010_haifu.html [4] How hydrogen empowers the energy transition by Hydrogen Council:
http://hydrogencouncil.com/wp-content/uploads/2017/06/Hydrogen-Council-Vision-Do cument.pdf.
- 10 -
[5] Hydrogen Production by Department of Energy:
https://www.energy.gov/sites/prod/files/2015/06/f23/fcto_myrdd_production.pdf [6] Toyota Motor Corporation:
http://www.pref.yamaguchi.lg.jp/cmsdata/2/9/0/29062fca51fd37c90ae60fa2630b4595.p df
[7] Society of Automotive Engineers of Japan, Journal Society of Automotive Engineers
of Japan, 72 (2018) Jan.
[8] Volvo Car Corporation:
https://www.vcj-press.jp/pressrelease/20170705
[9] E. Antolini, Energy Environ. Sci., 2 (2009) 915-931.
[10] DOE Hydrogen and Fuel Cells Program Record, published by U.S. Department of Energy: https://www.hydrogen.energy.gov/pdfs/15015_fuel_cell_system_cost_2015.pdf [11] J. A. Bett, K. Kinoshita and P. Stonehart, J. Catalysis, 35 (1974) 307-316.
[12] B. E. Conway and G. Jerkiewicz, J. Electroanal. Chem., 339 (1992) 123–146. [13] Z. Nagy and H. You, Electrochim. Acta, 47 (2002) 3037–3055.
[14] Y. Sugawara, T. Okayasu, A. P. Yadav, A. Nishikata, and T. Tsuru, J. Electrochem.
Soc., 159 (2012) F779-F786.
[15] K. Kinoshita, J. T. Lundquist, and P. Stonehart, J. Electroanal. Chem., 48 (1973) 157–166.
[16] P. J. Ferreira, G. J. la O’, Y. Shao-Horn, D. Morgan, R. Makharia, S. Kocha, and H. A. Gasteiger, J. Electrochem. Soc., 152 (2005) A2256-A2271.
[17] F. Hiraoka, K. Matsuzawa, and S. Mitsushima, Electrocatalysis, 4 (2013) 10–16. [18] M. F. Mathias, R. Makharia, H. A. Gasteiger, J. J. Conley, T. J. Fuller, C. J. Gittleman, S. S. Kocha, D. P. Miller, C. K. Mittelsteadt, T. Xie, S. G. Yan, and P. T. Yu,
- 11 -
The Electrochemical Society Interface, 14 (Fall Issue), (2005) 24-35.
[19] W. Bi, T. F. Fuller, J. Electrochem. Soc., 155 (2008) B215-B221.
[20] M. Uchimura, S. Sugawara, Y. Suzuki, J. Zhang, S. S. Kocha, ECS Trans., 16 (2008) 225–234.
[21] B. E. Conway, Prog. Surf. Sci., 49 (1995) 331.
[22] X. Wang, R. Kumar, and D. J. Myers, Electrochem. Solid-State Lett., 9 (2006) A225–A227.
[23] K. Yasuda, A. Taniguchi, T. Akita, T. Ioroi, and Z. Siroma, Phys. Chem. Chem.
Phys., 8 (2006) 746-752.
[24] A. Kongkanand and J. M. Ziegelbauer, J. Phys. Chem. C, 116 (2012) 3684–3693. [25] K. Kakinuma, Y. Chino, Y. Senoo, M. Uchida, T. Kamino, H. Uchida, S. Deki, and M. Watanabe, Electrochim. Acta, 110 (2013) 316-324.
[26] Y. Chino, K. Taniguchi, Y. Senoo, K. Kakinuma, M. Hara, M. Watanabe, and M. Uchida, J. Electrochem. Soc., 162, (2015) F736-F743.
[27] K. Kakinuma, R. Kobayashi, A. Iiyama, and M. Uchida, J. Electrochem. Soc., 165 (2018) J3083-J3089.
- 12 -
Chapter 2
Load cycle durability of a graphitized carbon black-supported
platinum catalyst in polymer electrolyte fuel cell cathodes
2-1 Introduction
Polymer electrolyte fuel cells (PEFCs) used in fuel cell vehicles (FCV) are power
generation devices with low environmental impact, having features such as high theoretical efficiency and zero CO2 emissions. One of the main impediments to the
expansion of the FCV market is the high cost of the FC engine system as compared to the internal-combustion engine, e.g., because the PEFC electrodes still require a large amount of Pt as the electrocatalyst. In addition, it is known that both the carbon-supported Pt electrocatalyst and the membrane are degraded under various types of FCV operating conditions such as startup/shutdown [1-4], load cycling [5-6], and idling [7-8]. It is important to increase the durability of the electrocatalyst under these operating conditions in terms of decreasing the FCV life cycle cost. Therefore, I particularly focused on load cycling, which accelerates the degradation of the Pt nanoparticles (NPs). Since load cycling leads to the degradation of Pt NPs due to dissolution [9-11] and particle growth [12-13], many researchers have been trying to resolve this issue. It is well known that the degradation of Pt NPs is evaluated by potential cycling, which simulates load cycling, using a potentiostat. The degradation of Pt has been intensively investigated under various potential cycling conditions by Mitsushima et al. [14-17]. According to these papers, the degradation of Pt under potential cycling is accelerated by a high positive-going rate and a low negative-going rate [15], increasing temperature and decreasing pH [16]. Moreover, other researchers
- 13 -
have also reported the degradation of Pt under various potential cycling regimes [18-20]. Uchimura et al. have reported that the degradation of Pt was accelerated to a greater extent under potential cycling involving asymmetric triangular profiles with lower negative-going rates compared with those with low positive-going rates [18]. Yasuda et al. found that Pt deposition in the membrane was accelerated by the presence of hydrogen transported through the membrane from the anode. This deposition was also affected by the presence of oxygen in the cathode [20]. Kongkanand et al. also concluded that the electrooxidation of Pt is accelerated more by the presence of oxygen than the presence of nitrogen at lower potentials [21]. The degradation of Pt NPs during potential cycling is primarily caused by Ostwald ripening and place exchange. Ostwald ripening leads to increased Pt particle size, because the smaller particles have a higher surface energy and thus are less stable than the larger particles [5,17,20,22]. Oxygen atoms adsorbed on the Pt surface can enter the Pt lattice by place exchange at potentials greater than 1.1 V [23-26]. These studies have revealed that the degradation of Pt during potential cycling is correlated strongly with the oxidation of Pt NPs. However, it has been suspected that the actual degradation of Pt is different from that observed with potential cycling with H2/N2, because the FCV operating condition includes load
cycling with H2/air.
In this research, I investigated the degradation of the electrocatalyst in terms of Pt dissolution, Pt deposition, and Pt particle growth in both the catalyst layer (CL) and membrane under various load cycling conditions, as a function of the open circuit voltage (OCV)/load holding time, current density range, and RH. Electrochemical evaluation was carried out with cyclic voltammetry (CV) and current–potential (I–E) polarization curve measurements. The electrodes were analyzed by transmission
- 14 -
electron microscopy (TEM), scanning ion microscopy (SIM) and scanning transmission electron microscopy–energy dispersive X-ray spectroscopy (STEM-EDX) before and after the load cycling evaluations. These results provide information on the degradation of Pt under realistic FCV operating conditions.
2-2 Experimental
2-2-1 Preparation of membrane-electrode assembly (MEA)
Uniformly catalyst-coated membranes (CCM) were prepared in the same manner as in our previous research [3,4]. The catalyst pastes were prepared with 30 wt% Pt-loaded graphitized carbon black for the cathode (Pt/GCB, TEC10EA30E, Tanaka Kikinzoku Kogyo K. K.) or 46 wt% Pt-loaded carbon black for the anode (Pt/CB, TEC10E50E, Tanaka Kikinzoku Kogyo K. K.), mixed with ionomer (ion exchange capacity, IEC = 0.99 meq g−1, Nafion ionomer DE521, E. I. Du Pont de Nemours & Co., Inc.), ethanol, and pure water by use of a planetary ball mill (P-6, Fritsch GmbH) for 30 min. The mass ratio of Nafion binder (dry basis) to carbon black (Nafion binder/carbon) was adjusted to 0.7. To prepare the uniform CCM, the catalyst pastes were directly sprayed onto a Nafion membrane maintained at 55 °C (NRE 211, 25 μm thickness, E. I. Du Pont de Nemours & Co., Inc.) with the pulse-swirl-spray technique (PSS, Nordson Co. Ltd.), and then dried at 60 °C in an electric oven. The CCMs were annealed by hot-pressing at 140 °C and 1.0 MPa for 3 min, and then they were assembled with two gas diffusion layers (GDLs, 25BCH, SGL Carbon Group Co., Ltd.) and a single serpentine pattern cell (Japan Automobile Research Institute (JARI) standard cell) with an active geometric area of 29.2 cm2. The Pt loading of the cathode CLs was 0.10 ± 0.006 mg-Pt
- 15 -
2-2-2 MEA characterization
The cell was operated with hydrogen and oxygen/air at 80 °C under ambient pressure (1 atm). Hydrogen gas was supplied to the anode and oxygen/air to the cathode. The flow rates of all gases were controlled by mass flow controllers. The utilizations of the reactant gases were 70% for H2, 40% for O2 and 40% for air. These gases were
humidified at various levels of humidification by bubbling through a heated water reservoir. The cell potential (E) was measured as a function of current density by use of an electronic load (PLZ-664WA, Kikusui Electronics Co.) operated in the constant current mode, controlled by a measurement system (AB-3520AS001, Panasonic Production Technology Co., Ltd.). The cell resistance was measured at 1 kHz under load by use of a digital ac milliohmmeter (Model 3566, Tsuruga Electric Co.). The I–E curves were measured during quasi-steady-state operation achieved after 5 min at each potential step. For experimental convenience, the hydrogen anode was used as the reference electrode for both MEA polarization and CV measurements, since the polarization of the hydrogen anode was relatively small, even at high current density. To evaluate the electrochemically active surface area (ECSA) of the Pt catalyst in the cathode layer, CV measurements were performed at 80 °C and 100% RH by use of a potentiostat (HZ-5000, Automatic Polarization System, Hokuto Denko Co.). The cathode compartment was purged with N2 (100 mL min−1, 100% RH), while H2 gas
(100 mL min−1, 100%-RH) was supplied to the anode. Prior to the sweep, the potential was maintained at 0.075 V for 3 s to ensure that the Pt was in a reproducibly reduced state. Then, the potential was swept from 0.075 V to 1.000 V at 20 mV s−1 and reversed back to 0.075 V. The electrical charge for H+ reduction to adsorbed H was calculated
- 16 -
V vs. RHE to 0.075 V at the cathode, with subtraction of the estimated double layer charging current [3,4]. The entire CV was measured without N2 flow to avoid perturbing
the H2 partial pressure [27]. The value of ECSA was determined from the hydrogen
adsorption charge referred to QHo = 0.21 mC cm−2, the conventional value for a
monolayer of adsorbed hydrogen on polycrystalline platinum [28].
2-2-3 Durability evaluations in load cycles
Fig. 2-1(a) shows the protocol for the evaluation of the durability of the Pt/GCB cathode catalysts in the current-load mode. Table 2-1 shows the details of the protocols employing various load cycling conditions involving OCV and load holding times at a high current density (sample names A1, A2 and A3), at a lower current density (A5) and at OCV (A4) under 100% RH and a lower RH (A6). These durability evaluation protocols can be characterized as follows: A1, with the OCV/load holding times of 3 s/3 s, simulates a normal acceleration/deceleration drive cycle; A2, with the OCV/load holding times of 3 s/60 s, simulates a high-speed drive cycle; A3, with the OCV/load holding times of 60 s/3 s simulates a high-frequency idling/drive cycle; A4, with OCV only, i.e., without a load cycle, simulates long-term idling; A5, with the OCV/load holding times of 60 s/3 s using low current density, simulates a possible strategy to suppress the degradation during load cycling in comparison with that using high current density, and A6, with the OCV/load holding times of 60 s/3 s at low RH, simulates a second possible strategy to suppress the degradation during load cycling in comparison with that at 100% RH. The durability evaluations were performed with H2 (anode, 145
mL min−1) and air (cathode, 604 mL min−1) in the potential range from ca. 0.6 V to OCV at 80 °C and ambient pressure. In the first step, the initial I-E curves and CVs
- 17 -
were measured. In the second step during the load cycling evaluations, the ECSA values of the cathode were examined every 2,000th cycle by CV. In the last step after the load cycling, the cell performances (I-E curves) were compared with the initial ones. In the post-analysis, the degradation of the Pt was observed by TEM. In addition, cross-sections of the MEAs were analyzed by two different methods. In the first, the deposition of Pt was observed in the membrane by scanning ion microscopy (SIM) in a focused ion beam system (FIB, FB-2200, Hitachi High-Technologies Co., Ltd.). In the second, the Pt distribution was observed in the cathode CL by STEM-EDX (HD-2700, Hitachi High-Technologies Co., Ltd.).
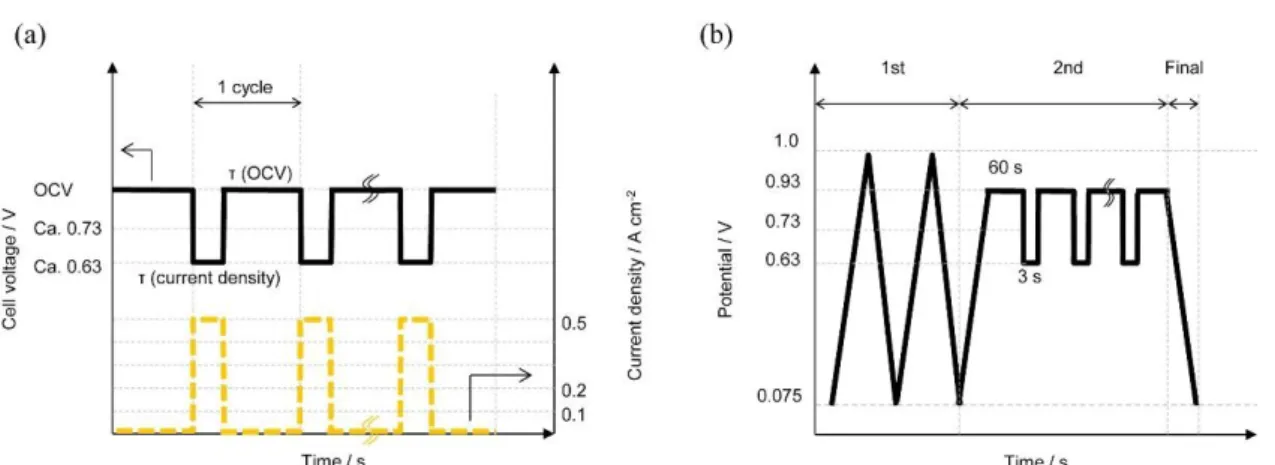
Figure 2-1. (a) Protocol for the simulation of fuel cell load cycles with OCV and various current loads (0, 0.1, 0.2, 0.5 A cm−2) with supply of H2/air at either 50 or 100% RH; holding time at
OCV, τ(OCV) = 3, 60 and 600,000 s, and holding time under current load, τ(CL) = 0, 3 and 60 s. (b) Simulated load cycle protocol in potentiostatic mode.
- 18 -
2-2-4. Pt oxidation characteristic during simulated load cycles by use of an actual potentiostat
Fig. 2-1(b) and Table 2-2 show the protocol and the conditions of the simulated load cycling carried out by use of an actual potentiostat, with H2 (anode, 100 mL min−1) and
N2 (cathode, 100 mL min−1) atmospheres at 80 °C. In the first step, CV was carried out
for 2 cycles at 20 mV s−1 to stabilize the electrocatalyst. In the second step, the simulated load cycles were performed at 240/0.1 V s−1 anodic/cathodic scan rates for 0, 12, 48, 100 cycles. In the final step, the reduction charge of PtO was measured by linear sweep voltammetry at 20 mV s−1 after various numbers of simulated load cycles. These conditions can be characterized as follows: B3 simulates the load cycle of A3 with the OCV/load holding times 60 s/3 s; B5 simulates a load cycle with low current density; and B6 simulates a load cycle at low RH in the potentiostatic mode, corresponding to the simulations under the current-load modes shown in Table 2-1 but replacing the OCV with the closed circuit potential 0.93 V.
2-3. Results and discussion
2-3-1. Effect of OCV/load holding time
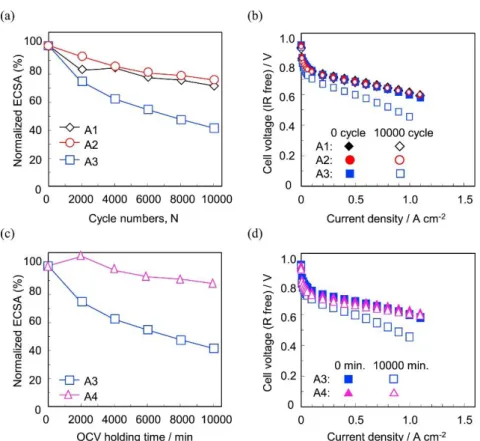
Fig. 2-2(a) shows the normalized ECSA changes during the load cycling durability evaluations, which were operated with H2 (anode) and air (cathode) atmosphere at
80 °C and 100% RH, as a function of the OCV/load holding time. The ECSA values of
- 19 -
the cathodes for all MEAs (samples A1, A2, A3) decreased during cycling. In particular, the ECSA change of the A3 cell (OCV/load holding times 60 s/3 s), decreased drastically. In contrast, the decreases for both the A1 cell (OCV/load holding times 3 s/3 s) and the A2 cell (3 s/60 s) were significantly smaller than that for the A3 cell. Fig. 2-2(b) shows the IR-free polarization curves before and after the durability evaluations. The I–E curves were measured in H2/air atmosphere at 80 °C and 100% RH.
The cell performances for both A1 and A2 obtained after the durability evaluations were nearly the same as their initial performances, but that for A3 decreased markedly. In a comparison of the cell performances and the ECSA values, the decreasing ECSA values of about 20% under the A1 and A2 conditions do not affect the cell performances, whereas decreasing ECSA values of more than about 50% do affect the cell performances in Fig. 2-2(a), (b). Therefore, I found that the ECSA decrease of 20% does not significantly affect the oxygen reduction reaction. Fig. 2-2(c) shows the normalized ECSA changes occurring during the durability evaluation A3 (OCV/load holding times 60 s/3 s) and A4 (OCV, without load) as a function of the accumulated OCV holding times for both durability evaluations. The decrease of ECSA for A4, without the load-cycling, was suppressed in comparison to that for A3. Fig. 2-2(d) shows the IR-free polarization curves before and after the durability evaluations. The cell performance for A4 did not decrease, but that for A3 did decrease noticeably, compared with their respective initial performances. These results indicate that the interim load cycles between the OCV holding periods clearly affected the degradation of the cathode electrocatalyst. This phenomenon corresponds to the previous results of our group, which reported the deleterious effects of interim CV on Pt/carbon black catalyst degradation during startup/shutdown cycling evaluation [4].
- 20 -
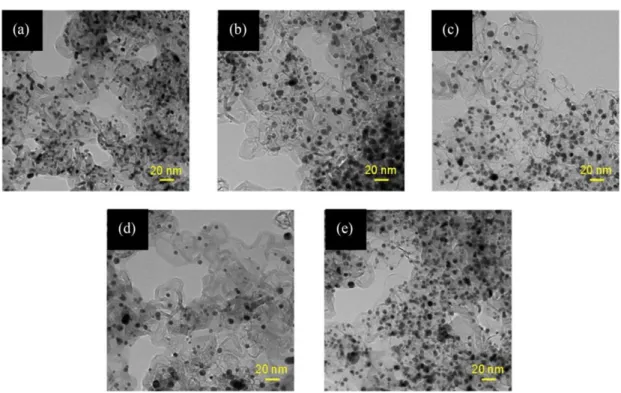
Fig. 2-3 shows TEM images of the Pt/GCB cathode catalyst before and after the durability evaluations with current load cycling. Comparing the images obtained for protocols with interim load cycles (b, c, d) and that obtained for a protocol without load cycling (e), it is clear that the Pt aggregation was enhanced by the interim load cycling. The mean particle size of the Pt/GCB cathode catalyst, which was 5.4 nm ± 2.3 nm after preconditioning (Fig. 2-3(a)), increased after the durability evaluations: (b) 7.7 nm ± 3.3 nm under A1 conditions; (c) 7.1 nm ± 2.3 nm under A2 conditions; (d) 7.5 nm ± 3.2 nm
Figure 2-2. (a) Normalized ECSA changes during the durability evaluations of load cycles with holding times of OCV/load (0.5 A cm−2) between ca. 0.63 V and OCV at 80 °C and 100% RH, ◊: 3 s/3 s (A1), ○: 3 s/60 s (A2) □: 60 s/3 s (A3), (b) IR-free polarization curves before and after the durability evaluations at 80 °C and 100% RH under H2/air, (c) Normalized ECSA changes
during the load cycles and the OCV holding at 80 °C and 100% RH, □: OCV/load holding time of 60 s/3 s (A3), △: OCV holding time of 10,000 min (A4), (d) IR-free polarization curves before and after the load cycles and OCV holding at 80 °C and 100% RH under H2/air.
- 21 -
under A3 conditions; and (e) 6.6 nm ± 2.7 nm under A4 conditions. In the TEM image (d) for A3, it is quite clear that fewer Pt NPs were observed probably due to the dissolution and/or detachment from the GCB support, although a mean particle size similar to those for A1, A2 and A4 was maintained. These results are well consistent with the ECSA changes and I-E performances shown in Fig. 2-2. The distinctive performance degradation for A3 must not have been brought about by either the load time period (A2) or that of OCV (A4) independently but by the combination of both the load and the long OCV time periods (A1< A3).
Figure 2-3. TEM images of Pt/GCB cathode catalyst before and after the durability evaluations: (a) initial Pt/GCB cathode electrocatalyst after conditioning, (b) after the durability evaluation with holding times of OCV 3 s/load 3 s (A1), (c) OCV 3 s/load 60 s (A2), (d) OCV 60 s/load 3 s (A3), (e) OCV holding time of 10,000 min without load cycle (A4).
- 22 -
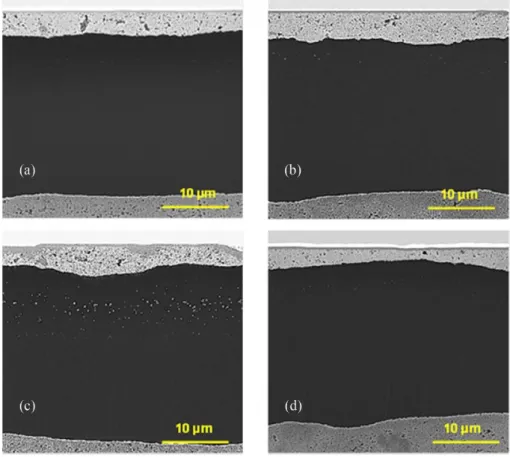
Fig. 2-4 shows the SIM images of the MEA cross-sections produced using the focused ion beam after the durability evaluations. A few Pt particles were observed in the membranes for the A1, A2 and A4 cells in Fig. 2-4 (a), (b), (d), but a large number of Pt particles were observed in the membrane of the A3 cell in Fig. 2-4(c). The size of the Pt particles in the A3 membrane was larger than those of the others. The location of the deposited Pt particles was near the cathode side of the membrane. Since the anode potential had been held at the hydrogen potential, it is concluded that the deposited particles must have formed from the Pt dissolved from the cathode CL. These results also indicate that the degradation of the Pt/GCB cathode was enhanced in the A3 condition, again consistent with the results of Fig. 2-2.
Figure 2-4. SIM images of the cross-sections of MEAs after the durability evaluations: (a) with OCV/load holding times of 3 s/3 s (A1), (b) 3 s/60 s (A2), (c) 60 s/3 s (A3), (d) OCV holding time of 10,000 min (A4).
- 23 -
2-3-2 Effects of both the current density range and RH on the degradation of cathode electrocatalyst
The effects of both the current density range and RH on the MEA performance were investigated in order to try to find ways to suppress the degradation of the cathode electrocatalyst (Fig. 2-5). The A5 cell was operated in the constant current mode at the load current density 0.1 A cm−2 at 80 °C 100% RH in order to control the potential range between ca. 0.73 V and the OCV. The A6 cell was also operated at the load current density 0.2 A cm−2 at 80 °C 50% RH in order to control the potential range between 0.63 V and the OCV. These durability evaluations were all carried out with the OCV/load holding times of 60 s/3 s in order to accelerate the degradation of Pt, based on the results of Fig. 2-2. Fig. 2-5(a) shows the normalized ECSA changes during the durability evaluations in the low current density range (A5) and the low RH condition (A6), compared with the A3 condition (see Table 2-1). The ECSA changes for both A5 and A6 were smaller than that for A3 during the durability evaluation. The cell performances for both A5 and A6 were higher than that of A3 after the durability evaluation (Fig. 2-5(b)). The deterioration of the cell performances under conditions A5 and A 6 was particularly suppressed in the high current density region compared with that of A3 (Fig. 2-5(c)). The cell voltage difference under the A6 condition was smaller than that under the A5 condition. From these results it is clear that the degradation of the electrocatalyst under the load cycles with long OCV holding time (60 s) is able to be suppressed by decreasing the load current density, and was more effectively suppressed by lowering the RH.
- 24 -
Figure 2-5 (a) Normalized ECSA changes of the cathode during the durability evaluations using A3, A5, A6 conditions, □: load cycle with OCV/load holding times of 60 s/3 s (A3, ca. 0.63 V − OCV, 100% RH), △: load cycle with low current density (A5, ca. 0.73 V − OCV, 100% RH), ○: load cycle at low RH (A6, ca. 0.63 V − OCV, 50% RH), (b) IR-free polarization curves before and after the durability evaluations, (c) difference of cell voltages before and after the durability evaluations using A3, A5, A6 conditions.
- 25 -
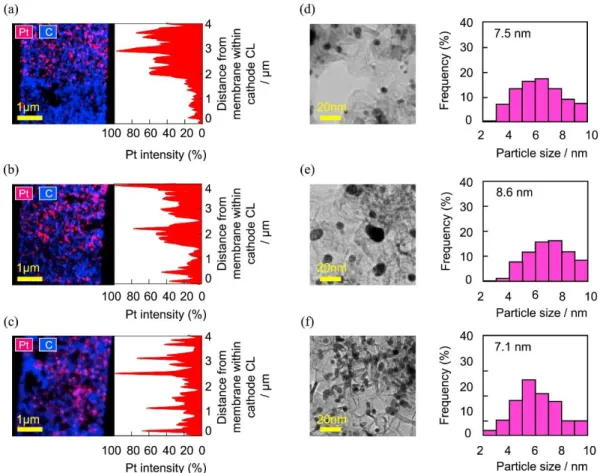
Fig. 2-6(a–c) shows the Pt distribution in the cathode CL near the side of the membrane after the durability evaluations using the load cycles with long OCV hold time (a, A3), with low current density (b, A5), and at low RH (c, A6). The vertical axis shows the distance in the CL thickness direction, increasing from the membrane boundary at the bottom. The EDX line-scan for Pt in Fig.2- 6(a) shows that the Pt intensity decreased toward the membrane boundary. In the cases of Fig. 2-6 (b) and (c), the Pt intensity did not show such a trend. Therefore, the performances of the A5 and A6 cells in the high current density region, over 1.0 A cm−2 (Fig. 2-5(b)), were maintained at a high level, presumably because uniform reaction areas were retained, due to suppression of the Pt particle dissolution near the membrane boundary. Fig. 2-6(d–f) shows TEM images of the Pt particles on the GCB support and the Pt particle size distribution after the durability evaluations. The mean diameter of the Pt particles before the durability evaluation was 5.4 nm ± 2.3 nm (Fig. 2-3(a)). All of the particles increased in size as a result of the durability evaluation. The Pt particle size for the A6 cell was 7.1 nm ± 3.2 nm, which was significantly smaller than those for the other cells, i.e., 7.5 nm for A3 and 8.6 nm for A5. These results indicate that the degradation of the electrocatalyst in the case of the high current density range (A3, ca. 0.63 V − OCV) under the large amounts of crossover H2 and back-diffusing water was preferentially
caused by the Pt dissolution near the membrane boundary, and that in the case of low current density (A5, ca. 0.73 V − OCV) under the small amounts of crossover H2 and
back-diffusing water was preferentially caused by Pt particle growth. On the other hand, in the durability evaluation at low RH (A6) under the small amount of water, both the Pt dissolution and Pt particle growth were effectively suppressed.
- 26 -
Figure 2-6. Pt distribution by EDX element mapping (left) and Pt line scan (right) in the cathode CL near side of the membrane after the durability evaluations using (a) load cycle with long OCV holding time (A3), (b) with low current density (A5), and (c) at low RH (A6). The vertical axis shows the CL distance from the membrane. TEM images of Pt particles on GCB support (left) and particle size distribution of Pt (right) after the durability evaluations; (d) load cycles with long OCV holding time (A3), (e) with low current density (A5), and (f) at low RH (A6).
- 27 -
2-3-3. Effects of both the lower potential limit and RH on the PtO reduction charge during simulated load cycles
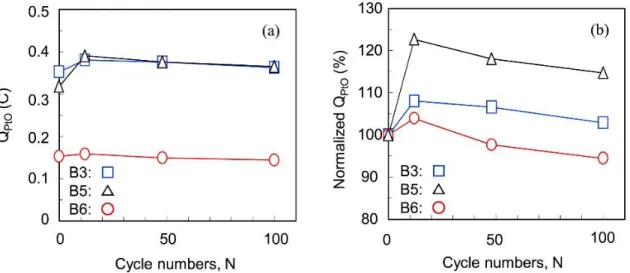
Fig. 2-7(a) shows the effects of both the lower potential limit and RH on (a) the absolute PtO reduction charge (QPtO) and (b) the normalized QPtO changes of the
Pt/GCB electrocatalyst during the three simulated load cycles using the potentiostat under H2/N2 atmosphere at 80 °C (B3, B5 and B6). The B3 condition corresponds to the
load cycles of the A3 conditions between the OCV and 0.5 A cm−2 loading at 100% RH. The B5 condition does that of the A5 condition between the OCV and 0.1 A cm−2 loading at 100% RH by changing the lower potential limit to 0.73 V from 0.63 V. The B6 condition does that of the A6 condition between the OCV and 0.2 A cm−2 loading at 50% RH (OCV/load, 60 s/3 s, see Table 2-1, Table 2-2).
Figure 2-7. Effects of both the low potential limit and RH on (a) absolute and (b) normalized PtO reduction charge during simulated load cycles using a potentiostat: △: with narrow potential range and high RH (B5, 0.73 V–0.93 V, 100% RH); ○: with wide potential range and low RH (B6, 0.63 V–0.93 V, 50% RH); □: with wide potential range and high RH (B3, 0.63 V–0.93 V, 100% RH).
- 28 -
All of the QPtO values at 12 cycles were larger than the initial values but then decreased.
The QPtO values increased in the order B6 < B3 < B5. These increases in the first stage
up to 12 cycles indicate the degree of the Pt oxidation, and the decreases in the second stage thereafter then indicate the dissolution of Pt. In the case of the B5 condition (0.73 V−0.93 V, simulating A5), the Pt oxidation was enhanced compared with that of B3 (0.63 V−0.93 V, simulating A3) and was then maintained. Differences in the impact of each of the conditions (B3, B5 and B6) in terms of the Pt oxidation during the potential cycling were more clearly distinguishable with the normalized QPtO in
Fig. 2-7(b). Therefore, these results indicate that the high potential operation (0.73 V) enhanced the Pt oxidation and also suppressed the Pt dissolution by the protection with the oxide film. In the case of the B6 condition (50% RH, simulating A6), the QPtO value
was smaller than that for B3 (100% RH, simulating A3). This result suggests that the low RH condition suppressed both the Pt oxidation and the Pt dissolution.
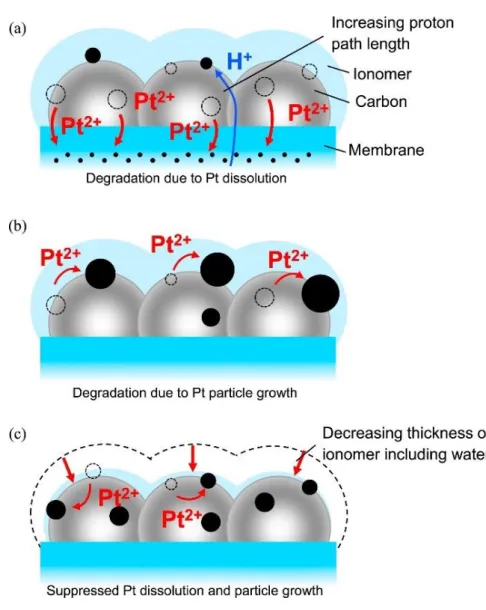
2-3-4. Mechanisms and suppression conditions for the degradation of the cathode performance in the load cycling using current density
From all of the results of operating conditions, A1 to A6 and B3, B5, B6, I illustrate the models of both the Pt degradation and the suppression in Fig. 2-8. The Pt oxidation dependence on the holding potential might also depend on the holding time at a high cell potential such as the OCV. In addition, as seen in the results of Fig. 2-7, the Pt oxidation is accelerated by the load cycles, in which the lower limit voltage is over ca. 0.73 V, such as in the A5, B5 conditions. Uchimura et al. reported that the Pt surface is covered with oxide species during the potential cycling in the potential range from 0.80 V to 0.95 V [19]. Kongkanand and Alsabet have also reported that Pt is more
- 29 -
oxidized at higher potentials and longer holding times [21,29]. The Pt dissolution is accelerated when the upper potential limit is greater than 0.8 V [30]. In addition, the presence of O2 would induce place-exchange [21]. Therefore, these results suggest that
the degradation from Pt dissolution is accelerated by both deep oxidation and reduction of PtO, which are caused by both the longer OCV holding and the lower potential limit, respectively (A3 or B3). The reduction of PtO is well known to produce Pt2+ [30]. The
Pt dissolution during the load cycles occurs particularly in the cathode CL near the membrane side, as shown in Fig. 2-6(a). The dissolved Pt2+ ions diffuse into the
membrane and are deposited therein by crossover H2 from the anode, as shown in
Fig. 2-4(c). These Pt degradation modes in the CL are illustrated in Fig. 2-8(a). The cell performance in the high current density region decreases remarkably, because the proton paths become long due to the Pt dissolution in the cathode CL near the membrane side (A3 in Fig. 2-2(b), (d), Fig. 2-5(b), (c), and Fig. 2-6(a)). The Pt in the cathode CL would gradually dissolute from the cathode near the membrane side toward the surface of the cathode CL with further increasing the number of load cycles.
- 30 -
Figure 2-8. Schematic of Pt (black) degradation on the GCB (gray) support in the cathode for (a) load cycles with a longer OCV holding time (A3, ca. 0.63 V − OCV, 100% RH), (b) that with a low current density range (A5, ca. 0.73 V − OCV, 100% RH), (c) that at low RH (A6, ca. 0.63 V − OCV, 50% RH).
- 31 -
In the load cycles of condition A5 (low current density, ca. 0.73 V and OCV), the deterioration of the cell performance was suppressed to a greater extent than that in the A3 condition (high current density, ca. 0.63 V and OCV). The comparison of the Pt distribution after the load cycles between conditions A3 and A5 (Fig. 2-6) indicate that the disappearance of Pt in the CL near the membrane side was suppressed by the low current load of the A5 condition. However, the Pt particle growth was enhanced by the A5 condition, which seems to have been caused by electrochemical Ostwald ripening. With the lower potential of ca. 0.63 V, more PtO is reduced, which can then diffuse into the membrane, whereas at ca. 0.73 V, less PtO is reduced, and the Pt2+ ions tend to be
deposited within the CL. In addition, the increase of water-back diffusion is suppressed at the lower current density of 0.1 A cm−1, compared with the higher current density of 0.5 A cm−1, which would otherwise help to carry the Pt2+ ions into the membrane.
Crossover H2 may also be suppressed, which otherwise would have caused Pt to be
deposited in the membrane at the lower current density. The operating condition with current load affects the amount of water associated with transporting protons [32]; increased humidity has been shown to enhance the H2 permeability [33], so I
hypothesize that increased load leads to increased H2 crossover. These Pt degradation
modes are consistent with Fig. 2-6(b) and are illustrated in Fig. 2-8(b).
In the case of the low RH condition of both A6 and B6, the deterioration of the cell performance and the QPtO were smaller than these of the other conditions (Fig. 2-5,
Fig. 2-7). The thicknesses of both the ionomer and the membrane would decrease by lowering the RH, and the water contents would also decrease. The Pt ion transport in the ionomer and membrane would decrease with the shrinking of the water (and ionic) channel networks due to the decrease of the water content in the polymer electrolyte
- 32 -
[31]. In addition, the oxidation of Pt was able to be suppressed during the load cycles under the low RH condition, because the QPtO of B6, simulating A6, during load cycling
at 50% RH was less than the initial value after 12 cycles (Fig. 2-7). Uchimura et al. have also reported that Pt dissolution is suppressed at low RH (ca. 30% RH) [19]. Therefore, the Pt dissolution and particle growth during the load cycling under lower RH was suppressed (Fig. 2-6(c), (f)), because the Pt ion transport was low, the oxidation of Pt was limited, and the redeposition of Pt was inhibited, as illustrated in Fig. 2-8(c). Consequently, I found that low RH operation during load cycling is important in suppressing the Pt degradation from Pt dissolution and Pt particle growth in the cathode CL.
2-4 Conclusions
I investigated Pt degradation on the GCB support during load cycling as a function of the holding times of OCV/load at 80 °C and 100% RH and found that the Pt degradation depends on the holding time of the OCV during the load cycling. In addition, the Pt dissolved from the cathode electrocatalyst layer was significantly deposited in the membrane during load cycles with longer OCV holding times. I also investigated the effect of both the RH and the current density on the Pt degradation during load cycles with longer OCV holding times and found that the load cycling with lower current density, i.e., higher operating potential, accelerated the Pt particle growth but suppressed the Pt dissolution, and revealed that both the dissolution and the redeposition of Pt were effectively suppressed during load cycling at lower RH due to the decrease of the water content in both ionomer and membrane, which contributes to the poor transport of Pt ions and the suppression of Pt oxidation. Thus, I conclude that the Pt degradation during
- 33 -
load cycling is able to be suppressed by operation with a suitable low RH, even for longer OCV holding times, such as during idling and immediately after fuel cell startup.
2-5 References
[1] C.A. Reiser, L. Bregoli, T.W. Patterson, J.S. Yi, J.D. Yang, M.L. Perry, and T.D. Jarvi, Electrochem. Solid-State Lett., 8 (2005) A273-A276.
[2] P.T. Yu, W. Gu, R. Makharia, F.T. Wagner, and H.A. Gasteiger, ECS Trans., 3 (2006) 797-809.
[3] Y.-C. Park, K. Kakinuma, M. Uchida, D.A. Tryk, T. Kamino, H. Uchida, and M. Watanabe, Electrochim. Acta, 91 (2013) 195-207.
[4] Y.-C. Park, K. Kakinuma, M. Uchida, H. Uchida, and M. Watanabe, Electrochim.
Acta, 123 (2014) 84-92.
[5] R.L. Borup, J.R. Davey, F.H. Garzon, D.L. Wood, and M.A. Inbody, J. Power
Sources, 163 (2006) 76-81.
[6] R. Lin, B. Li, Y. P. Hou, and J.M. Ma, J. Hydrogen Energy, 34 (2009) 2369-2376. [7] K. Teranishi, K. Kawata, S. Tsushima, and S. Hirai, Electrochem. Solid-State Lett., 9 (2006) A475-A477.
[8] S. Kundu, M. Fowler, L.C. Simon, and R. Abouatallah, J. Power Sources, 182 (2008) 254-258.
[9] D.C. Johnson, D.T. Napp, and S. Bruckenstein, Electrochim. Acta, 15 (1970) 1493-1509.
[10] D.A.J. Rand and R. Woods, J. Electroanal. Chem. Interfacial Electrochem., 35 (1972) 209-218.
- 34 -
A225-A227.
[12] J.A. Bett, K. Kinoshita, and P. Stonehart, J. Catal., 35 (1974) 307-316. [13] J.A.S. Bett, K. Kinoshita, and P. Stonehart, J. Catal., 41 (1976) 124-133.
[14] S. Kawahara, S. Mitsushima, K. Ota, and N. Kamiya, ECS Trans., 3 (2006) 625-631.
[15] S. Mitsushima, S. Kawahara, K. Ota, and N. Kamiya, J. Electrochem. Soc., 154 (2007) B153-B158.
[16] S. Mitsushima, Y. Koizumi, S. Uzuka, and K. Ota, Electrochim. Acta, 54 (2008) 455-460.
[17] F. Hiraoka, K. Matsuzawa, and S. Mitsushima, Electrocatalysis, 4 (2013) 10-16. [18] M. Uchimura and S.S. Kocha, ECS Trans., 11 (2007) 1215-1226.
[19] M. Uchimura, S. Sugawara, Y. Suzuki, J. Zhang, and S.S. Kocha, ECS Trans., 16 (2008) 225-234.
[20] K. Yasuda, A. Taniguchi, T. Akita, T. Ioroi, and Z. Siroma, Phys. Chem. Chem.
Phys., 8 (2006) 746-752.
[21] A. Kongkanand and J.M. Ziegelbauer, J. Phys. Chem. C, 116 (2012) 3684-3693. [22] S. Chen, H.A. Gasteiger, K. Hayakawa, T. Tada, and Y. Shao-Horn, J. Electrochem.
Soc., 157 (2010) A82-A97.
[23] B.E. Conway, Prog. Surf. Sci., 49 (1995) 331-452.
[24] H. Imai, K. Izumi, M. Matsumoto, Y. Kubo, K. Kato, and Y. Imai, J. Am. Chem.
Soc., 131 (2009) 6293-6300.
[25] G. Jerkiewicz, G. Vatankhah, J. Lessard, M.P. Soriaga, and Y.-S. Park, Electrochim.
Acta, 49 (2004) 1451-1459.
- 35 -
12 (2010) 4184-4190.
[27] M. Watanabe, K. Makita, H. Usami, and S. Motoo, J. Electroanal. Chem.
Interfacial Electrochem., 197 (1986) 195-208.
[28] R.N. Carter, B.K. Brady, K. Subramanian, T. Tighe, and H.A. Gasteiger, ECS
Trans., 11 (2007) 423-433.
[29] M. Alsabet, M. Grden, and G. Jerkiewicz, J. Electroanal. Chem., 589 (2006) 120-127.
[30] Y. Sugawara, T. Okayasu, A.P. Yadav, A. Nishikata, and T. Tsuru, J. Electrochem.
Soc., 159 (2012) F779-F786.
[31] W. Bi, Q. Sun, Y. Deng, and T.F. Fuller, Electrochim. Acta, 54 (2009) 1826-1833. [32] Q. Yan, H. Toghiani, and J. Wu, J. Power Sources, 158 (2006) 316-325.
[33] S. Takaichi, H. Uchida, and M. Watanabe, Electrochem. Commun., 9 (2007) 1975-1979.
- 36 -
Chapter 3
Platinum anti-dissolution mechanism of Pt/Nb-SnO
2cathode catalyst
layer during load cycling in the presence of oxygen for polymer
electrolyte fuel cells
3-1 Introduction
Polymer electrolyte fuel cells (PEFCs) are high energy efficiency devices that convert
chemical energy directly into electricity via the hydrogen oxidation reaction (HOR) and the oxygen reduction reaction (ORR). PEFCs also have priority in being considered for proliferation, since they are zero-emission devices and are thus suitable for the global environment. Toward the widespread use of fuel cell vehicles (FCVs), the reduction of FCV cost, installation of hydrogen refueling stations (HRS), and improvement of PEFC performance (power density, durability) should be achieved. I am now taking on the challenge of developing PEFCs with high durability. In particular, it is very important for PEFCs to increase the durability of the cathode catalyst layer (CL). Most of the FCV performance degradation occurs under startup/shutdown and load cycling operations. The startup/shutdown process increases the cathode potential over 1.0 V and thus accelerates the carbon corrosion, based on the reverse current mechanism, based on the following reaction: [1]
C + 2H2O → CO2 + 4H+ + 4e−
E = 0.207 V vs. the reversible hydrogen electrode (RHE)
Pt catalyst nanoparticles supported on ordinary carbon blacks are vulnerable to such corrosion, but graphitized carbon black (GCB) is one of the promising cathode supports to mitigate the degradation, due to its high crystallinity. However, Pt/GCB is not an
- 37 -
ultimate solution, since it is not able to increase drastically the startup/shutdown durability of the CL [2-4]. This is particularly true for commercial vehicles, such as taxis, buses and trucks, which need further durability with high activity. Thus, highly active, highly durable catalysts supported on non-carbon supports are required.
Many researchers have proposed alternative cathode supports, for example, metal oxides such as Sn-based oxides [5-12] and Ti-based oxides [13-14], and Pt-metal oxide composites [15]. The durability of Pt catalysts supported on these cathode oxides has been shown to be higher than that on carbon supports under startup/shutdown conditions [6,12]. In the case of load cycling conditions, the durability of the Pt/GCB CL decreases, due to the fact that the cycling involves long holding times at OCV at high relative humidity, close to 100% RH, because of accelerated dissolution of platinum nanoparticles that have been heavily oxidized [16]. Kneer et al. also reported that the presence of oxygen could have an effect on the catalyst degradation mechanism in MEAs [17]. To enhance the durability of the Pt/GCB CL, the latter needs to be at lower relative humidity [16], but the performance decreases at low relative humidity. In contrast, the performance deterioration of the platinum catalyst supported on Sn0.96Nb0.04O2-δ (Pt/Nb-SnO2) CL is suppressed at lower relative humidity. The reason is
indicated to be that the hydrophilic surface of the Nb-SnO2 would aid the adsorption of
the water generated in the cathode and thus contribute to an increase in the proton conductivity of the Nafion binder in the CL at low humidity [11]. The Pt/Nb-SnO2 CL
also has high durability due to a homogeneous coverage of the Nafion binder on the hydrophilic surface of the Nb-SnO2 support in comparison with that of Pt/GCB [11,18].
Binninger et al. also reported the high durability of Pt/Sb-doped SnO2 (ATO) during
- 38 -
square of the capacitance of Pt/ATO exponentially increased with increasing cathode potential from 0 V to 1.0 V vs. RHE. The increase of the inverse square of the capacitance indicates that electron depletion of the nanoparticulate ATO supports occurs at potentials above 0.6-0.8 V vs. RHE [19]. In other research by Chino et al., the increase of the high frequency (HF) ohmic resistance with increasing cathode potential can be attributed to the electrical conductivity of the Nb-SnO2 support [20]. Shintani
also reported the atmospheric resistive switching mechanism (ARSM), which originated from the control of the depletion layer of the oxide support of tantalum-doped titanium dioxide (Ta-TiO2), and that the Pt catalyst supported thereon (Pt/Ta-TiO2) as an anode
catalyst layer enhanced the durability of the Pt/GCB cathode CL under startup/shutdown conditions [21]. Senoo et al. also reported that tin oxide nanoparticles showed higher resistivity in oxidizing atmospheres than in reducing atmospheres at room temperature [22]. n-Type semiconducting nanoparticles undergo the formation of a depletion layer due to the presence of adsorbed molecules such as oxygen, hydroxyls, etc., which enhance both the double-Schottky barrier and contact resistance around the neighboring grain contacts [23]. Both Pt loading on the oxide support and development of the fused aggregate network structure are required to improve the electrical conductivity and catalytic activity of the Pt catalyst supported on the oxide support. These characteristics of the Pt catalyst supported on Nb-SnO2 are desirable for applications involving heavy
operation, such as commercial FCVs, and should be also investigated in order to elucidate the appropriate operation of Pt/Nb-SnO2.
In this study, I propose a novel mechanism regarding the depletion layer for suppression of the degradation of the Pt/Nb-SnO2 CL under load cycling. I call this
- 39 -
cycle durability of Pt/Nb-SnO2 CLs using membrane assembly electrodes (MEAs)
compared to that of the Pt/GCB CL as a function of the cathode oxygen concentration under galvanostatic and potentiostatic cycling operating conditions.
3-2 Experimental
3-2-1 Synthesis and characterization of platinum catalyst supported on niobium-doped tin oxide
Nb-SnO2 nanoparticles were synthesized by the flame combustion method, as
described in our previous reports [6,9,11]. The as-prepared oxide was sintered at 800 oC
for 4 h in air in a rotary kiln furnace. The Pt nanoparticles were loaded by the colloidal method [9]. Pt/Nb-SnO2 catalysts with Pt loadings of 13.9 wt%, 18.5 wt% were
determined by inductively coupled plasma-mass spectrometry (ICP-MS, 7500CX, Agilent Technologies, Inc.).
3-2-2 Preparation of MEAs and single cells
I fabricated two kinds of MEAs using Pt/Nb-SnO2 and Pt/GCB cathode catalysts
(TEC10EA30E, Tanaka Kikinzoku Kogyo K. K.). The anode catalyst used for both MEAs was Pt/CB (TEC10E50E, Tanaka Kikinzoku Kogyo K. K.). The catalyst ink for each cathode was prepared with the catalyst powders, Nafion binder (ion exchange capacity IEC = 0.99 meq g-1, DE521, E. I. Du Pont de Nemours & Co., Inc.), ethanol
and pure water by use of a planetary ball mill at 270 rpm for 30 min. The volume ratios of Nafion binder (dry basis) to the Nb-SnO2 support and GCB support (Nafion
binder/support) were adjusted to 0.2 and 0.7, respectively, as the optimum volume ratios. In the case of Pt loaded on an Sn-based oxide support, Takahashi et al. reported that the
- 40 -
cell performance of Pt/Ta-SnO2 CL with the volume ratio 0.2 was higher than that with
0.7 [24]. These catalyst inks were directly sprayed onto both sides of the Nafion membrane (NRE 211, DuPont, 25 μm thickness) as the anode and cathode by the pulse-swirl-spray (PSS, Nordson Co. Ltd.) technique to prepare the catalyst-coated membranes (CCMs), which were then dried at 60 °C in an electric oven overnight. The CCMs were annealed by hot-pressing at 140 °C and 1.0 MPa for 3 min, and then they were sandwiched between two gas diffusion layers with microporous layers (Sigracet® GDLs, 25BCH, SGL Carbon Group Co., Ltd.) and a single serpentine pattern cell which comprises two carbon separators and stainless endplates (Japan Automobile Research Institute (JARI) standard cell25) with an active geometric area of 29.2 cm2. Pt loadings
of the cathodes with Pt/Nb-SnO2 or Pt/GCB were 0.1 ± 0.005 mg cm−2, and those of the
anodes with Pt/CB were 0.1 ± 0.015 mg cm−2. The Pt high loading of the anode was used to maintain a negligibly small polarization under all of the experimental conditions, so that it could be used as an RHE for the evaluation of the polarization behavior of each cathode. In the post-test analysis, the degradation of the Pt catalysts was observed by transmission electron microscopy (TEM, H-9500, Hitachi High-Technologies Co., Ltd.), specifically, examining the Pt NP sizes before and after the durability evaluations. In addition, cross-sections of the inlet and outlet MEAs were analyzed by scanning ion microscopy (SIM) in a focused ion beam system (FIB, FB-2200, Hitachi High-Technologies Co., Ltd.) in order to observe the deposition of Pt in the membrane after the durability evaluations.
- 41 -
3-2-3 Cell performance and load cycling evaluations
The cell performances were evaluated by the same procedure as employed in my previous research [16]. The cells were operated with hydrogen and oxygen/air at 80 °C under ambient pressure (1 atm). Hydrogen gas was supplied to the anode and oxygen/air to the cathode. The flow rates of all gases were controlled by mass flow controllers. The utilizations of the reactant gases were 70% for H2, 40% for O2 and 40% for air. These
gases were humidified at 80% RH and 100% RH by bubbling through a heated water reservoir. The cell potential (E) was measured as a function of current density by use of an electronic load (PLZ-664WA, Kikusui Electronics Co.) operated in the constant current mode, controlled by a measurement system (FCE-1, Panasonic Production Technology Co., Ltd.). The cell resistances of Pt/GCB CLs and Pt/Nb-SnO2 CLs were
measured at 1 kHz and 10 kHz under load by use of a digital ac milliohmmeter (Model 3566 for 1 kHz and 356E for 10 kHz, Tsuruga Electric Co.), respectively. In our previous paper, I measured the impedances of Pt/Nb-SnO2 and Pt/GCB cathode catalyst
layers and found that the intersections of the x-axis of the Nyquist plots appeared near 10 kHz and 1 kHz, respectively [20]. To facilitate the resistance measurements in the present work, I utilized two different types of milliohmmeters with these two frequency settings, as noted above. The I-E curves were measured during quasi-steady-state operation achieved after 5 min at each potential step. The hydrogen anode was used as the reference electrode for both MEA polarization and CV measurements. To evaluate the electrochemically active surface area (ECSA) of the Pt catalyst in the cathode layer, CV measurements were performed at 80 °C and 100% RH by use of a potentiostat (HZ-5000, Automatic Polarization System, Hokuto Denko Co.). The cathode compartment was purged with N2 (100 mL min-1, 100% RH), while H2 (100 mL min-1,
- 42 -
100% RH) was supplied to the anode. Prior to the sweep, the potential was maintained at 0.075 V for 5 s to ensure that the Pt catalyst was in a reproducibly reduced state. Then, the potential was swept from 0.075 V to 1.000 V at 20 mV s-1 and reversed back to
0.075 V. The electrical charge for H+ reduction to adsorbed H was calculated from the
current flowing in the negative-going potential sweep in the range from ca. 0.4 V vs. RHE to 0.01 V at the cathode, with subtraction of the estimated double layer charging current [26,27]. The entire CV was measured without N2 flow to avoid perturbing the
H2 partial pressure [28]. The value of ECSA was determined from the hydrogen
adsorption charge referred to QH◦ = 0.21 mC cm-2, the conventional value for a
monolayer of adsorbed hydrogen on polycrystalline platinum [29]. The crossover hydrogen from the anode to the cathode was measured by use of linear sweep voltammetry (LSV) with a potentiostat (HZ-5000, Automatic Polarization System, Hokuto Denko Co.) at 80 °C 100% RH. The cathode compartment was purged with N2
(100 mL min-1), while H
2 (100 mL min-1) was supplied to the anode. The potential was
swept from 0.15 V to 0.60 V at 0.5 mV s-1. In addition, the shorting resistance of MEAs
was estimated from the slope of the LSV. Fig. 3-1 shows the protocol for the durability evaluations of Pt/Nb-SnO2 CLs and Pt/GCB CLs under galvanostatic/potentiostatic
operation (see also Table 3-1 for details). In the case of the load cycling evaluations under galvanostatic operation, protocols between OCV and low current density of 0.33 A cm-2 (air supplied), and between OCV and high current density of 0.55 A cm-2 (O
2
supplied), were carried out (Fig. 3-1a). In the case of the potential cycling evaluation under potentiostatic operation compared with the load cycling evaluations, the potential cycles for the cell using the Pt/Nb-SnO2 cathode were operated between an upper cell
- 43 -
potentials reached during the load cycling evaluations under galvanostatic operation under H2/air conditions (Fig. 3-1b). The potential cycles of the cell using Pt/GCB
cathode were operated between 0.96 V and 0.65 V for the same purpose. The operating conditions during the durability evaluations from 0 to 10,000 cycles were as follows: utilizations of the reactant gases: H2 (70%)/air (40%), H2 (70%)/O2 (20%) gas flow
rates: H2 (100 mL m-1)/N2 (100 mL m-1), and the cell temperature and the gas humidity:
80 °C and 80% RH. These durability evaluations are denoted as follows: A1, A2, B1, B2, with OCV/load holding times of 60 s/3 s; and A3, B3, with upper/lower cell voltage holding times of 60 s/3 s; the sweep rate of 165 mV s-1 from the lower to upper cell
voltage simulates the durability tests of A2, B2.
Figure 3-1. (a) Protocol for the durability evaluations under H2/air (0.33 A cm-2) and H2/O2
(0.55A cm-2) using galvanostatic operation, (b) protocol for the durability evaluation under H 2/N2
using potentiostatic operation.
![Figure 1-2. Three speeds of CO 2 emissions growth in the New Policies Scenario [2].](https://thumb-ap.123doks.com/thumbv2/123deta/7693577.1216652/5.892.243.655.563.813/figure-speeds-emissions-growth-new-policies-scenario.webp)
![Figure 1-4. Excess power can be used to produce hydrogen for seasonal energy storage (simulation for Germany 2050, in GW) [4]](https://thumb-ap.123doks.com/thumbv2/123deta/7693577.1216652/8.892.174.724.397.760/figure-excess-produce-hydrogen-seasonal-storage-simulation-germany.webp)
![Fig. 1-5 shows the components of fuel cell (FC) stack cost [10]. Catalyst cost is the highest of all components](https://thumb-ap.123doks.com/thumbv2/123deta/7693577.1216652/10.892.144.749.605.824/fig-shows-components-fuel-stack-catalyst-highest-components.webp)