INTERRELATIONSHIP BETWEEN CONSUMER, UTILITY, AND
GROUNDWATER EXTERNALITIES IN WATER PRICING IN
KATHMANDU NEPAL
(ネパールカトマンズでの水価格設定における消費者、給水事業体ならびに 地下水外部性の相互関係)
MARCH 2019
iii
INTERRELATIONSHIP BETWEEN CONSUMER, UTILITY, AND
GROUNDWATER EXTERNALITIES IN WATER PRICING IN
KATHMANDU NEPAL
(ネパールカトマンズでの水価格設定における消費者、給水事業体ならびに 地下水外部性の相互関係)
A dissertation submitted in partial fulfillment of the requirements for the degree of Doctor of Philosophy in Engineering
Special Doctoral Course on Integrated River Basin Management Interdisciplinary Graduate School of Medicine and Engineering
University Of Yamanashi, Japan
Advisory Committee: Prof. Futaba Kazama (Supervisor) Prof. Nishida Kei Prof. Junko Shindo
Assoc. Prof. Shinichi Muto Assoc. Prof. Hiroshi Ishidaira Prof. Keiichi Masutani
iv
Table of Contents
LIST OF FIGURES ... vi
LIST OF TABLES ... vii
LIST OF ABBREVIATIONS ... viii
Acknowledgements ... x
Preface: ... xi
Abstract ... - 1 -
Background ... 3
1.1. Balance between water as a right and water as an economic good. ... 3
1.2. Fundamentals of Water pricing ... 3
1.3. Water expenditure ratio for consumers and working ratio for the utilities ... 5
1.4. Water institutions and their indexes ... 5
Problem statement ... 7
Objective and scope ... 9
3.1. Specific objectives ... 9
3.2. Scope of the study: ... 9
3.3. Organization and dissertation ... 10
Material and methods ... 12
4.1. Study Area ... 12
4.1.1. Water institutions inside Kathmandu Valley: ... 12
4.1.2. Socioeconomic ... 13
4.2. Methodological Framework: ... 14
4.2.1. Methodological framework for acceptable water price estimation ... 14
4.2.1.a Water use scenarios and estimation of water deficit ... 15
4.2.2.b Index of utility sustainability, consumer’s affordability and equity ... 16
4.2.2. Methodological framework for taxation and subsidies calculation... 17
4.2.2.a Analysis of household’s water use... 17
4.2.2.b Water Price Calculation ... 18
4.2.2.c Water supply and demand analysis ... 20
4.2.2.d Identifying the water pricing challenges: ... 20
4.2.2.e Estimation of groundwater taxation ... 20
Water price analysis based on ER and WR ... 21
5.1. Expenditure ratio before MWSP ... 21
5.2. Water supply and demand after MWSP ... 21
v
5.4. Factors affecting calculations based on ER and WR ... 25
5.4.1. Household water use and effect of minimum volume in water price ... 26
5.4.2. Ground Water Accessibility ... 26
Water price comparison of multiple water sources ... 28
6.1. Future water deficit ... 28
6.2. Monthly water price and required tax for groundwater use ... 29
6.3. Possible measure and challenges ... 32
6.4. Water use pattern and proposal for changing tariff system ... 33
Conclusion ... 36
General conclusions: ... 36
Specific conclusions: ... 37
Recommendations ... 40
Referrence: ... 41
Annex-1 : Summary of response of all of the respondents ... 44
vi LIST OF FIGURES
Figure 1: Cost of Water adapted from Roger et al. ... 4
Figure 2 Water Institution, illustrative inter-linkages, evaluating water sector and sector performance adapted from Saleth and Dinar [6] ... 6
Figure 3 Chapter divisions ... 11
Figure 4 Overall methodological framework ... 14
Figure 5 Methodological Framework for acceptable water price estimation ... 15
Figure 6 Methodological framework for taxation and subsidy analysis ... 17
Figure 7 Current ER in various service areas of Kathmandu ... 21
Figure 8 Comparison of average expenditure ratio with water price at various minimum water use scenarios... 23
Figure 9 Comparison of working ratio with water price at various minimum water use scenarios ... 24
Figure 10 ER, WR and standard deviation of threshold values and acceptable water price range which satisfy (WR<0.7, ER<1%) ... 24
Figure 11 Expenditure ratio in % at minimum water use = 80LPCD, water price = NRs.24/CuM ... 25
Figure 12 Demand and supply deficit of KUKL water for various water consumption scenarios. ... 28
Figure 13 Monthly water price of various sources per building depending on water consumption. ... 30
Figure 14 Taxation requirements with different water consumption scenarios (NRs./month). ... 31
Figure 15 Water quantity and blocks based upon economics of water use. ... 33
vii LIST OF TABLES
Table 1: ER and WR in different water utilities across the globe ... 5 Table 2: Data sources ... 13 Table 3 Data summary for water taxation and subsidy analysis ... 19 Table 4 Water use, proposed supply and groundwater accessibility post-MWSP in different service areas of KUKL ... 22 Table 5 Water sources inside the valley and their use preferences. ... 28
viii LIST OF ABBREVIATIONS
ADB Asian Development Bank
CBS Central Bureau of Statistics
DWSS Department of Water Supply and Sanitation
ER Expenditure Ratio
GWRDB Groundwater Resources Development Board
HPCIDB
High Powered Committee for Integrated Development of Bagmati Civilization
IBT Inclining Blocks Tariff
INGO International Non- Government Organization
KV Kathmandu Valley
KUKL Kathmandu Upatyaka Khanepani Limited
KVWSMB Kathmandu Valley Water Supply Management Board
LPCD Liter-Per-Capita-a-Day
MDG Millennium Development Goal
MLD Million-Liter-a-Day
MoE Ministry of Environment
MWSP Melamchi Water supply Project
NGO Non-Government Organization
PID Project Implementation Directorate
SDG Sustainable Development Goal
TE Total Expenditure
ix
VDC Village Development Committee
WE Water Expenditure
WECS Water and Energy Commission Secretariat
WHO World Health Organization
WIHI Water Institutions Health Index
WR Working Ratio
WSI Water Security Index
WTFC Water Tariff Fixation Commission
x Acknowledgements
I would like to express my deep gratitude to my supervisor Prof. Futaba Kazama for her continuous support during my research period. I am earnestly indebted by her motivation in producing something new during these years.
I would like to thank my dissertation committee members Prof. Kei Nishida , Prof. Junko Shindo, Associate Prof. Shinichi Muto ,Associate prof. Hirsohi Ishidiara, Prof. Keiichi Masutani for their support and guidance during my research period. I am thankful to immediate joint secretary of Ministry of water supply and sanitation Ram Chandra Devkota, Rajan Raj Pandey, Sunil Kumar Das, Ramdeep Sah for his assistance to pursue my PhD. I express my sincere thanks to asst.prof.Sadhana Shrestha for her fruitful suggestions during my research period. I would like to thank Dr. Tatsuru Kamei, my tutor Kenta Shinoda and my lab members Yuya Tutsumi, Mai Nakano, who supported me during workshops and conferences.
I express my sincere thanks to the chief of Kathmandu Valley Water Supply Management Board Dr. Sanjeev Bickram Rana, Chief of KUKL Dr. Mahesh Bhattarai, employees of Valley boards Anuj Khanal, Sushil K.C. and Water supply and sanitation expert Bhushan Tuladhar for their valuable support during data preparation.
I would like to thank Dr. Bheshraj Thapa for helping my data preparation and analysis and Bikash Malla, Dr. Rajani Ghazu Shrestha, Sarmila Tandukar, Bijay Man Shakya, Khadga Bahadur Shrestha, Niva Sthapit for their valuable support during my stay in Japan. And Finally I would like to thank my parents Ram Prasad Ojha and Gita Ojha, my wife Sirjana Niroula for their valuable support during my stay in Japan.
xi Preface:
The content of this dissertation is based (fully or partially) on the work published or awaiting publication (as listed below) by Mr. Rajit Ojha. Although these works have co-authors, the substantial contribution (intellectual, research and writing) was that of the first author, and any specific contribution of co-authors have either not been presented in this dissertation or have been duly acknowledged.
Ojha, R.; Thapa, B.R.; Shrestha, S.; Shindo, J.; Ishidaira, H.; Kazama, F. Water Price Optimization after the Melamchi Water Supply Project: Ensuring Affordability and
Equitability for Consumer’s Water Use and Sustainability for
Utilities. Water 2018, 10, 249.
Ojha, R.; Thapa, B.R.; Shrestha, S.; Shindo, J.; Ishidaira, H.; Kazama, F. Water Taxation and Subsidy Analysis Based on Consumer Water Use Behavior and Water Sources Inside the Kathmandu Valley. Water 2018, 10, 1802.
1 Abstract
The sustainability of water supply services has been central to the main water supply agenda globally. Affordability and equitable distribution of water can be considered a way to improve sustainability in water supply services. Generally, “willingness to pay” is seen as the indicator by which affordability of water supply services is measured but it fails to link affordability with equitable distribution. In this research, the methodology adopted proposes to link affordability with equitable distribution. Furthermore, the linkage of affordability and equitable distribution with “environmental externalities” is mostly missing in the urban areas of developing countries. This research considers groundwater over- extraction as an environmental externality and has attempted to link these three areas in terms of water pricing.
This research uses the case of Kathmandu to construct a link between affordability, equitable distribution of water service, sustainability of water utilities and environmental externalities in various water sources in use. Kathmandu Upatyaka Khanepani Limited (KUKL) is the major agency responsible for providing the water supply services inside the Kathmandu Valley. However, in recent times it has not been able to cover the water demand and supply deficit from KUKL’s point of view is increasing day by day. Among the water demand of 370 million liters per day (MLD) KUKL is only able to supply 95-154 MLD. The Melamchi Water Supply Project (MWSP) is currently under construction inside the valley alleviate the water deficit. The water price of KUKL post-MWSP should be such that it could be affordable to the consumer and it should generate enough revenue to make KUKL financially sustainable.
Groundwater is a major alternative water source used to cover the deficit of water from KUKL. The groundwater price relative to that of KUKL affects priority of usage, and hence, the sustainability of groundwater resources. Therefore, taxation or subsidies on water sources become necessary based on their environmental implications. Kathmandu Valley Water Supply Management Board (KVWSMB), along with Groundwater Resource Development Board (GWRDB) are responsible for handling groundwater regulation. Furthermore, local governments inside the Kathmandu Valley such as Kathmandu Metropolitan City and Lalitupur Sub-metropolitan City are also capable of regulating water resources under the powers provided by constitution of Nepal and local governing acts. Water taxation and subsidies fall more under the jurisdiction of the local governing bodies but there is a possibility for duplication or ineffective regulations due to the various institutions in the same area working under the different layers of government. Hence it becomes imperative that institutional challenges and solutions are also discussed while discussing the sustainability of water resources.
In order to promote affordable, equitable, and sustainable water supply, this research has proposed a method to set the piped water price inside the Kathmandu Valley. This methodology can be a unique way to identify urban water pricing requirements and can also be used as an indicator to know whether affordability, equitability, and utility sustainability can be achieved at the established price level. The expenditure Ratio (ER) of households in terms of water expenditure (WE) and total expenditure (TE) of
2
households has been taken as the indicator of affordability. The standard deviation of ER among the various service areas are taken as the indicator of equitability and utility sustainability was measured as the ratio of operation and maintenance costs to total revenue of the utility company (working ratio: [WR]). In the case of the Kathmandu Valley, domestic water use and expenditure data were obtained from a survey of 1500 households. Post- MWSP water use and WE scenarios were developed based upon per capita water use and water price. The expenditure for piped water service and alternate water sources were taken into account to calculate the total water expenditure.
The other aspect of this research is to link environmental externalities to water price and water taxation or subsidies, depending upon the source’s contribution to groundwater sustainability and KUKL’s water price has been chosen as the indicator. In this study, we evaluate volumetric water price, including initial investment and operation and maintenance (O&M) costs for different water sources, and compare it with the water price of KUKL, Kathmandu. Institutions health was measured from Water Institution Health Index (WIHI) developed by Dinar and Saleth, 2005. Interviews were conducted with key stakeholders in order to gain deeper insight into the challenges and solutions for the measures to be adopted in water pricing.
The results show that an increase in water price of approximately (30-50) % over the current price is necessary to meet O&M costs, assuming the WR to be 0.7. A minimum of 80 liters per capita per day (LPCD) should be provided from KUKL post-MWSP for utility sustainability. However, water use of 135LPCD increases the ER more than 1%, the threshold of water affordability and may cause groundwater stress. Shallow groundwater is cheaper than KUKL’s water and for groundwater sustainability, taxation on shallow groundwater seems necessary. For the recent water use of 97 LPCD the taxation requirement is NRs1 . 320/month (0.35% of total expenditure) if the initial investment for well construction and O&M cost are considered, and NRs. 626/month (0.7% of total expenditure) if only O&M cost is considered. On the other hand, rainwater harvesting and recharging, the measures to cope with groundwater exploitation, might require a 40% to 50% subsidy for their initial investment.
Institutional co-ordination seems critical as WTFC decides KUKL’s water tariff, whereas KVWSMB decides the taxation on groundwater. On the other hand, subsidies and mandatory policies on rainwater harvesting and recharge can only be adopted by the support of local governments, and recent improvements in distribution lines comes from MWSP. Thus, the coordination between these entities seems necessary for the sustainability of both surface and groundwater resources in the Kathmandu Valley.
3 Background
1.1. Balance between water as a right and water as an economic good.
There is a debate all over the world as to whether water should be considered as an economic commodity or it should be seen from a human right’s perspective. The UN Sustainable Development Goals(SDG) talked about water being accessible to all and the basic right of water supply and sanitation to everyone. On the other hand, since water is a fixed commodity and needs to be handled such that the resource is able to be conserved, its affordability and exact pricing also becomes critical. The term “water right” can be defined as the right to access “sufficient” water, with the term “access” also encompassing “economic affordability” (Scanlon et al., 2006). The basic water requirement pointed out by World Health Organization (WHO) is 50 Liter per capita per day (LPCD) (Howard and Bartram, 2003) and from this basic point of view, it should be affordable to everyone. However, from an emergency point of view the Sphere standards point out that user should be able to get 2.5-3 LPCD for survival needs (drinking and cooking), 2-6 LPCD for basic hygiene practices and 3-6 LPCD for cooking making total of 7.5-15 LPCD even in emergency conditions as a human right (The sphere handbook,2018). It is still a debate over how much water should be enough as a human right and from what point water should be treated as a commodity.
1.2. Fundamentals of Water pricing
Rogers et al., (2002) states water pricing should include all costs associated with water, from project construction to all the externalities caused by the water services. The price of water should encompass the following characteristics.
a) It should generate sufficient revenue. The general term sufficient revenue refers to the operation and maintenance cost of the utilities along with the contingency funds, which could be used during utilities crisis. In most cases, the operator has the responsibility to pay the initial capital investment back to the investors. This should also be included in the sufficient revenue.
b) It should promote resource conservation. Water pricing should be structured in such a way that it helps water resource conservation. Water use of the consumers, socio-economic status of the area, temperature, and other parameters are critical in structuring the water pricing system, which allows for resource conservations.
4
be too complex and easily understandable to consumers so that they can decide the amount of payment depending upon their necessities.
d) It should be affordable from consumer’s point of view. The affordability for a consumer is very critical since inside the utilities service areas, the consumers have varying incomes. Further, affordability should be linked with water use behavior and willingness to pay. (Rogers et al., 2002)
As illustrated in figure 1, according to Rogers et al. (2002) water price should include different cost portions in its price.
a) Operation and maintenance costs: The cost required for the utility to run sustainably.
b) Capital investment costs: The initial investment costs such as conveyance, reservoirs, intakes etc.; the sum of capital investment costs and operation and maintenance costs are termed as “full supply cost”
c) Opportunity cost: The cost of other uses, which are deprived using this water service and hence forced to use alternative options; the opportunity cost will be zero if there is no alternate use of the water source.
d) Economic externalities: externalities in the economic system due to the construction, such as damages to irrigated areas or issues in other constructions etc.; the sum of “full supply cost”, opportunity cost and economic externalities is termed as “economic cost” of water.
e) Environmental externalities: Environmental externalities mostly
associated with public health and ecosystem maintenance; the inclusion of environmental externalities in the “economic cost” of water is the actual full cost of water, and water pricing should be able to include all these factors.
5
1.3. Water expenditure ratio for consumers and working ratio for the utilities
The water expenditure ratio(ER) is an indicator used to measure the affordability to the consumer and reflects the ability of the consumer to spend on water services. While the ratio varies globally the utility provider should ensure that ER should not be too high because that would imply that people are spending too much in water.
Similarly, working ratio (WR) is a term used as an indicator to measure the efficiency of utilities. It also indicates whether the utility can be sustainable in long term. It is the ratio between operation and maintenance costs and utilities revenue. The World Bank has collected Expenditure ratio and Working ratio of different utilities globally (Baietti et al., 2006) shown in table 1.
Table 1: Global ER and WR of different water utilities
SN Utility Name (Expenditure in
water/income) in per capita % Working ratio(O&M/Revenue) in % 1 Aqua, Poland 0.26% 36% 2 HPWSC, Vietnam 0.50% 62% 3 JNB, South Africa 0.33% 53% 4 NWSC, Uganda 2.00% 79%
5 ONEA, Burkina Faso 3.31% 66%
6 PUB, Singapore 0.04% 58% 7 PWD,USA 0.06% 67% 8 SANASA, Brazil 0.11% 79% 9 Scottish Water, UK 0.08% 52% 10 SIMPAG, Mexico 0.07% 77% 11 Sonese, Tunisia 0.25% 98%
Average assuming 70% of the income is attributed to expenditures
ER ≈ 1% WR ≈ 70%
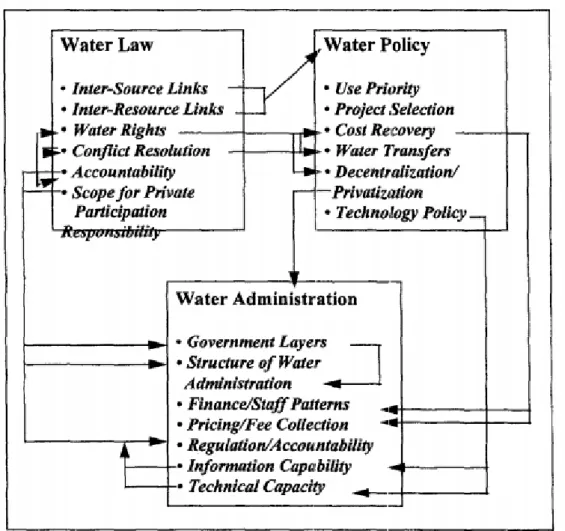
1.4. Water institutions and their indexes
Water resource sustainability highly depends upon the water-related institutions in place. The institutions should be able to create proper linkages between water law, water policy, and water administration. Figure 2 shows the indicators constituted under water law, policy, and administration.
6
Figure 2 Water institutions, illustrative inter-linkages, evaluating water sector and sector performance adapted from Saleth and Dinar, (1999)
7 Problem statement
The Dublin water principles claim water as an economic good and illustrate the importance of water pricing for the sustainability of water services (Rogers and Huber, 1998). The “ natural monopoly” of the market for water services has long been discussed, where the distribution is managed by a single authority (Rees, 1998). The environmental aspects of the water market are less widely discussed in the calculation of water price. Rogers et al.(2002) emphasize that the cost of environmental externalities also needs to be included while calculating the water price so that environmental sustainability can be achieved. However, the water market functions differently when consumers have different choices including informal competitors such as ground water and vendors. Pricing policies need to consider these informal competitors as well. Furthermore, Kilimani et al. (2015) assert that the water pricing policy will be sustainable only if pricing and regulatory institutions function properly. Consumer behavior also plays an important role in addressing pricing issues as affordability is one of the main parameters for fixing the water price (Ojha et al., 2018).However, the measurement of environmental externality costs and the enforcement through taxation and subsidies to provide competitive advantages to utility companies and the environment have not been adequately discussed in the literature. The focus on consumer welfare, while fixing the environmental externality cost is a critical issue. Therefore, in urban areas, sustainable water pricing policy that combines appropriate pricing and regulatory interventions, and utilities’ real-time knowledge of consumers’ behaviors can be a tool for maintaining water resource sustainability.
The method of water pricing plays a crucial role in maintaining affordability (Savenije and Van Der Zaag, 2002). The privatized water sector may increase efficiency in service delivery; however, its impacts on equity are yet to be understood. Accessibility of water services to all people and equitable distribution of water, along with the cost recovery of capital investments in cities such as Cape Town (South Africa) and Jerusalem (Israel), etc., show that there are challenges to setting the water price in urban areas (Dahan and Nisan, 2007; Smith and Hanson, 2003). Evidence shows that in most cities of developing countries, informal markets hold approximately half the share of water supply (World Bank, 1999). This demonstrates that water utilities should consider the alternate water market when fixing the water price, as the urban water market is full of competitors. On the other hand, proper pricing, along with improvement in water use and management, can solve the water crisis and alleviate the economic and environmental consequences(Dinar and Saleth,
8
2005).
Kathmandu suffers from the aforementioned problems with respect to its institutions, consumers and utility companies. The methodology developed to test and cope with the problems will not only help restore Kathmandu’s groundwater resource sustainability, but also help other urban developing cities in developing the framework regarding water resource sustainability. This research aims to develop such methodology on those fronts.
9 Objective and scope
The objective of this research is to test the water resource sustainability inside the Kathmandu Valley from the perspective of the consumer, utility company, water institutions, and groundwater environment and to develop a method to measure the sustainability according to the aforementioned aspects.
3.1.Specific objectives
To develop the methodology to establish a sustainable scenario
between consumer affordability and utilities’ sustainability
To use the methodology to find out the appropriate water price
of KUKL (utility) which can balance the consumer affordability and operational sustainability
To develop the methodology for determining groundwater
externality costs and assessing the impact on water taxation or subsidies
To use the methodology for determining the appropriate
amount of taxation on groundwater and subsidies on rainwater to address the cost of environmental externalities inside Kathmandu Valley
To identify the challenges inside the water institutions relating
to the implementation of the pricing policies and water taxation or subsidies
To recommend the applied framework for urban areas of
developing countries where multiple water options are available as an informal market.
3.2.Scope of the study:
This study deals with the calculations related with the expenditure ratio (ER) of households inside the Kathmandu Valley and working ratio (WR) of KUKL. It also shows the water resource pricing related challenges through the key stakeholders’ survey. In addition, this study proposes taxation and subsidy models and provides the way forward to implement such models. Furthermore, it notes the required data sets that could be used for urban areas facing the issue of water scarcity with multiple water options available that want to maintain the balance between these indicators for sustainable water supply services.
10 3.3. Organization and dissertation
The conceptual diagram used to understand the water management perspective in the area of study and the organization of the dissertation is shown in figure 3.
Introduction
General background regarding water rights and water as an economic good, fundamentals of water pricing, expenditure ratio of consumers and working ratio of the utilities, water institutions and their indexes
Chapter-1
Chapter-2
Material and Methods Research Framework
Calculation of expenditure ratio of consumers, working ratio of
the utilities, taxation and
subsidies in different water
sources, identification of
institutional challenges in water pricing
Study Area
Location Demography Water supply and
demand scenario Socioeconomic
Water price analysis in terms of ER and WR
Assessment of ER and WR of each service areas of KUKL in different scenarios and identification of appropriate price and scenario.
Chapter-3
Water tax and subsidy analysis
Assessment of volumetric cost of water from different sources including initial investment, operation and maintenance costs and water tax and subsidies, depending upon environmental externalities caused
Chapter-4
Challenges in water pricing
Qualitative results of challenges in water pricing Chapter-5
11
Figure 3 Chapter divisions Conclusion and recommendation
All the findings of the study and recommendation based on the findings.
12 Material and methods
4.1.Study Area
4.1.1. Water institutions inside Kathmandu Valley:
Kathmandu Upatyaka Khanepani Limited (KUKL) has the authority to operate and maintain water supply services(KUKL, 2015), and the Kathmandu Valley Water Supply Management Board (KVWSMB) is the asset owner that also has the authority to license and regulate deep ground water and water from the vendors(KVWSMB, 2014). KVWSMB’s authority over water service structure; monitoring of the water service from the vendors; and recharging, licensure, and regulation of ground water services is governed through the Water Supply Management Board Act regulations and guidelines. KUKL’s proposal for price rates is approved and regulated by an independent government entity, the Water Tariff Fixation Commission (WTFC)(KUKL, 2015), which operates under the Water Tariff Fixation Act and Water tariff fixation regulations. The water tariff inside KUKL’s service area is a progressive inclining blocks tariff (IBT) with two blocks. Groundwater Resource Development Board(GRDB), the Ministry of Environment(MoE) and Water and Energy Commission Secretariat(WECS) are also involved in groundwater management of Kathmandu valley.
The major cities inside Kathmandu Valley are Kathmandu Metropolitan city, Lalitpur Metropolitan city and other municipalities in Kathmandu, Bhaktapur and Lalitpur districts. Recently formed constitution has provided the provisions to make local governments accountable in handling and management of water resource inside the administrative boundaries.That is reflected in KUKL’s shares as well as the Kathmandu Metropolitan city is one of the major shareholders of KUKL. Similarly Valley board also have the representative from the local governing bodies.
KUKL currently has 10 service areas, depending upon population density and the distribution pipeline. However, after completion of the MWSP, the number of private connections will increase, and therefore KUKL is planning to increase the number of service areas to sixteen (Figure 1).
13
Figure 1. Study area showing KUKL’s planned water supply service area after
MWSP.
Service areas: Mahakalchaur(B-1), Kritipur(B-2), Maharajgunj(B-3), Bhaktapur(B-4), Madhyapur Thimi(B-5), Lalitpur(B-6),Kirtipur North(A-9), Balaju North(A-1), Bansbari North(A-2), Khumaltar North(A-8),Arubari North(A-5), Tigeni North(A-10), Mahakalchaur North (A-4), Anamnagar East(A-7), Minbhawan East (A-6), and Panipokhari East (A-3).
4.1.2. Socioeconomic
Kathmandu Valley is rapidly growing urbanized city. In this study, 2011 population data from census were taken as the base year and population for future periods were projected based on the projection rate estimated by CBS (CBS, 2014). The CBS data indicated 0.25 % decrease (foot hill and hills of valley) in some VDCs to 13.05 % increase (peripheral VDCs) in between 2001-2011. The population density at VDCs level is high in central part and it decreases as we move outwards. The people residing at central part are mainly engaged in business and job, whereas peri-urban areas and hills main occupation is agriculture. There is a marked difference between the high income and low income households inside Kathmandu Valley.
1.1. Data and source:
The data used during this research and their source are mentioned in Table 2
Table 2: Data sources
Description Source Remarks
Household related information Household survey conducted
by Shrestha et al.
Financial Data related with MWSP From various literature and
14
Population of KUKL service Area From Thapa et al.
Water institution health indicators and qualitative contents related with water institutions
From Key informant
interviews
4.2.Methodological Framework:
The overall methodlogical framework is shown in Figure 4
Figure 4 Overall methodological framework
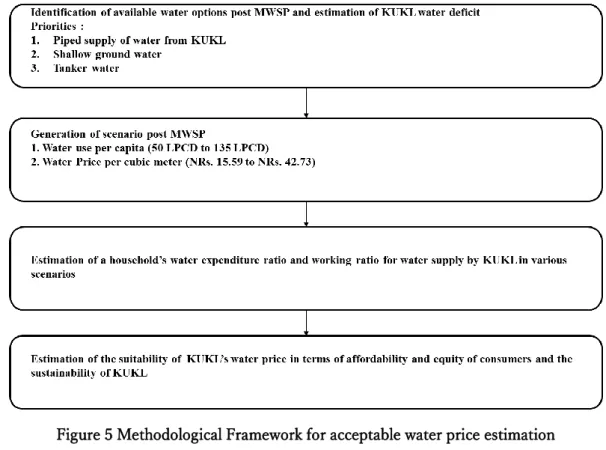
4.2.1. Methodological framework for acceptable water price estimation
The methodological framework for the study is shown in Figure 5. We considered piped water as the basic water source and groundwater and tanker water as alternate water sources. We assumed that piped water had first priority. Whereas, groundwater and tanker water were used only when total water use by households was greater than the available piped water supply in each KUKL water service area. Scenarios after the MWSP were generated in terms of household water use in liter per capita per day (LPCD) and water
15
price (NRs./CuM) in service areas. Water expenditure was calculated as the summation of money spent on piped water service and alternative water sources. Ratios of water expenditure to household total expenditure (Expenditure ratio: [ER]) were calculated as indices of affordability and equity. To ascertain the sustainability of the utility, the working ratio (WR), which is the ratio of operating cost to revenue was calculated. Based upon these estimates an acceptable plan for household water use and water price was developed, which can promote affordability and equity among the people in all service areas as well as utilities sustainability.
Figure 5 Methodological Framework for acceptable water price estimation 4.2.1.a Water use scenarios and estimation of water deficit
Some scenarios of water use after completion of the MWSP were assumed in order to evaluate the water deficit and use of alternative water sources. Per capita water use (WU) can change with the situation of the people, water accessibility and affordability. The minimum water use was set at current water use levels as the system is already under scarcity. However, water use inside some service areas such as Mahakalchaur, Arubari, Tigeni and Anamnagar is well below 50LPCD, the basic water supply level [20], which is considered as the minimum demand to maintain proper health and hygienic condition. Therefore, the minimum water use was assumed to be 50LPCD in these service areas. Conversely, the maximum water use scenario adopted is 135LPCD, which is designed per capita water demand of MWSP [17].Several scenarios were created between maximum and minimum water use, in which current water use was chosen when the current values were larger than the scenario value.
The deficit was calculated as the difference between water supply and water use in each service area using the following equations.
16
Di = WU * Pi (Eq.2)
Where, Ski is water supplied by KUKL for service area i (CuM/day)
Di is water use of service area i (CuM/day)
WU is per capita water use of service area i (CuM/person/day) Pi is projected population of service area i (persons)
The deficit is covered by ground water and tanker water. Ground water is not accessible in all areas. The ratio of ground water use to total alternative water was assumed to be the same as the ground water accessibility factor (ratio of ground water using household to total household) of the service area.
4.2.2.b Index of utility sustainability, consumer’s affordability and equity
As an indicator of sustainability of water supply by utilities, we used the WR, which is the ratio of operating cost (O) over revenue (R). A WR equals to 0.7 was assumed for a breakeven point in KUKL’s financial sustainability. For sustainable operations we assumed that WR should be less than 0.7, which is the average of various utilities globally available [21].
We assumed the current water price (NRs.15.59/CuM) to be minimum volumetric water price after completion of MWSP. Whereas the proposed price in the proposal[19] is more than two times the current price (NRs.42.73/CuM) and was assumed as the maximum water price. However, it is very likely that price of water will be somewhere between these two prices. As an indicator of the sustainability of water supply from utilities, we used the WR. Operating expenses (O) after MWSP completion were adopted from the projection by Asian Development Bank (ADB)[22] of 1.42 billion NRs. per year.
For the indices of affordability and equity, we calculated the ER of household in each service area. Total water expenditure, the summation of household expenditure on piped water supply by KUKL and alternative water supply, is calculated using equation 3 through 8:
ERi=WETEi
i (Eq.3)
WEi=KWEi+AWEi (Eq.4)
KWEi=HHSki * Tk (Eq.5)
HHSki = (Ski * 30) /(Ni) (Eq.6)
Ni= Pi/(HH)i (Eq.7)
AWEi= 0 (if Ski≥Di) = (Di-Ski) * 30/Ni. [Tg * Fgi+(1- Fgi) *Tta] ( if Ski<Di) (Eq.8)
Where, ERi is Expenditure ratio of service area i (%)
WEi is water expenditure in Service area i (NRs./HH/Month)
TEi is total expenditure in service area i (NRs./HH/Month)
KWEi is KUKL’s portion of water expenditure in service area i (NRs./HH/Month)
AWEi is Alternative water supply’s portion of water expenditure in service area i (NRs./HH/Month)
HHSki is water Supplied by KUKL per household for service area i (CuM/month) Tk is water price of KUKL (NRs./CuM)
17
Tta is Unit cost of tanker water (NRs.264.12/CuM) [19] Fgi is groundwater accessibility factor [-]
Ni is number of households in service area i
HHi is household size
Water expenditure ratio (ERi) of the particular service area i is defined as the ratio of money spent on water by household of service area i (WEi) to total expenditure (TEi) as indicated in Equation 3. WEi is the summation of a household’s expenditure on piped water supply from KUKL (KWEi) and the alternative water supply (AWEi) as indicated in Equation 4 and can be calculated from Equation 5 through 8.
To ensure affordability we assumed that the service area average of ER over the service areas should be below 1%, which is global average of ER available in Baietti et. al.’s report [21]. Regarding equity, we also assumed that the standard deviation among service areas should be less than 1%. For each scenario of water use varying from 50LPCD to 135LPCD, acceptable water price was estimated on the basis of the criteria of utility sustainability, water affordability and equity described above.
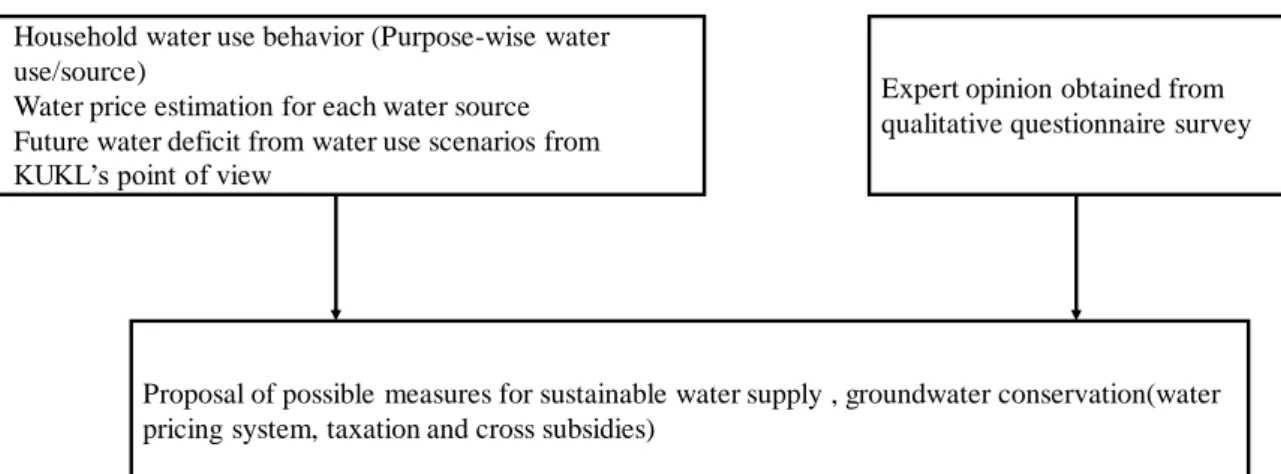
4.2.2. Methodological framework for taxation and subsidies calculation
Figure 6 presents the methodological framework for this research. The types of water sources for each purpose of water use identified inside Kathmandu Valley were drinking, cooking, cleaning etc. Specific sources for specific water use were determined through the percentage of people using the source for that specific water use purpose, where 70% was used as the threshold value for that purpose. The volumetric cost analysis was performed to compare water prices from different water sources. The supply and demand deficit of KUKL was calculated based on projected population with varying water demands to know the effect of water use during deficit. Key informant interviews were conducted to understand the possible institutional mechanism required for efficient measures regarding water resources conservation, taxation and subsidies. Based on the results of the analysis, possible taxation and subsidies were identified.
Figure 6 Methodological framework for taxation and subsidy analysis 4.2.2.a Analysis of household’s water use
Household water use behavior (Purpose-wise water use/source)
Water price estimation for each water source Future water deficit from water use scenarios from
KUKL’s point of view
Expert opinion obtained from qualitative questionnaire survey
Proposal of possible measures for sustainable water supply , groundwater conservation(water pricing system, taxation and cross subsidies)
18
The purpose-wise water use (volume per day per household) based on consumers’ water diary for five days and purpose of each type of water (piped water, well water, jar water, tanker water, etc.) were analyzed to clarify people’s consumption behavior and preference of water source for a particular purpose from the results of a questionnaire survey. The details of the survey followed in this study are described in Shrestha et. al. (Shrestha et al., 2016) .
4.2.2.b Water Price Calculation
The monthly water price for each water source for different water consumption scenarios per capita (LPCD) was estimated assuming 10 people in a house. The pipe water price was calculated based on the present tariff system (KUKL, 2015), which is an increasing block tariff with NRs. 100 for the first 10 cubic meter (CuM) and NRs. 32 per cubic meter after 10 CuM. For shallow groundwater, the volumetric water price (NRs./CuM) was calculated based on the cost of initial investment and operation and maintenance (O&M) as shown in equation (1).
VWP = VWPI +VWPo (Eq.9)
VWPI = I*CRF/V (Eq.10)
CRF = r*(1+r)n / [(1+r(n-1)] (Eq.11)
VWPo= (Pp*CRFp)/V+ O*Pe*T (Eq.12)
where, VWP is Total Volumetric water cost (NRs./CuM),which is the summation of VWPi and VWPo2. I is the initial investment required for construction (NRs.); CRF is the
capital recovery factor; V is the volumetric water consumption for 10 people per year (CuM); r is the inflation rate (%); n is the life of a well (years); and Pp is a pump’s price (NRs.). Because the life of a pump and that of a well are different, their capital recovery factor are also different. Hence, CRFp is the capital recovery factor for pump; O is the operational power requirement (kW); Pe is the price of electricity (NRs. 12/kWH) and T is the pumping period (hrs/CuM)
Table 1 summarizes the basic data used for calculation. After consulting with KVWSMB’s officials, we assumed that r is 10% and n is 20 years, then CRF becomes 0.12. The volumetric O&M cost was composed of the purchasing cost of pump and electricity cost required for pumping water. A pump’s portion of volumetric water price was calculated using the same method as that of a well’s portion, which is shown in equation (4). CRFp is 0.16, as we assumed the life of a pump to be 10 years.
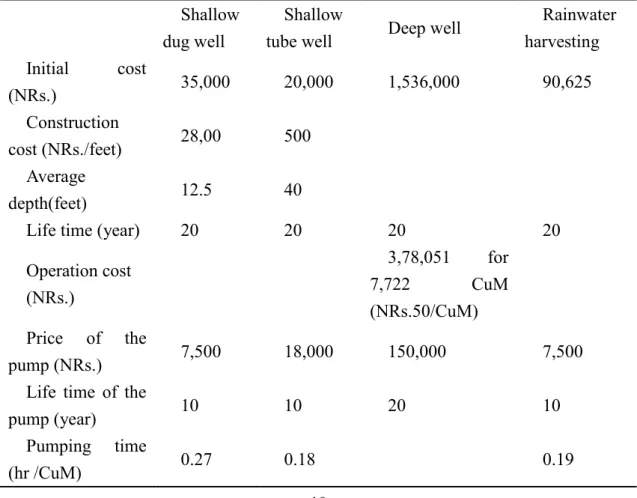
The data required for initial investment and O&M of shallow dug well and shallow tube well were obtained from KVWSMB’s officials. The initial investment cost required for construction was calculated using the depth (12.5 ft for dug well and 40 ft for tube well) and per running meter cost requirement during the construction (NRs. 2,800/ft for dug well and NRs. 500/ft for tube well). The cost of the pump was NRs. 7,500 for a dug well and NRs. 18,000 for a tube well.
The initial investment cost for a deep tube well was obtained from KVWSMB’s officials. Initial investment includes NRs. 1,536,000 for the construction of a well, and NRs. 150,000 for a three- horsepower pump. The yearly O&M cost (NRs. 378,051) and
2 Where, VWPI is volumetric initial investment cost (NRs./CuM) and VWPo is volumetric O&M
19
the yearly volume of water production (7,722 CuM) was adopted from Yoden.et.al. (Yoden and Chhetry, 2010).
Rainwater cost was calculated by conducting a survey questionnaire with 16 key respondents involved in rainwater harvesting projects inside Kathmandu Valley. The survey included questions about the initial cost of rainwater systems and the amount of water production, etc. This survey only included the system for direct consumption of rainwater and not for groundwater recharge. The average initial cost (NRs. 90,625) and the amount of production per month (1.44 CuM) from all respondents were used for calculation. The O&M cost of rainwater harvesting system was calculated from the O&M cost of a shallow dug well. For a shallow dug well the cost of electricity depends on the building height and depth of the dug well, whereas the electricity cost for rainwater harvesting was calculated by assuming that the pumping height is only the building height (Equation [5]) and that rainwater is stored in a tank on the ground and pumped up to the roof for use.
VWPo= Pp*CRFp/V +O*Pe*T*(Bh)/(Bh+D) (Eq.13)
where, Bh is the average building height (30 ft) and D is the average depth of a shallow dug well (12.5 ft) .
Tanker water price (NRs. 264/CuM) was calculated from the KUKL’s proposal for water price to WTFC(KUKL, 2013), whereas, jar water price was set as (NRs. 5,000/CuM), which was obtained during the interview with KVWSMB’s officials. The total expenditure was taken from the household questionnaire mentioned above.
Table 3 Data summary for water taxation and subsidy analysis
Shallow dug well
Shallow
tube well Deep well
Rainwater harvesting Initial cost (NRs.) 35,000 20,000 1,536,000 90,625 Construction cost (NRs./feet) 28,00 500 Average depth(feet) 12.5 40
Life time (year) 20 20 20 20
Operation cost (NRs.) 3,78,051 for 7,722 CuM (NRs.50/CuM) Price of the pump (NRs.) 7,500 18,000 150,000 7,500
Life time of the
pump (year) 10 10 20 10
Pumping time
20
Operational power of the pump (KW)
1.12 0.75 1.12
1 US dollar = 116.82 NRs. (9th November 2018 conversion rate) 4.2.2.c Water supply and demand analysis
The present and future water demand of KUKL and other water sources were calculated from the 2011 base population from the Central Bureau of Statistics (CBS), and the annual growth of different areas of Kathmandu was estimated based on the space availability for residence according to the method suggested by Thapa et al. (Thapa et al., 2018). Considering various demand scenarios, KUKL’s water deficit was calculated to assess the possible impact on groundwater environment.
4.2.2.d Identifying the water pricing challenges:
A qualitative questionnaire survey including oral interviews was performed among 21 key informants from 12 key institutions such as KUKL, MWSP,Project Implementation Directorate(PID), Ministry of Water Supply and Sanitation (MoWSS),Water and Energy Commission Secretariat (WECS), and Lalitpur and Kathmandu metro-politan cities, to understand the current scenario of water resource inside Kathmandu Valley especially financial regulations. The key informants were selected based on “Tremblay’s characteristics of ideal key informant”, which suggests that the ideal key informant should have a role in the concerned community and should have knowledge, willingness, communicability and impartiality toward the interviewed subject (Marshall, 1996). Thus, officials working on key managerial posts especially among the top three posts were selected to satisfy the characteristics and more attention was given to select the informants with greater diversity (Marshall, 1996). The interview has covered most of the institutions directly related with water resource inside Kathmandu Valley. The content was analyzed and synthesized for the analysis following Zhang and Wildermouth(Zhang and Wildemuth, 2016), where the oral interview was recorded and later written in text form. A single theme on a particular subject from a unique respondent was considered as the unit of coding. Themes were developed by inductive analysis of the information provided by the respondents. Of several themes such as the legal aspects of water resource, water quality standards, local governments’ impact on water resources, private sector participation, water tariff and regulation, equitable distribution of water resources, the responses to “water tariff and regulation” has been used for this study.
4.2.2.e Estimation of groundwater taxation
Groundwater, if cheaper than KUKL’s piped supply, has the chance to be the first choice of consumers for most of the domestic purposes. However, it is not favorable from the viewpoint of utility as well as environment. To limit the use of groundwater, groundwater tax was estimated in a way that makes the groundwater cost equal to KUKL water for each water use scenario. It was assumed that people will consume KUKL’s first block of water, and thus the required tax was assigned as the difference between water price of KUKL’s second block and other water sources.
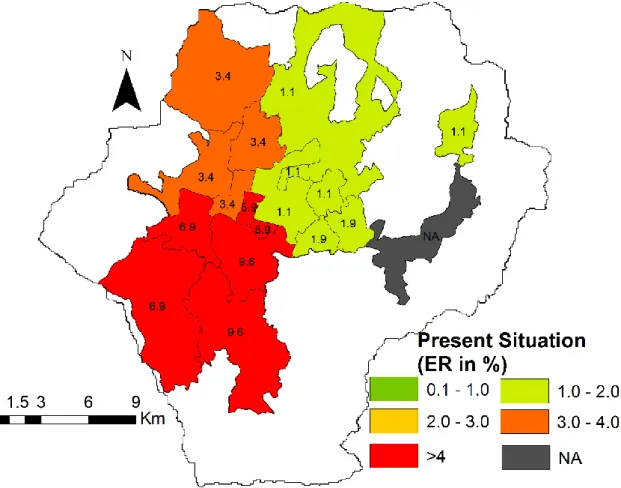
21 Water price analysis based on ER and WR 5.1. Expenditure ratio before MWSP
The recent ER was calculated on the basis of water expenditure and total expenditure obtained during the questionnaire survey for each service areas and was plotted spatially (Figure 7) to show the difference in ER inside Kathmandu Valley. It shows there was a marked difference among the service areas, ranging from approximately 1% in the Mahakalchaur(B-1) and Arubari North(A-5) service area to more than 9% in the Lalitpur (B-6) service area. The average ER currently was 3.9% and standard deviation between the service areas was 2.8%.
Figure 7 Current ER in various service areas of Kathmandu 5.2.Water supply and demand after MWSP
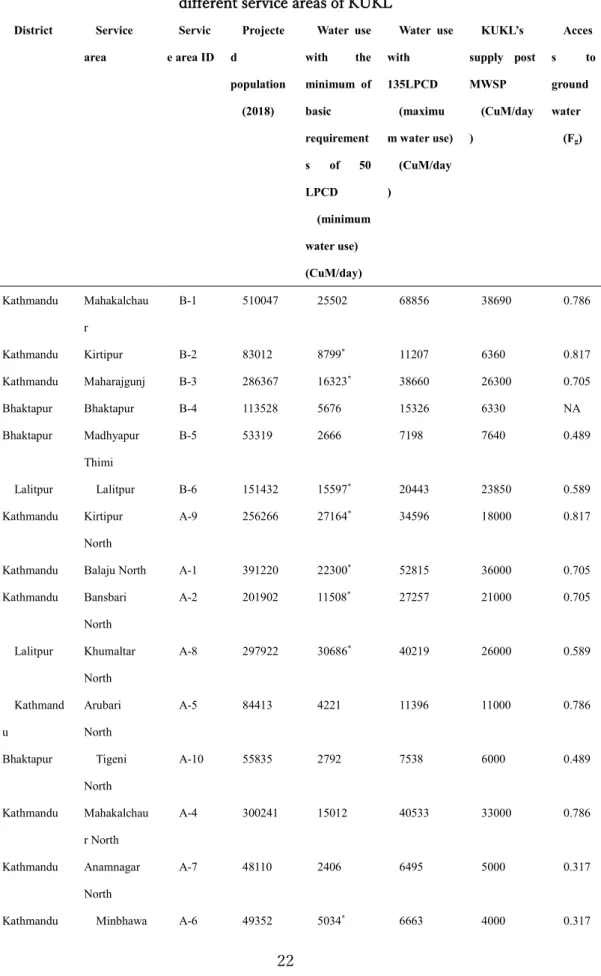
Table 4 shows projected population, water use in minimum and maximum scenarios, water supply by KUKL and the groundwater accessibility factor for each service area. The minimum water use scenario that is close to the current water use is about 200,000 CuM/day whereas the supply post MWSP will be approximately 279,000 CuM/day. The minimum water use scenario suggested water produced from KUKL will not be fully utilized if consumer’s water use behavior does not change. Similarly, 135LPCD (the maximum water use scenario) could not be achieved from KUKL alone because of water scarcity as the use will reach more than 400,000 CuM/day. Approximately 30% of water use can be increased on average post MWSP for the supply to completely utilized.
22
Table 4 Water use, proposed supply and groundwater accessibility post-MWSP in different service areas of KUKL
District Service area Servic e area ID Projecte d population (2018) Water use with the minimum of basic requirement s of 50 LPCD (minimum water use) (CuM/day) Water use with 135LPCD (maximu m water use) (CuM/day ) KUKL’s supply post MWSP (CuM/day ) Acces s to ground water (Fg) Kathmandu Mahakalchau r B-1 510047 25502 68856 38690 0.786 Kathmandu Kirtipur B-2 83012 8799* 11207 6360 0.817 Kathmandu Maharajgunj B-3 286367 16323* 38660 26300 0.705 Bhaktapur Bhaktapur B-4 113528 5676 15326 6330 NA Bhaktapur Madhyapur Thimi B-5 53319 2666 7198 7640 0.489 Lalitpur Lalitpur B-6 151432 15597* 20443 23850 0.589 Kathmandu Kirtipur North A-9 256266 27164* 34596 18000 0.817
Kathmandu Balaju North A-1 391220 22300* 52815 36000 0.705
Kathmandu Bansbari North A-2 201902 11508* 27257 21000 0.705 Lalitpur Khumaltar North A-8 297922 30686* 40219 26000 0.589 Kathmand u Arubari North A-5 84413 4221 11396 11000 0.786 Bhaktapur Tigeni North A-10 55835 2792 7538 6000 0.489 Kathmandu Mahakalchau r North A-4 300241 15012 40533 33000 0.786 Kathmandu Anamnagar North A-7 48110 2406 6495 5000 0.317
23 n East Kathmandu Panipokhari East A-3 98358 5600* 13278 10000 0.705 Total 2981324 201293 402479 279170
*Service areas with minimum water use > 50LPCD because current water use > 50LPCD
5.3.Expenditure ratio and working ratio after the MWSP
ER was plotted against the KUKL water price for different water use scenarios. ER would increase with an increase in KUKL’s water price and household water use. For scenarios of water use greater than 100 LPCD, ER >1% in all water price; hence, they were excluded in the further analysis. In the lower range of water use, a wider range in KUKL’s water price was acceptable in terms of water affordability. Maximum affordable water price (ER=1%) was found to be NRs.37/CuM, NRs.35/CuM, NRs.32/CuM, NRs.29/CuM ,NRs.26/CuM and NRs. 22/CuM for 50, 60, 70, 80, 90 and 100 LPCD respectively. (Figure 4). The standard deviation between the service areas was also calculated to measure the equitable distribution and in all cases, it was below 1% satisfying the equity among the service areas.
Figure 8 Comparison of average expenditure ratio with water price at various minimum water use scenarios
The WR was plotted against water price against the water price in various minimum water use scenarios to check the KUKL’s sustainability. The condition of WR < 0.7 can be satisfied in higher than NRs. 30/CuM, NRs.28/CuM, NRs.25/CuM, NRs.24/CuM, NRs.22/CuM, NRs.22/CuM in 50, 60, 70, 80, 90 and 100 LPCD respectively. The acceptable ranges of water price based on Figure 8 and Figure 9 were shown in Figure 10 . The water price at the left end of the bars in Figure-6 corresponds to the threshold of utility sustainability and that at the right end represents the threshold of affordability. The range for 50 LPCD was between NRs.30- NRs.37/CuM satisfying both affordability and utilities sustainability conditions. Similarly both conditions for affordability and utilities sustainability were satisfied for the water price ranges of NRs. 28-NRs. 35/CuM, NRs. 25-NRs. 32/CuM, NRs. 24-NRs.29 /CuM, NRs.22-NRs.26 /CuM for 60, 70, 80, 90 LPCD
24
respectively. For 100 LPCD both (WR=0.7, ER=1%) conditions were satisfied in NRs. 22/CuM.
Figure 9 Comparison of working ratio with water price at various minimum water use scenarios
Among the satisfied results the minimum standard deviation could be obtained when (WR=0.7) for minimum water use of 100 LPCD and water price NRs.22/CuM.
Figure 10 ER, WR and standard deviation of threshold values and acceptable water price range which satisfy (WR<0.7, ER<1%)
However, for the scenarios of use greater than 80 LPCD, KUKL’s water would not be enough and there will be water deficit from utility in more than 80 LPCD scenarios. Hence, minimum standard deviation (0.47) was selected in 80LPCD as the most favorable scenario. Figure 11 shows the distribution of ER inside Kathmandu Valley for the water price NRs.24/CuM and water use of 80 LPCD.
25
Figure 11 Expenditure ratio in % at minimum water use = 80LPCD, water price = NRs.24/CuM
5.4. Factors affecting calculations based on ER and WR
This proposed methodology has focused on SDG indicators of affordability and equity. Willingness to pay has been identified as the fundamental indicator by which water prices are set in most countries and urban places. However, researchers have also argued that willingness to pay would not be suitable as the sole measure of the consumer’s affordability and water pricing(Polyzou et al., 2011; Whittington et al., 1991). Previously, coping costs were also analyzed inside Kathmandu Valley to measure spending behavior in water(Pattanayak et al., 2005). Coping costs however were not linked with utilities sustainability. In this situation analysis on the basis of ER and WR along with their optimization can be a unique way to determine the water price and water use and hence maintain affordability, equity and utilities sustainability. Furthermore, this method can be used in other urban areas to test affordability and equity where consumers are in varying income groups or where new water supply projects are being constructed.
In this research, average ER was used to measure affordability and standard deviation of ER between the service areas was used to measure equity in this paper. However, the Minbhawan (A-6) service area seemed to be expending more for water services in terms of its ER than other service areas. The markedly higher ER of Minbhawan service area compared with other service areas suggests the possibility of inequality even after the MWSP. The reallocation of KUKL’s water supply seems to be one of the options available to ensure basic water service and control water expenditure as well. It also
26
shows that along with ER and WR, there are other factors that have affected water price and water use as described below.
5.4.1. Household water use and effect of minimum volume in water price
KUKL has allotted minimum 10 CuM volume of water for one connection to set the minimum price(KUKL, 2015). In Kathmandu Valley, one building has one connection. The average number of people living in one building is 10, 7 and 6 in the Kathmandu, Lalitpur and Bhaktapur districts, respectively(CBS, 2014). Hence, to ensure equitable access to water for each household, the volume of minimum water requirement must be different for each district. If we assume 50LPCD is the basic requirement(Howard and Bartram, 2003), it would be approximately 15 CuM, 11 CuM and 10 CuM per building per month for Kathmandu, Lalitpur and Bhaktapur respectively. This means the first block of allotted water (10 CuM) will not be enough in Kathmandu and Lalitpur to maintain even the basic service level. Research shows the lower block are meant to provide the basic service to everyone(Dahan and Nisan, 2007). Therefore, to facilitate the basic service level, Kathmandu’s minimum per building allotment needs to increase by at least 50%, whereas in Lalitpur an increment of 10% would be enough. Similarly achieving the minimum use of 80 LPCD as the first block of KUKL should be able to satisfy the demand of approximately 24 CuM/month, 18CuM/month and 16CuM/month in Kathmandu ,Lalitpur and Bhaktapur respectively. This is higher than recent lower block of IBT inside Kathmandu Valley.
Although water price is not the sole contributor of sustainability to water resources, small changes in price can facilitate the sustainable and equitable distribution of water resources along with good monitoring of consumer’s behavior from the utility. This is especially relevant in developing countries, where the economic condition of and therefore water price must maximize the efficient allocation of this resource, bring the
sufficient revenue, produce net revenue stability and promote resource
conservation(Rogers et al., 2002). It is difficult to maintain equity through price alone from IBT as in the case of KUKL. Promoting equity consideration plays roles in IBT use with lower blocks being able to fulfill the basic demand(Dahan and Nisan, 2007). However, IBT fails to capture the spatial variation of basic demand per connection. Dahan and Nisan have argued IBT structure forces larger households to pay a higher average price for water. The methodology used in this article has identified the price in volumetric consumption. Spatial analysis of consumer’s water use behavior and the number of people per connection can help the utility to understand demand and manage the water price accordingly. Spatial variation in the lower block can counter the problem in equitable distribution.
5.4.2. Ground Water Accessibility
Ground water accessibility may decrease expenditure inequality, as the tanker water is more expensive than groundwater. People from Lalitpur and Khumaltar have a 9% ER in current conditions because of lack of access to ground water. Only 59% of the population has access to ground water in those service areas(Shrestha et al., 2016). On the other hand, in Tigeni despite of the alarming figure of 49% access to ground water services ER is well below 1% mainly due to less water consumption. Despite using less money, consumption below 50 LPCD is not suitable because people are living under water scarcity and vulnerable in terms of hygienic practices. Ground water consumption despite
27
being unsuitable from ground water environment’s perspective(Pandey et al., 2010; Pandey and Kazama, 2012) is helping to maintain the ER and hence affordability in Kathmandu’s case. However, in the long run when the MWSP ensures basic water demand, ground water needs to be regulated economically for proper demand management and to reach proposed scenario noted above.
It was difficult to measure the heterogeneous behavior of consumers inside the same service area, as the service areas are considered as lowest unit of measurement in this research. Additionally, for simplification of the equations, it was assumed that the household size and household per building would remain the same during the time span. Similarly, the capital recovery of MWSP has not been considered in the calculations of ER.
28
Water price comparison of multiple water sources 6.1. Future water deficit
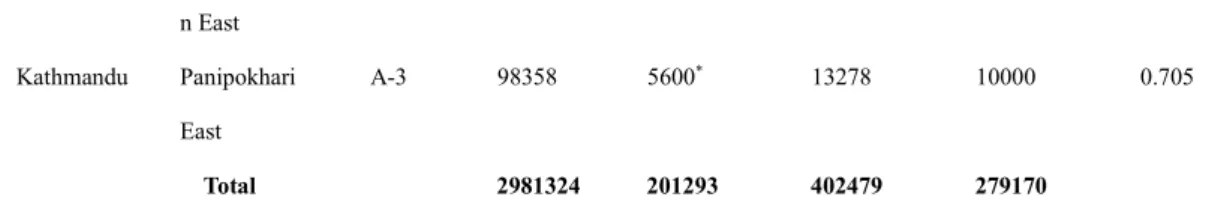
Future water deficit depends on water consumption pattern and population growth. The estimated population in 2018, 2023, and 2030 was found to be 3.44, 3.98, and 4.96 million respectively. The average water supplied by KUKL pre and post MWSP is approximately 109 MLD and 279 MLD, respectively. Figure 12 shows the possible water deficit after MWSP inside KUKL’s service area for some consumption scenarios. It shows that for water consumption scenario of 50 LPCD, there will not be any water deficit. The black straight line represents the present water deficit with 97 LPCD consumption. Note that 97 LPCD is the recent average consumption according to the survey mentioned in section 2.1. Figure 12 projects that water deficit will be lesser than now if water consumption is 80 LPCD or 97 LPCD; however, it might exceed the current deficit by 2023 and 2030 if the water consumption increases post-MWSP to 135 LPCD, which is the designed water consumption for MWSP. The dependency on groundwater might increase in this scenario even after the completion of MWSP. As pointed out, the groundwater inside Kathmandu Valley is already under stress due to over extraction(Pandey and Kazama, 2012), and a possible solution to overcome the deficit with environmental sustainability is the demand management of household water use or alternative water options such as rainwater.
Figure 12 Demand and supply deficit of KUKL water for various water consumption scenarios.
Because KUKL is unable to meet the full water demand, people are using multiple water sources, and the choice of water source has depended on the purpose of water use inside the valley. Table 5 shows the water source as per the purpose of water use based on the household questionnaire survey (Shrestha et al., 2016). People’s preference on Jar water and Piped water for drinking among the sources may be because of the water quality concerns of other sources.
Table 5 Water sources inside the valley and their use preferences.
0 50 100 150 200 250 300 350 400 450 50LPCD 80LPCD 97LPCD 135LPCD D e m a n d a n d s u p p ly d e ff ic it i n M L D
Water Consumption per capita
29
Source of water inside the valley
% of households using the source
Mostly used purposes (Number of households using water for certain purpose >70%)
Piped water 66% Drinking, cooking, bathing,
laundry Groundwater
(Shallow wells/Deep
wells)
52% Bathing, laundry, and cleaning
Rainwater 9% Not available
Jar water 71% Drinking
Tanker water 31% Bathing, laundry, and cleaning
6.2. Monthly water price and required tax for groundwater use
Figure 13 shows the monthly cost for water against the water consumption of KUKL piped water and shallow dug well and tube well water. The costs were calculated for 10 people in each house, an average adopted from CBS’s report (CBS, 2012). The brown line represents 1% of the total expenditure of the building with 10 people (NRs. 883), derived from the household questionnaire survey and is used as maximum water expenditure, which can be allowed to maintain affordability (Ojha et al., 2018). The water price of deep tube well water, jar water, tanker water, and rainwater are not presented in Figure 13 because they are much higher compared to other options. The prices for tanker water and jar water were NRs. 264/CuM, and NRs. 5000/CuM, respectively, which correspond to NRs. 792 and NRs. 15000 per month, respectively, for 10 LPCD scenario. The prices of rainwater harvesting and deep groundwater is NRs. 701/CuM for the water use of 1.44CuM/month, and NRs. 71/CuM for the water use of 643CuM/month, respectively. The price of rainwater harvesting cannot be compared with others because of its low production volume compared to other sources.
Regarding KUKL water cost, we assumed two types of increasing block tariffs (IBTs) in addition to the present system, depending on basic water requirement. There is a possibility of change in the first block of tariff system, depending on KUKL’s perception of basic water requirement. The present first block (10 CuM) corresponds to 33.33 LPCD for 10 people. Meanwhile, the amount of water corresponding to 50 LPCD, is the basic water requirement as per WHO guideline, which is 15 CuM. We assumed this value as water amount of the first block and with recent unit rate of first block of KUKL (NRs. 100/ 10 CuM), the flat tariff that was proportional with the first block amount was equivalent to NRs. 150. Ojha et al. (Ojha et al., 2018) recommended an increase in water bill by 30% for utility sustainability post- MWSP. Hence, the scenario after increasing the price by 30% in recent block was also analyzed. When both initial investment as well as O&M costs are considered, KUKL’s water price is lower than that of shallow dug well for low consumption. For the volume of the first block (33.33 LPCD), the present KUKL’s water price is NRs.100 per month. Meanwhile, the water prices for shallow dug well and shallow tube well are NRs. 480 per month and NRs. 450 per month, respectively.
30
However, the slope of the second block of KUKL’s tariff is steeper than that of the shallow dug well and tube well and the price is reversed after 80 LPCD. Furthermore, the O&M cost of shallow dug well and tube well is almost similar to KUKL’s first block tariff, and as the consumption increases the price gap between shallow dug well or tube well and KUKL increases. If the first block is increased to 50 LPCD (15CuM) and NRs. 150, people would receive basic water services at a cheaper price. However, KUKL will need to sell more water for sustainable operation in that scenario, and KUKL may not have enough amount of water to sell as can be seen in Figure 12.
Figure 13 Monthly water price of various sources per building depending on water consumption.
In case of the second type of IBTs (increase in water bill by 30%), the gap between KUKL’s second block tariff and groundwater price becomes greater with the 30% increase, as shown in Figure 13. There are two methods to improve the scenario, improving the KUKL’s pricing by making it efficient and introducing tax on groundwater use. Regarding the first method, one of the respondents has highlighted the issue of KUKL’s pricing and efficiency as follows:
“I think shallow groundwater has health related risks. KUKL’s water tariff should be as low as possible to keep it sustainable to compete with shallow groundwater. No one wants KUKL to make an excessive profit because it is a service-based institution. It has
0 200 400 600 800 1,000 1,200 1,400 1,600 0 20 40 60 80 100 120 140 160 M o n th ly W a te r p ri c e ( N R s .) Water consumption (LPCD) KUKL 30% increment
Shallow Dug-well with capital investment Shallow Tube-well with capital investment Shallow dug-well with operation and maintenance
Shallow Tube-well with operation and maintenance
KUKL recent KUKL 15 CuM 1% of total expenditure