西 南 交 通 大 学 学 报
第 56 卷 第 2 期
2021
年 4 月
JOURNAL OF SOUTHWEST JIAOTONG UNIVERSITY
Vol. 56 No. 2
Apr. 2021
ISSN: 0258-2724 DOI:10.35741/issn.0258-2724.56.2.43
Research article
Computer and Information Science
P
REDICTING
L
AND
U
SE
C
HANGES WITHIN THE
T
AZEKKA
P
ARK AND
I
TS
B
ORDERS VIA A
C
ELLULAR
A
UTOMATA
-M
ARKOV
M
ODELING OF
S
ATELLITE
I
MAGES
通过卫星图像的自动马尔可夫建模预测塔泽克卡公园及其边界内的
土地利用变化
Mohammed Zouiten, Jamal Chaaouan, Ibtissam Naoui
FPT – Laboratory : UH3D, USMBA
TAZA, Morocco, mohammеd.zouiten@usmbа.ac.ma,jamal.chаaouа[email protected],
ibtissam.nаoui@usmbа.ac.ma
Received: January 17, 2021 ▪ Review: March 9, 2021 ▪ Accepted: April 10, 2021 ▪ Published: April 30, 2021
This article is an open-access article distributed under the terms and conditions of the Creative Commons Attribution License (http://creativecommons.org/licenses/by/4.0)
Abstract
This article describes a new approach of land cover study to predicting and combatting deforestation based on satellite imagery as environmental statistics. Specifically, a stochastic mathematical cellular automata-Markov model was used to predict land-use changes in the Tazekka Park and its borders in TAZA province in Morocco. The model was used mainly to create thematic forecast maps. Through the proposed approach, we derived data and statistics covering the period 2000 to 2020 and then constructed a predictive map for the year 2040 using ArcGIS 10.4. The evaluation of our model’s effectiveness was confirmed by calculating the Markov transition matrix in the derivation of the final map. These results can improve the management of forest areas and serve as a reference in addressing the direct effects of forests on the environment.
Keywords: Remote Sensing, Geographic Information System, Modelling, Land Use, CA-Markov Model
摘要 本文介绍了一种新的土地覆被研究方法,该方法基于卫星图像作为环境统计数据来预测和防 治森林砍伐。具体而言,随机数学元胞自动机-马尔可夫模型用于预测塔泽卡公园及其摩洛哥塔扎 省边界的土地利用变化。该模型主要用于创建专题预测图。通过提出的方法,我们得出了 2000 年 至 2020 年的数据和统计数据,然后使用 ArcGIS 10.4 构建了 2040 年的预测地图。通过在最终地图 的推导中计算马尔可夫转移矩阵,可以确认对模型有效性的评估。这些结果可以改善森林面积的
管理,并为解决森林对环境的直接影响提供参考。
关键词: 遥感,地理信息系统,建模,土地利用,马可夫模型
I. I
NTRODUCTIONMany phenomena like erosion or forest fires are a permanent threat, a danger to the environment and humanity, examples of problems that we can predict. They can lead to the disappearance of biodiversity arteries. Studies of land uses maps can help researchers to preserve environment and predict dangers. Meanwhile, advancements in future satellite imaging play an important role in the prediction of land use changes [1] for planning and development processes [2], [3]. Such prediction provides many results and answers to policymakers and planners who are interested in knowing why and where land use changes have occurred [4] and who need to make decisions and launch development plans [6]. It also enables estimations regarding the future of spaces in case current environmental effects continue [5].
Our research's principal goal is to preserve TAZEKKA natural park using Markov chains analysis to generate a predictive land use map. Statistics on History data of the area are provided by LANDSAT satellite, and prediction of changes will help decision-makers preserve the environment as more as possible.
Our approach was to use mathematical and computer-based tools [7] in developing a predictive model for the generation of future thematic maps. We conducted spatio-temporal analysis on image data taken by the LANDSAT satellite. Our analysis covered 20 years of data and generated 20 years of forecast results for the Tazekka Parka and Bab Azhar in Morocco as well as its borders.
II. S
TUDYA
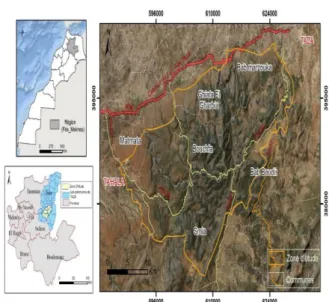
REAThe study area is located in the north of Morocco, within the heritage of the Fez-Meknes region. Topographically, it is located in the Middle Atlas, north to south of Taza (Figure 1). It is bounded by the Fez-Taza corridor to the north, by the Chikker pressure and JbelTimezwine to the east, by Tahala to the west, and by the Tiffratinejbel ridge to the south. Geographically, it is situated between the following coordinates: 33° 55’ 34°12’ N and 4° 14’ 4° 2’W. The area is connected to seven rural communes: Bab Boudir, Smiaa, Bouchfaa, Matmata, Ghiata el Gharbia, Bab Marzouka, and the Circle of Tahla. It also covers an area of 727.13 km².
Figure 1. Geographical map of the study area
A. Analysis of Markov Chains
The Markov model has been widely used in ecological modeling [10]. It takes past states into account in the prediction of how a particular variable changes over time [11]. The applicability of the Markov model to land use change modeling is promising because of its effectiveness in quantifying not only conversion states between land use types but also conversion rates between land use types [12]. A homogeneous Markov model for predicting land use change can be represented mathematically by the following equation:
L(t+h)=Pij*L(t) (1)
where the transition probability distribution can be represented by a matrix P, called the transition matrix for a continuous time chain L between t and t+h. Markov chains predict future land use patterns on the basis of observations regarding past developments and present states [10], [13], [24]. These transitions are subjected to non-spatialization as a characteristic approach under Markovian analysis. Accordingly, this model was expanded through the formulation of the cellular automata-Markov (CA-Markov) model to generate the predict map of TAZEKKA park land cover changes[11], [14].
B. Cellular Automata-Markov Model
CA-Markov is a powerful tool for describing and spatializing dynamic phenomena [11]. It enables the prediction of future states of a
phenomenon in accordance with the rules of transition from a previous state to a current one [5], [15]. A CA-Markov model combines cellular automata, a Markov chain, multi-criteria land, and multi-purpose allocation in predicting land cover change over time [16]. It expands the Markov model not only through spatial adjacency but also via probable spatial transitions occurring in a particular area over time [17]. Markov and CA-Markov modules in IDRISI Andes were used to create transition probability and transition zone matrices. A transition probability matrix is obtained by cross-tabulating two images of different epochs, and the matrix determines the probability that one pixel corresponding to one land use class will change into another class during a given period [18]. A transition zone matrix contains the number of pixels that are likely to move to another class of land use for a period of time [19]. Land use maps dated between 2000 and 2020 were used to create the probability matrix transition necessary to project land use for the year 2040. Instead of several other modeling approaches [20], [21], [22], [23], the Markov module in IDRISI Andes was used in the current work, and the proportional error was established for the creation of the matrix transition probability.
III. M
ETHODA. The Simplest Non-Trivial Cellular Automaton
The simplest non-trivial cellular automaton that we can conceive consists of a one-dimensional grid of cells that can take only two states ("0" or "1"), with a neighborhood made up, for each cell, of itself and the two cells adjacent to it.
Since each of the cells can take two states, there are 23 = 8 possible configurations (or
patterns) of such a neighborhood. For the cellular automaton to work, it is necessary to define what the state must be, in the next generation, of a cell for each of these reasons. There are 28 = 256
different ways of doing it, so 256 different cellular automata of this type.
The automata of this family are said to be “elementary”. They are often designated by an integer between 0 and 255, the binary representation of which is the sequence of states taken by the automaton on the successive patterns 111, 110, 101, etc.
As an example, consider the cellular automaton defined by the following table, which gives the rule of evolution:
Table 1.
Initial cellular automaton
Motif initial (t) Next valueof central cellule (t+1) 111 0 110 0 101 0 100 1 011 1 010 1 001 1 000 0
This means that if, for example, at a given time t, a cell is in state "1", its left neighbour is in state "1", and its right neighbour in state "0" (row 2 of the table), at time t + 1 it will be at state "0". If we start from an initial grid where all the cells are at state "0" except one, we end up with:
Figure 2. Example of simplest non-trivial cellular automaton
B. Methods/Materials
We used ArcGIS 10.4 program to perform the initialisation and conversion process to digital formats [8]. Regarding the prediction stage in the future, we opted for the IDRISI Selva program. This program is considered one of the best in space modelling [9]. Our proposed algorithm steps are then as follows:
1. Land use maps: 2000, 2020
2. Data conversion operations: VECTOR to RASTER to ASCII
3. Supply of Markov chains (transition probability matrix)
4. Application of CA-MARKOV
5. Simulation: 2040 simulated land use maps and validation
IV. R
ESULTS ANDD
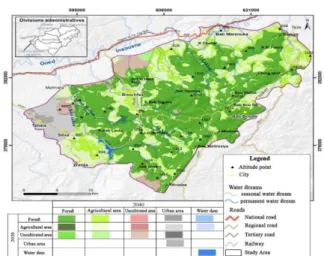
ISCUSSIONWe present here the land use trends between years 2000 and 2020. The land use maps are from Landsat Enhanced Thematic Mapper Plus (ETM+) and Operational Land Imager (OLI).
Figure 3. Land use map in 2000
Figure 4. Land use map in 2020
Table 2.
Evolution of the areas of land use classes between 2000 and 2020
2000 2020
Class Area (ha) % Area (ha) %
Water dam 81 0 258 0 Forest 45815 63 43918 60 Agricultural area 23100 32 25044 34 Uncultivated area 3391 5 3102 4 Urban area 332 0 389 1 Total 72718 100 72711 100
During this period, there was a trend (Table 2) of decreasing forest areas and uncultivated areas from 63% to 60% and 5% to 4%, respectively, and an increase in areas occupied by agricultural areas from 32% to 34%.
Table 3.
Average annual change in land use between 2000-2020
Class Annual average evolution (%)
Barrage 11% Forest -0.20% Agricultural area 0.42% Uncultivated area -0.42% Urban area 0.85%
Table 3 shows annual decreases of 0.20% and 0.42% for forest areas and waste areas, respectively. There is also an average annual increase of 11% in dam areas in the study area. This increase was at the expense of uncultivated areas. Also, the urban area increased by 0.85%.
The simulation results of this automatic model for land use are maps that correspond to a prediction of the state of land use in the future. The prediction for 2040 was based on the transition from 2000 to 2020. The result of the land use forecast for the year 2020 is shown in Figure 6.
Figure 5. Evolution of the areas of land use classes between (2000-2020-2040)
Figures 5 and 6 show that land cover for the year 2020 is like 2040 except for a few differences. This is confirmed by Table 4, which represents the transition probability matrix; the horizontal values indicate the changes for the year 2020, while the vertical values indicate the probability of change for the year 2000. When the values increase to 1, it indicates that there is a change, and vice versa.
Table 4.
Land-use transition probability matrix (Markov) 2040
Class Dam Forest Agricultural area Uncultivated area Urban area
Water dam 0.85 0.04 0.04 0.04 0.04 Forest 0.00 0.81 0.19 0.00 0.00 Agricultural area 0.00 0.00 0.85 0.00 0.15 Uncultivated area 0.13 0.01 0.08 0.78 0.00 Urban area 0.04 0.04 0.04 0.04 0.85
Figure 6. Simulated land use map for 2040
All varieties had a relatively constant probability of evolving to other varieties (Table 3). All percentages were higher than the probability of evolution in favor of other varieties except for the forest class, which showed a low rate of transmission stability at about 0.19 to the agricultural domain. Agricultural domain covered a total area of 30,575.7 ha for the simulated year, while in 2000 it recorded 23,099.7 ha. The area of the forests reached 35,535 ha for the simulated year, while in the year 2000 it recorded 45,814 ha.
Urban areas developed to the detriment of agricultural areas by 0.15. Their total area for the simulated year was 3600.14 ha, while in 2000 it was 331.61 ha. In comparison, uncultivated areas recorded a probability rate of 0.13; their surface reached 2610.93 ha for the simulated year, while the year 2000 recorded 3390.73 ha. The agricultural areas developed at the expense of the Bab Louta Dam.
In conclusion, major changes have taken place in the landscape over the past 20 years, thanks to:
▪ Increase in dam area
▪ Degradation of the forest ecosystem by forest fires and pastures
The most frequently reported offenses were: ▪ Overgrazing: 26.5% of the total number of verbal trials established, with 669 verbal trials during the period 1998–2014.
▪ Forest tillage: 32.2% of the total number of verbal trials established, with approximately 813 verbal trials during the same period.
Cutting of sharp wood in federal forests: 30.9% of the total number of verbal trials established, with 782 verbal trials during the same period.
V. C
ONCLUSIONThis study showed the relevance of the method chosen. It will help decision-makers take important decisions regarding deforestation and
urban planning. The work focused on the importance of remote sensing in land use simulation study. In our case we worked between 2000 and 2020 to predict the land use state in 2040.
This study of the dynamics of land use showed that the ecological balance of forest ranges is relatively stable. Most land use types remained the same during 2020, but there were some changes in forest classes and uncultivated areas. The CA Markov model demonstrates the predictability of land use in the future for states, especially for forests in the Taza Province. It gives a rough idea of what must happen to the forest to ensure sustainable development and preserve the forest as much as possible.
R
EFERENCES[1]