Competitive target gene regulation by promoter methylation and miRNA
6
0
0
全文
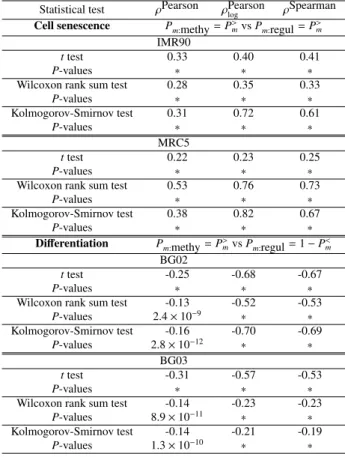
(2) Vol.2012-BIO-31 No.1 2012/10/15. IPSJ SIG Technical Report. Fig. 1. Schematics of the principal findings in the present study Promoters turned out to be methylated in a miRNA-targeting-specific manner (Tables 1 and 2). For exmaple, miRNA A (green) and B (magenta) mainly target genes with hypomethylated promoters but miRNA C (yellow) target genes with hypermethylated promoters. There are more miRNAs that target genes with hypomethylated promoters. Genes with miRNA-targeting-specific hypomethylated promoters are downregulated during cell senescence and upregulated during differentiation (Table 3 and 4).. This finding was not inconsistent with the conclusion by Su et al [13], who insisted that miRNAs had a tendency to target gene with hypomethylated promoters. Since promoter methylation pattern does not change drastically between several cell types, the amount of miRNA-targeting-specific promoter methylation is also highly cell type independent. Mean correlation coefficients of P>m is 0.8 - 0.9 dependent on statistical tests and definiton of promoter methyaltion levels (Table 2). In order to see if this miRNA-targeting-specific promoter methylation is really related to miRNA regulation of target genes,. c 2012 Information Processing Society of Japan. we compared P-values of miRNA-targeting-specific promoter methylation with P-values of miRNA regulation of target genes during the senescence of IMR90 cell lines and MRC5 cell lines [19], [20] and during differentiation of both BG02 and BG03 cell lines[21]. It is clear that promoter methylation and regulation of target genes are significantly correlated during both cell senescence and differentiation (Table 3), in spite of that correlation coefficients have opposite signs between cell senescence and differentiation. This means that genes with miRNA-targeting-specific promoter hypomethylation are downregulated during cell senes-. 2.
(3) Vol.2012-BIO-31 No.1 2012/10/15. IPSJ SIG Technical Report. Table 1. miRNA-targeting-specific promoter hypomethylation The summation of the number of miRNAs that target genes with significantly hypomethylated promoters in each cell line (sample). The total numbers of miRNAs and cell lines (samples) are 1921 and 271, respectively (out of 283 samples in GSE30653, excluding 12 control samples). Thus, the total number of combinations of a miRNA and a cell line is 1921 × 271 = 520591. The promoter methylation levels were defined as either amount of methylation or β-values. When adjusted P-values based on BH criterion[17], P>m , < 0.05, promoters of target genes of miRNAs were judged as being significantly hypomethylated. P-values were adjusted by p.adjust function in R[18].. Amount of methylation Number of miRNAs Statistical tests not significant significant t-test 136054 384537 Wilcoxon rank sum test 144572 376019 Kolmogorov-Smirnov test 129998 390593 β-values Number of genes not significant significant Statistical tests t-test 39390 481201 Wilcoxon rank sum test 45188 475403 Kolmogorov-Smirnov test 41952 478639 Table 2. 74 % 72 % 75 %. 92 % 91 % 92 %. Mean correlation coefficients between P-values of miRNAtargeting-specific promoter hypomethylation of samples Mean Pearson’s correlation coefficients of P>m between pairs of cell lines.. Statistical test Averaged correlation coefficients Amount of methylation t-test 0.9112043 0.8981256 Wilcoxon rank sum test Kolmogorov-Smirnov test 0.8263153 β-values t-test 0.8919359 0.8832241 Wilcoxon rank sum test Kolmogorov-Smirnov test 0.8257556. cence but upregulated during differentiation. In order to confirm that the above significant correlation between miRNA-targeting-specific promoter methylation and miRNA regulation of target genes is not accidental, we also investigated that of IMR90 cell lines with another microarray, sequencing and other research groups (Table 4). It is also clear that the correlation is always significant independent of these conditions.. 3. Conclusions Fig. 1 schematically summaries the principal findings in this study. For the first time to our knowledge, we found miRNA-targeting-specific promoter methylations for many types of cell lines (Tables 1 and 2). The miRNA-targeting-specific hypomethylation was also correlated (Tables 3 and 4) to regulation of miRNA target genes; genes with miRNA-targeting-specific hypomethylated promoters were downregulated during cell senescence and upregulated during differentiation. Biological meanings of these findings will be discussed elsewhere.. 4. Methods 4.1 Promoter methylation profiles In this study, we used publically available promoter methylation profiles from various resources. Primary and mostly investigated promoter methylation profiles were obtained from GEO ID: GSE30653[22]. It includes 283 human promoter methyla-. c 2012 Information Processing Society of Japan. Table 3. Correlation coefficients between P-values of miRNA-targetingspecific promoter hypomethylation and miRNA regulation of target genes Various correlation coefficients between P-values of promoter methylation and regulation of target genes in IMR90 and MRC5 during cell senescence and in BG02 and BG03 during differentiation and P-values associated with the correlation coefficients. ∗ :< 2.2 × 10⁻¹⁶ P>m s were employed for cell senescence while P>m s of promoter methylation and 1 − P>m of regulation of target genes were employed for differentiation as shown, since these combinations exhibited the most significant correlations. Genes with miRNA-targeting-specific promoter hypomethylation were recognized to be downregulated during cell senescence because of positive correlations and upregulated during differentiation because of negative correlations (for details, see Methods). Statistical test Cell senescence. t test P-values Wilcoxon rank sum test P-values Kolmogorov-Smirnov test P-values t test P-values Wilcoxon rank sum test P-values Kolmogorov-Smirnov test P-values Differentiation t test P-values Wilcoxon rank sum test P-values Kolmogorov-Smirnov test P-values t test P-values Wilcoxon rank sum test P-values Kolmogorov-Smirnov test P-values. ρSpearman ρPearson ρPearson log Pm:methy = P>m vs Pm:regul = P>m IMR90 0.33 0.40 0.41 ∗ ∗ ∗ 0.28 0.35 0.33 ∗ ∗ ∗ 0.31 0.72 0.61 ∗ ∗ ∗ MRC5 0.22 0.23 0.25 ∗ ∗ ∗ 0.53 0.76 0.73 ∗ ∗ ∗ 0.38 0.82 0.67 ∗ ∗ ∗ Pm:methy = P>m vs Pm:regul = 1 − P<m BG02 -0.25 -0.68 -0.67 ∗ ∗ ∗ -0.13 -0.52 -0.53 2.4 × 10⁻⁹ ∗ ∗ -0.16 -0.70 -0.69 2.8 × 10⁻¹² ∗ ∗ BG03 -0.31 -0.57 -0.53 ∗ ∗ ∗ -0.14 -0.23 -0.23 8.9 × 10⁻¹¹ ∗ ∗ -0.14 -0.21 -0.19 1.3 × 10⁻¹⁰ ∗ ∗. tion profiles for distinct cell lines, ranging from hESC to various somatic samples, measured by Illumina HumanMethylation27 BeadChip, which provides an efficient solution for surveying genome-wide DNA methylation profiles. The HumanMethylation27 panel targets CpG sites located within the proximal promoter regions of transcription start sites (TSS). Thus, it is suitable for our purpose. Promoter methylation profiles GEO ID: GSE30653 also includes promoter methylation profiles in both IMR90 and MRC5 cell lines, which were employed to investigate the relationship between promoter methylation and the previously reported[19], [20] miRNA regulation of target genes together with miRNA expression profiles. The promoter methylation profiles in both BG02 and BG03 were also included in this set, where their promoter methylation patterns were compared with miRNA regulation of target genes together with miRNA expression profiles, too (see below). Additional promoter methylation profiles in IMR90 cell lines were obtained from GRO ID: GSM868008[22], GEO ID: GSM739940[23], and GEO ID: GSM375442[24]. They were compared with IMR90 promoter methylation profile, GEO ID: 3.
(4) Vol.2012-BIO-31 No.1 2012/10/15. IPSJ SIG Technical Report. Table 4. Evaluation of the correlation between miRNA-targetingspecific promoter methylation and miRNA regulation of target genes Correlation coefficients between miRNA-targeting-specific promoter methylaion and miRNA regulation of target genes during cell senescence shown in Table 3 were evaluated by a comparison with the results by different array design (GSM868008), distinct research group and alternative measures of promoter methylation (GSM739940), and sequencing (GSM375442). Independent of these factors, miRNA-targeting-specific promoter methylation is always positively correlated to miRNA regulation of target genes, i.e., genes with miRNA-targeting-specific promoter hypomethylation were downregulated during cell senescence.. Statistical test GSM868008 t test P-values Wilcoxon rank sum test P-values Kolmogorov-Smirnov test P-values GSM739940 t test P-values Wilcoxon rank sum test P-values Kolmogorov-Smirnov test P-values GSM375442 t test P-values Wilcoxon rank sum test P-values Kolmogorov-Smirnov test P-values. ρPearson Pm:methy 0.28 ∗ 0.18 4.4 × 10⁻¹⁶ 0.16 1.9 × 10⁻¹² Pm:methy 0.11 3.0 × 10⁻⁶ 0.07 2.5 × 10⁻³ 0.07 2.7 × 10⁻³ Pm:methy 0.19 3.0 × 10⁻⁶ 0.19 2.2 × 10⁻¹⁶ 0.28 ∗. ρPearson ρSpearman log > = Pm vs Pm:regul = P>m 0.37 0.37 ∗ ∗ 0.32 0.28 ∗ ∗ 0.70 0.54 ∗ ∗ = P>m vs Pm:regul = P>m 0.40 0.34 ∗ ∗ 0.33 0.27 ∗ ∗ 0.79 0.51 ∗ ∗ = P>m vs Pm:regul = P>m 0.17 0.26 1.5 × 10−14 ∗ 0.27 0.24 ∗ ∗ 0.57 0.50 ∗ ∗. GSM760387 which belongs to GSE30653. GSE31848, which includes GSM868008 for an IMR90 cell line, provided us promoter methylation profiles with another microarray, Illumina HumanMethylation450 BeadChip. This BeadChip allows us to interrogate > 485000 methylation sites per sample at single-nucleotide resolution. Since it includes CpG sites other than promoter regions, we restricted probes to a subset labeled as either TSS200 or TSS1500. GSM375442 includes IMR90 promoter methylation profiles measured by Illumina HumanMethylation27 BeadChip. However, since it was done by the different research group, we tested this profile to confirm that the results were not research group dependent. Finally, GSM375442 provided us promoter methylation profiles not by microarray technology, but by sequencing. CpG methylation profiles in promoter region defined as between -200 sites and +1200 sites from TSS was extracted using Bismark Software[25] (see below). 4.2 mRNA and miRNA expression profiles In order to compare miRNA-targeting-specific promoter methylation with miRNA regulation of target genes together with miRNA expression profiles in BG02 and BG03 cell lines, both miRNA and mRNA profiles were obtained from GEO ID: GSE14473[21] as follows. Gene (mRNA) expression profiles of undifferential and differential BG02 (BG03) cell lines are GEO ID: GSM551204 and GSM551206 (GSM551216 and GSM551218), respectively. Corresponding miRNA expression profiles are GEO ID: GSM361147 and GSM361271 (GSM361288 and GSM361289), respectively. Raw data files were downloaded from the site for further analysis and were nor-. c 2012 Information Processing Society of Japan. malized so as to have mean 0 and variance 1. 4.3 Investigation of miRNA-targeting-specific promoter methylation In order to infer miRNA-targeting-specific promoter methylation, we have employed MiRaGE method [16] (see below). MiRaGE method, which was implimeneted as public domain server[26] and Bioconductor package[27], was firstly proposed to infer miRNA regulation of target genes. However, since it infers how significantly and differently miRNA target genes are expressed between two experimental conditions based on expression profiles of target genes, we can also infer miRNA-targetingspecific promoter methylation by substituting promoter methylation profiles attributed to each gene for gene expression profiles. For this purpose, we prepare (puseudo) control set where all “gene expressions” take uniquely 1. Then the amount of methylation was substituted for the treatment set. Although not the amount of methylation but its ratio to unmethylated sites is usually used to describe promoter methylation levels, the reason why we employed the amount of methylation is because P-values computed when the amount of methylation was employed are more correlated to the P-values which express miRNA regulation of target genes (see below). The reason why the amount is more correlated to miRNA regulation of target genes than the ratio is possibly because the frequency of CpG is also related to miRNA targeting[14]; i.e., genes with promoter including more CpG were more often targeted by miRNAs as mentioned above. Using this procedure, we can attribute two P-values to each miRNA; one expresses how strongly methylated promoters of target genes are and another expresses how strongly demethylated promoters of target gene are. For this pupose, dependent upon the methodology and/or types of deposited data set, we computed P-values that describe promoter methylation as follows. 4.3.1 GSM868008 In this case, promoter methylation profiles which was supposed to be replaced with “gene expression” for MiRaGE method were, xcontrol,i = 1, (puseudo) control set xtreat,i = exp(M0i ), treatment set where M0i is scaled values of signal B, which expressed the amount of promoter methylation, of ith gene, Mi − hMi i σ Mi 1 X hMi i ≡ Mi N i s 1 X (Mi − hMi i)2 , σ Mi ≡ N i M0i ≡. where N is total number of genes considered and Mi is raw value of signal B. This means, the amount of promoter methylation is scaled so as to have mean hM0i i of zero and standard deviation σ M0i of 1. The reason why exp is applied is because we would like to consider not ratio but the amount. Since P-values are computed after the pair of input values are transformed to logarithmic ratio, substituting 1 to control and exponential value to treatment results in considering raw values (see below). 4.
(5) IPSJ SIG Technical Report. 4.3.2 GSE30653 In this case, promoter methylation profiles which was supposed to be replaced with “gene expression” for MiRaGE method were, xcontrol,i = 1, (puseudo) control set xtreat,i = Mi + Ci , treatment set where Ci takes 1 only when Mi = 0 otherwise 0 so as to avoid infinite values after the transformation to the logarithmic ratio. 4.3.3 GSM739940 In this case, promoter methylation profiles which was supposed to be replaced with “gene expression” for MiRaGE method were, xcontrol,i = 1, (puseudo) control set xtreat,i = exp(βi ), treatment set where βi is the ratio of methylation to unmetylation, βi ≡. Mi + C , Mi + U i + C. where Ui is signal from unmethylated site (signal A) and C is regulation constant which typically takes 100. Since only β values were deposited, we could not avoid using them, although the correlation with miRNA regulation of target genes was substantially decreased. The reason why exp is used is the same as above. 4.3.4 GSM375442 In this case, promoter methylation profiles which was supposed to be replaced with “gene expression” for MiRaGE method were, xcontrol,i = 1, (puseudo) control set ! Mi xtreat,i = exp , treatment set max(Mi ) where max(Mi ) is the maximum values of Mi and Mi is computed in this case as follows, X Mi ≡ y j, j∈promoter of gene i where y j , 0 ≤ y j ≤ 100 is the percentage of methylation at site j, which was computed by Bismark Software[25] (see below). Summation was taken over supposed promoter region as mentioned above, i.e., between -200 sites and +1200 sites from TSS. 4.4 Methylation computation by Bismark Software Here are command line inputs that generate methylation of CpG sites by Bismark Software[25]. % bismark_genome_preparation \ --path_to_bowtie bowtie_dir \ --verbose ./hg19/ & % R >x <- scan("GSM375442_CpgMIP-IMR90.seq.txt", sep="\n",what=character(0)) >write.table(file="sequence.fa", paste(paste(">p",1:length(x),sep=""), x,sep="\n"),sep="\n",row.names=F, quote=F,col.names=F) >q() % bismark ./hg19/ \. c 2012 Information Processing Society of Japan. Vol.2012-BIO-31 No.1 2012/10/15. --path_to_bowtie bowtie_dir \ --bowtie2 -f sequence.fa % methylation_extractor -s --comprehensive \ sequence.fa_bt2_bismark.sam % genome_methylation_bismark2bedGraph_v3.pl \ CpG_content_sequence.fa_bt2_bismark.sam.txt \ > sequence.fa_bt2_bismark.sam.bed where bowtie_dir is the directory where bowtie2[28] is installed. We also assumed that R[18] was installed but the part executed by R can be perfomed by any other alternative script languages. GSM375442_CpgMIP-IMR90.seq.txt is a file downloaded from GEO and sequence.fa_bt2_bismark.sam.bed includes methylation percentages of each CpG sites, y j , which was mentioned above. 4.5 Inference of miRNA-targeting-specific promoter methylation/miRNA regulation of target genes by MiRaGE method In this subsection, we would like to briefly explain how to infer miRNA-targeting-specific promoter methylation/miRNA regulation of target genes using MiRaGE method, although the detailed explanations have already been published[16]. Although MiRaGE method basically treats two experimental conditions each of which contains more than one replicate, we here explain the case where each condition consists of only one replicate. Suppose there are a pair of gene expressions or promoter methylation profiles for gene i, xcontrol,i and xtreat,i , which were measured under a control condition and under a treatment condition, respectively. Then logarithmic ratio xtreat,i ∆xi ≡ log xcontrol,i was computed. When difference of raw values are favorable, exponential values exp(xi ) can be used instead of xi , then we get exp(xtreat,i ) ∆xi = log = xtreat,i − xcontrol,i exp(xcontrol,i ) When computing P-values which reject null hypothesis with the alternative hypothesis that ∆xi s of target genes of the miRNA m are less (greater) than those that are off-target but target of any other miRNAs, we compute P<(>) ≡ P[{∆xi | i ∈ Gm } < (>){∆xi | i ∈ G0m }] m where P[A < (>)B] is P-values computed by statistical tests when two set A and B are compared. The implemented tests for MiRaGE Server/package are t-test, Wilcoxon rank sum test, and Kolmogorov-Smironov test. Thus, how to judge A < (>)B is dependent upon the selected statistical test. Gm is the set of target genes of miRNA m and G0m is the set of off-target genes which are target genes of any other miRNAs. One should notice that genes that are target genes of no miRNAs were totally excluded from the analysis. For the computation in this study, all miRNAs are considered and no exclusions based on conservation were applied. When inferring promoter methylation, xcontrol,i = 1 and xtreat,i is the amount of promoter methylation. When inferring miRNA regulation of target genes during cell senescence 5.
(6) Vol.2012-BIO-31 No.1 2012/10/15. IPSJ SIG Technical Report. in IMR90 and MRC5 cell lines, xcontrol,i is gene expression of young cell line and xtreat,i is gene expression of senescent cell line. When inferring regulation of target genes during differentiation in BG02 and BG03 cell lines, xcontrol,i is gene expression of undifferentiated cell line and xtreat,i is gene expression of differentiated cell line.. [9] [10] [11] [12]. Correlation between miRNA-targeting-specific promoter methylaion and miRNA regulation of target genes Suppose we have two types of P-values, P<(>) which m:methy corresponds to the miRNA-targeting-specific promoter methylation and P<(>) which corresponds to the miRNA regulam:regul tion of target genes of miRNA m. When P<(>) is m:methy[regul] small enough, the target genes of miRNA m are significantly hyper(hypo)methylated [up(down)regulated]. In order to see if these two types of P-values are correlated, we computed various correlation coefficients between these two, h i ρPearson ≡ ρ Pm:methy , Pm:regul h i ρPearson ≡ ρ log(Pm:methy ), log(Pm:regul ) log h i ρSpearman ≡ ρ rank(Pm:methy ), rank(Pm:regul ) and accompanied P-values to reject null hypothesis that ρ = 0 with the alternative hypothesis that ρ , 0. ρ[a, b] is the Pearson’s correlation coefficients between a and b and rank(xm ) is the rank order of xm among {xm }. Pm:z where z ∈ {methyl, regul} is either P<m , P>m , 1− P<m or 1− P>m . Thus, there are 4×4 = 16 possible combinations of Pm:methy and Pm:regul . ρs of Kolmogorov-Smirnov test and ρPearson s for all tests can change when P<(>) is replaced log. with 1− P>(<) because P<(>) , 1− P>(<) for Kolmogorov-Smirnov test and log(P<(>) ) , log(1 − P>(<) ) for all tests. Thus, optimal combinations that have the maximum absolute correlation coefficients were employed. Acknowledgments The author thanks the anonymous reviwer[20] who suggested the investigation of the promoter methylation of miRNA target genes. This study was supported by KAKENHI (23300357).. [13]. [14] [15]. [16] [17] [18] [19] [20]. [21]. [22]. [23]. References [1] [2] [3] [4] [5] [6] [7]. [8]. Golbabapour, S., Abdulla, M. A. and Hajrezaei, M.: A concise review on epigenetic regulation: insight into molecular mechanisms, Int J Mol Sci, Vol. 12, No. 12, pp. 8661–8694 (2011). Suzuki, M. M. and Bird, A.: DNA methylation landscapes: provocative insights from epigenomics, Nat. Rev. Genet., Vol. 9, No. 6, pp. 465–476 (2008). Bartova, E., Krejci, J., Harnicarova, A., Galiova, G. and Kozubek, S.: Histone modifications and nuclear architecture: a review, J. Histochem. Cytochem., Vol. 56, No. 8, pp. 711–721 (2008). Pabo, C. O. and Sauer, R. T.: Transcription factors: structural families and principles of DNA recognition, Annu. Rev. Biochem., Vol. 61, pp. 1053–1095 (1992). He, L. and Hannon, G. J.: MicroRNAs: small RNAs with a big role in gene regulation, Nat. Rev. Genet., Vol. 5, No. 7, pp. 522–531 (2004). Das, P. M. and Singal, R.: DNA methylation and cancer, J. Clin. Oncol., Vol. 22, No. 22, pp. 4632–4642 (2004). Boks, M. P., Derks, E. M., Weisenberger, D. J., Strengman, E., Janson, E., Sommer, I. E., Kahn, R. S. and Ophoff, R. A.: The relationship of DNA methylation with age, gender and genotype in twins and healthy controls, PLoS ONE, Vol. 4, No. 8, p. e6767 (2009). Berardi, E., Pues, M., Thorrez, L. and Sampaolesi, M.: microRNAs in. c 2012 Information Processing Society of Japan. [24]. [25] [26] [27]. [28]. ES Cell Differentiation, Am. J. Physiol. Heart Circ. Physiol. (2012). Etheridge, A., Lee, I., Hood, L., Galas, D. and Wang, K.: Extracellular microRNA: A new source of biomarkers, Elsevier (2011). Lopez-Serra, P. and Esteller, M.: DNA methylation-associated silencing of tumor-suppressor microRNAs in cancer, Oncogene, Vol. 31, No. 13, pp. 1609–1622 (2012). Piriyapongsa, J., Bootchai, C., Ngamphiw, C. and Tongsima, S.: microPIR: an integrated database of microRNA target sites within human promoter sequences, PLoS ONE, Vol. 7, No. 3, p. e33888 (2012). Place, R. F., Li, L. C., Pookot, D., Noonan, E. J. and Dahiya, R.: MicroRNA-373 induces expression of genes with complementary promoter sequences, Proc. Natl. Acad. Sci. U.S.A., Vol. 105, No. 5, pp. 1608–1613 (2008). Su, Z., Xia, J. and Zhao, Z.: Functional complementation between transcriptional methylation regulation and post-transcriptional microRNA regulation in the human genome, BMC Genomics, Vol. 12 Suppl 5, p. S15 (2011). Sinha, S., Adler, A. S., Field, Y., Chang, H. Y. and Segal, E.: Systematic functional characterization of cis-regulatory motifs in human core promoters, Genome Res., Vol. 18, No. 3, pp. 477–488 (2008). Saito, T. and Sætrom, P.: Target gene expression levels and competition between transfected and endogenous microRNAs are strong confounding factors in microRNA high-throughput experiments, Silence, Vol. 3, p. 3 (2012). Yoshizawa, M., Taguchi, Y. H. and Yasuda, J.: Inference of Gene Regulation via miRNAs During ES Cell Differentiation Using MiRaGE Method, Int J Mol Sci, Vol. 12, pp. 9265–9276 (2011). Benjamini, Y. and Hochberg, Y.: Controlling the false discovery rate: a practical and powerful approach to multiple testing, J. R. Stat. Soc. B, pp. 289–300 (1995). R Foundation for Statistical Computing: R: A Language and Environment for Statistical Computing, Vienna, Austria (2012). Taguchi, Y.-h.: Inference of Target Gene Regulation via miRNAs during Cell Senescence by Using the MiRaGE Server, Aging and Disease (2012). Taguchi, Y.-h.: Inference of target gene regulation via miRNAs during cell cenescence by using the MiRaGE Server, Emerging Intelligent Computing Technology and Applications (Huang, D.-S., Gupta, P., Zhang, X. and Premaratne, P., eds.), Springer: Heidelberg, pp. 441– 446 (2012). Stadler, B., Ivanovska, I., Mehta, K., Song, S., Nelson, A., Tan, Y., Mathieu, J., Darby, C., Blau, C. A., Ware, C., Peters, G., Miller, D. G., Shen, L., Cleary, M. A. and Ruohola-Baker, H.: Characterization of microRNAs involved in embryonic stem cell states, Stem Cells Dev., Vol. 19, No. 7, pp. 935–950 (2010). Nazor, K. L., Altun, G., Lynch, C., Tran, H., Harness, J. V., Slavin, I., Garitaonandia, I., Muller, F. J., Wang, Y. C., Boscolo, F. S., Fakunle, E., Dumevska, B., Lee, S., Park, H. S., Olee, T., D’Lima, D. D., Semechkin, R., Parast, M. M., Galat, V., Laslett, A. L., Schmidt, U., Keirstead, H. S., Loring, J. F. and Laurent, L. C.: Recurrent variations in DNA methylation in human pluripotent stem cells and their differentiated derivatives, Cell Stem Cell, Vol. 10, No. 5, pp. 620–634 (2012). Ohm, J. E., Mali, P., Van Neste, L., Berman, D. M., Liang, L., Pandiyan, K., Briggs, K. J., Zhang, W., Argani, P., Simons, B., Yu, W., Matsui, W., Van Criekinge, W., Rassool, F. V., Zambidis, E., Schuebel, K. E., Cope, L., Yen, J., Mohammad, H. P., Cheng, L. and Baylin, S. B.: Cancer-related epigenome changes associated with reprogramming to induced pluripotent stem cells, Cancer Res., Vol. 70, No. 19, pp. 7662–7673 (2010). Deng, J., Shoemaker, R., Xie, B., Gore, A., LeProust, E. M., Antosiewicz-Bourget, J., Egli, D., Maherali, N., Park, I. H., Yu, J., Daley, G. Q., Eggan, K., Hochedlinger, K., Thomson, J., Wang, W., Gao, Y. and Zhang, K.: Targeted bisulfite sequencing reveals changes in DNA methylation associated with nuclear reprogramming, Nat. Biotechnol., Vol. 27, No. 4, pp. 353–360 (2009). Krueger, F. and Andrews, S. R.: Bismark: a flexible aligner and methylation caller for Bisulfite-Seq applications, Bioinformatics, Vol. 27, No. 11, pp. 1571–1572 (2011). Taguchi, Y.-h.: MiRaGE Server, Chuo University (online), available from hhttp://www.granular.com/MiRaGE/i (accessed 2011). Taguchi, Y.-h.: MiRaGE Package, Bioconductor (online), available from hhttp://www.bioconductor.org/packages/2.11/bioc/html/MiRaGE.htmli (accessed 2012). Langmead, B. and Salzberg, S. L.: Fast gapped-read alignment with Bowtie 2, Nat. Methods, Vol. 9, No. 4, pp. 357–359 (2012).. 6.
(7)
図


関連したドキュメント
The evaluation of VASA TDMR methylation state in the testicular genome We analyzed VASA gene TDMRs (that is, VASA promoter CpG islands) using MassARRAY®.. All samples were
To determine the promoter activities of 5 ′ -flanking region of the human Pim-3 gene, we subcloned various deleted 5 ′ -flanking regions of the human Pim-3 gene into a
We measured blood levels of adiponectin in SeP knockout mice fed a high sucrose, high fat diet to examine whether SeP was related to the development of hypoadiponectinemia induced
With optimizing FSE imaging parameters, i.e., effective TE, TR, and low ETL, the measurement values of T 1 and T 2 revealed significantly higher correlation between the dual FSE
lattice points, ellipsoids, rational and irrational quadratic forms, pos- itive and indefinite quadratic forms, distribution of values of quadratic forms, Oppenheim
In previous work [11], the author shows that in the general case of functions f : G → N between arbitrary finite groups G and N , bundle and graph equivalence have a common source
Keywords: Polynomials; small values; Cartan’s lemma; P61ya; Remez; capacity.. 1991 Mathematics Subject Classification: Primary 30C10, 41A17; Secondary 31A15,
We study some properties of subclasses of of the Carath´ eodory class of functions, related to conic sections, and denoted by P(p k ).. Coefficients bounds, estimates of
