Evolutionary and developmental analysis of
germline formation in simple chordate embryos
著者
ZHENG TAO
学位授与機関
Tohoku University
学位授与番号
11301甲第19364号
博士論文
尾索動物胚生殖細胞系列における転写制御機構の発生学的および比較発生学
的な解析
Evolutionary and developmental analysis of germline formation in simple chordate
embryos
令和元年度
東北大学大学院生命科学研究科
生態発生適応科学専攻
Contents
Contents ... 1
Abstract ... 3
1. Introduction ... 5
1.1 Germline specification ... 5
1.2 Germline transcriptional repression in early germline cell blastomeres ... 7
1.3 Transcriptional repression after initiation of zygotic PGC program ... 10
1.4 Germline development and transcriptional regulation in ascidian, Halocynthia roretzi... 10
1.5 Evolutionary view of germline development ... 14
2. Material and Methods ... 16
2.1 Animals and embryos... 16
2.2 Microinjection (MO and mRNA) and GSK-126 inhibitor treatment ... 16
2.3 Construction of expression vectors for in vitro mRNA transcription ... 17
2.4 Immunostaining ... 18
2.5 SYTOX nuclear staining ... 19
2.6 Mounting and quantification of fluorescent intensity... 19
2.7 Whole-mount in situ hybridization ... 19
2.8 Blast search and phylogenetic analyses ... 21
2.9 Primers ... 22
Chapter 1 Germline transcriptional regulation in H. roretzi... 23
3. Results ... 23
3.1 Pem still represses pSer2-CTD of RNAPII in the germline of ascidian embryos at later stages ... 23
3.2 H3K27me3 is enriched in the later ascidian embryonic germline... 27
3.3 The mRNAs of the core PRC2 components in H. roretzi are maternally supplied ... 31
3.5 Pem- and H3K27me3-deficient germline only partially proceeds muscle gene expression ... 44
3.6 Ectopic MA4 gene expression depends on a maternal muscle determinant, Macho-1 ... 46
3.7 Pem- and H3K27me3-deficient germline also mis-expressed a ubiquitous gene ... 48
3.8 Pem and H3K27me3 are regulated independently ... 51
4. Discussion ... 53
4.1 Why was the percentage of embryos showing ectopic gene expression low? ... 55
4.2 Why were muscle-related genes preferentially ectopically expressed? ... 55
4.3 An evolutionary conserved transition: the chromatin-based transcriptional repression relays repression by early maternally localized factors ... 56
Chapter 2: Evolutionary aspect of germline development in simple chordates ... 58
5. Results ... 58
Ciona savignyi Pem represses the transcription by a different domain than H. roretzi Pem ... 58
6. A brief introduction to germline development in Oikopleura dioica embryogenesis ... 63
7. Results ... 65
7.1 Vasa protein is localized at the CAB-like structure in the germline of early O. dioica embryos ... 65
7.2 Both pSer2-CTD and pSer5-CTD are absent in O. dioica germline at the 32-cell stage ... 68
8. Discussion ... 72
8.1 O. dioca germline formation and Pem gene in Tunicate species ... 72
8.2 Phosphorylation of RNAPII in O. dioca germline before gastrulation... 73
9. Future direction ... 75
References ... 76
Publication and presentation list... 87
Abstract
Germ cell formation and its protection from taking on somatic fates are critical for the continuity of species. In many animals, primordial germ cells (PGCs) form during embryogenesis by one of the two mechanisms: an ancestral epigenesis mechanism or a derived preformation mode. The epigenesis mechanism requires cell-cell interaction, while the preformation mode depends on maternal determinants in the germ plasm.
Posterior end mark (Pem) mRNA is a component of the ascidian germ plasm, known as Centrosome-Attracting Body (CAB). Pem protein is translated in CAB and nuclear Pem protein functions to repress the activity of RNA polymerase II (RNAPII), thereby globally suppressing germline transcription. Although this Pem-mediated germline transcriptional repression is required to prevent germline cells from somatic differentiation, the decrease of Pem protein level is observed from around the 64-cell stage. This downregulation is mediated by another maternally localized factor ZF-1 and is a pre-requisition for the initiation of zygotic expression of germline genes at the 110-cell to gastrula stages. But then a question arises as to how the transcriptionally competent germline cells remain silent in somatic gene expression. To study this issue, I specially asked the following two questions using an ascidian species Halocynthia roretzi: 1) does Pem protein still repress somatic gene expression in later stage germline cells? 2) are there any other factors that repress the transcription of somatic genes following the decrease of Pem protein?
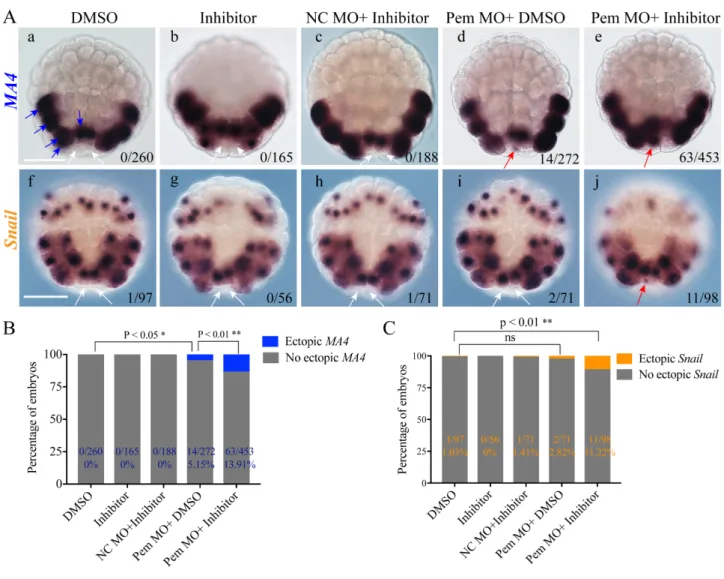
I report here that Pem knockdown resulted in an elevated RNAPII activity at the 110-cell stage, suggesting that Pem still takes part in transcriptional repression in later stage germline cells. However, the percentage of embryos showing ectopic somatic gene expression in the germline cells upon Pem knockdown was small, suggesting that there might be another factor(s) repressing germline transcription. I found that H3K27me3, a repressive transcription-related chromatin mark, became enriched in germline cells from the 64-cell stage onwards, hinting that it may function to repress somatic gene expression in the germline. In fact, Pem knockdown and treatment with an inhibitor for H3K27me3 resulted in significantly more embryos showing ectopic expression of muscle-related genes (MA4 and Snail) in germline cells at the 110-cell stage, but not of genes essential for fate determination of other tissue types such as notochord and nerve cord. Interestingly, the muscle lineage is the last somatic lineage that separates from the germline during ascidian embryogenesis. I found that the ectopic expression in the Pem- and H3K27me3-deficient embryos is dependent on a maternally localized muscle determinant, Macho-1, whose mRNA is inherited only by germline cells but protein is thought to be present in a broad region of the posterior part of the embryo including muscle lineage cells. In addition, Clone 22, which is expressed in all the cells including germline’s sister cells, but not in germline cells at the 110-cell stage, is also ectopically expressed upon the double treatments. Therefore, I propose that Pem- and H3K27me3-dependent mechanisms repress gene expression normally activated in somatic lineages that have been shared with germline until late stages because there is a high chance that germline inherits transcription factors activating the gene expression. Taken together, my results show that a chromatin-based mechanism comes in to repress somatic gene expression when the Pem
amount is downregulated. Using a chromatin-based mechanism following a mechanism mediated by a maternally localized factor is conserved among ascidian, Caenorhabditis elegans, and Drosophila.
For the second topic of the current study, I studied evolutionary aspects of germline development using several simple chordate/tunicate species such as an appendicularian species Oikopleura dioica and an ascidian species Ciona savignyi. It is known that there is no Pem in the genome of O. dioica. I specifically asked the following three questions: 1) does O. dioica use preformation or epigenesis mechanism to segregate germline? 2) do O. dioica germline cells experience transcriptional repression even without Pem? 3) does Pem from different ascidian species function differently? Here, by using another ascidian species C. savignyi, I found that C. savignyi Pem has transcriptional repression activity just like H. roretzi Pem, but that domains required for the transcriptional repression within the Pem proteins are different between H. roretzi and C. savignyi. I also report that a conserved germline marker Vasa protein was detected in O. dioica germline cells at the 4- and 16-cell stages, supporting the notion that O. dioica uses the preformation mechanism. Considering the proposed most basal phylogenetic position of appendicularians among the tunicate species, the evolution of preformation mechanism likely preceded the acquirement of the Pem gene in the ascidian lineage. I also noticed that the RNAPII activity was absent in O. dioica germline cells at the 32-cell stage, indicating that O. dioica uses a mechanism that does not involve Pem and is different from ascidian species to target RNAPII for germline transcriptional regulation.
These results suggest that mechanisms by which germline gene expression is repressed can be diversified even between closely related species. Taken together, studying simple chordate species has provided us an interesting opportunity to better understand the evolutionary aspects of animal germline development.
In summary, the present study focusing on germline transcriptional regulation in simple chordate animals reveals both conserved and diverse mechanisms of germline development among animal species.
1. Introduction
Our body is composed of two types of cells, somatic cells and germ cells. The somatic cells contribute to organizing our tissues and organs for our daily activities, but they are doomed to death in a normal life cycle. In contrast, the germ cells are able to produce oocytes and sperm, subsequently generating a new organism upon fertilization. Thus, correct specification and protection of germ cells are critical for the continuity of species.
1.1 Germline specification
The primordial germ cells (PGCs) are often separated from the somatic cell lineage during embryogenesis typically by either preformation mechanism or epigenesis mechanism.
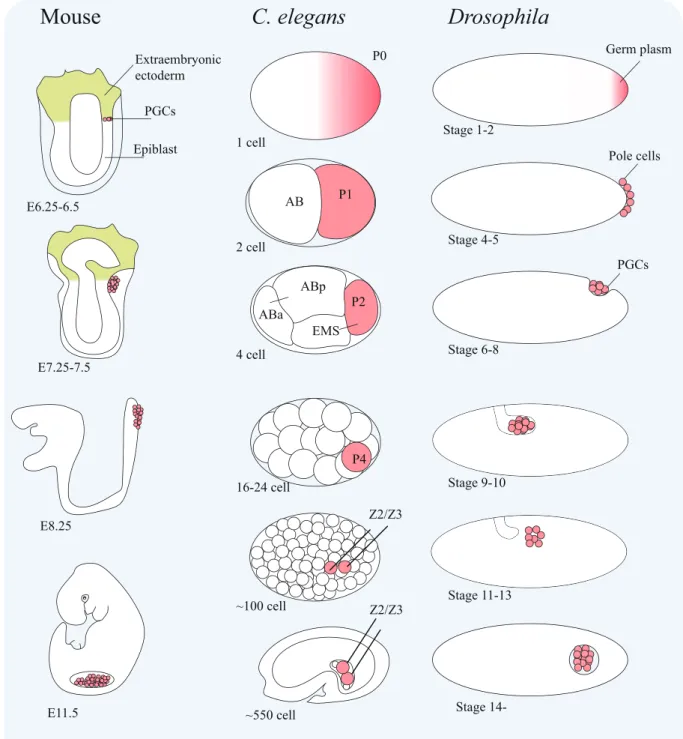
In some animals, including Drosophila, Caenorhabditis elegans, ascidians and zebrafish, the formation of PGCs via preformation is characterized by the presence of a special cytoplasm known as the germ plasm localized in the egg, which contains essential factors for PGC development and is inherited by a subset of cells during early embryogenesis (Ikenishi, 1998; Mahowald, 2001; Strome and Wood, 1982; Shirae-Kurabayashi et al., 2006; Yoon et al., 1997). The embryonic cells inheriting the germ plasm will eventually give rise to PGCs. For example, in Drosophila, the germ plasm (also known as the pole plasm) is asymmetrically anchored to the posterior end of the egg and embryo (Fig. 1-1, referred to Nakamura et al., 2010; Robert et al., 2015). Cells formed at the posterior position at the stage 4-5 inheriting this germ plasm called pole cells will take on PGC fate. The maternally supplied germ plasm is shown to be both necessary and sufficient to determine the formation of PGCs by cytoplasmic removal and transfer experiments (Illmensee and Mahowald, 1974).
In contrast, in some other animals, including mammals, the formation of PGCs does not depend on a localized germ plasm, instead relies on cell-cell interaction, namely, the epigenesis mode. For instance, the mouse PGCs arise in proximal pluripotent epiblast cells in response to bone morphogenetic protein 4 (BMP4) signaling from neighboring extra-embryonic tissues before gastrulation (Fig. 1-1) (Lawson et al., 1999; Saitou and Yamaji, 2012). Specifically, in these epiblast cells, Wnt3 together with BMP4 signaling start three transcription factors, PRDM1 (also known as BLIMP1), PRDM14, and AP2γ, which are necessary to promote the PGC fate meanwhile to repress somatic fate. (Ohinata et al., 2005; Weber et al., 2010; Yamaji et al., 2008). Intriguingly, overexpression of PRDM1, PRDM14, and AP2γ, in epiblast-like cells (EpiLCs), would be enough to induce the formation of PGC-epiblast-like cells (PGCLCs) in vitro (Nakaki et al., 2013). Thus, mouse studies have demonstrated an example that how PGCs could be specified relying on the inductive signals and zygotic transcription factors.
Fig. 1-1. Early germline cell development in mouse, C. elegans and Drosophila. The germline cells (the cell lineage that can give rise to germ cells) and PGCs (the earliest population of the cells that only develop to germ cells, like P4 and Z2/Z3 cells in C. elegans and pole cells in Drosophila) are colored with pink, while somatic cells are indicated by a white background. The developmental stages are presented below each cartoon. This cartoon is adapted from Nakamura et al., 2010 and Robert et al., 2015, with the permissions from Elsevier and Springer Nature, respectively.
C. elegans
P0 P1 ABp P4 Z2/Z3 Z2/Z3 1 cell 2 cell 4 cell 16-24 cell ~100 cell ~550 cell AB P2 EMS ABaDrosophila
Germ plasm Pole cells PGCs Stage 1-2 Stage 4-5 Stage 6-8 Stage 9-10 Stage 11-13 Stage14-Mouse
Extraembryonic ectoderm Epiblast E6.25-6.5 E7.25-7.5 E8.25 E11.5 PGCs1.2 Germline transcriptional repression in early germline cell blastomeres
Despite the fact that the mechanisms (preformation and epigenesis modes) for PGC formation differ among animal species, an emerging common keyword for germline cell development across taxa is transcriptional repression (Strome and Lehmann, 2007; Nakamura and Seydoux, 2008). Considering that the germline is a specialized cell type sustaining the totipotency to give rise to an entire new organism in the next generation, the transcriptional repression has been thought to be pivotal for protecting germline from expressing somatic genes and differentiation. Indeed, the abnormal activation of somatic developmental related genes in the germline has been shown to lead to either the apoptosis or trans-fate of developing germline cells, consequently creating a sterile phenotype (Hayashi et al., 2004; Ciosk et al., 2006; Strome and Lehmann, 2007; Nakamura et al., 2010; Strome and Updike, 2015; Pae et al., 2017; Gross-Thebing et al., 2017; Mochizuki et al., 2018).
In mouse PGC formation, one of the key functions of PRDM1, PRDM14, and AP2γ is to directly bind to and repress a set of somatic genes in PGCs (Ohinata et al., 2005; Yabuta et al., 2006; Kurimoto et al., 2008; Magnúsdóttir et al., 2013; Nakaki et al., 2013; Grabole et al., 2013). PRDM1-deficient PGC-like cells in vitro exhibit de-repression of Hox cluster genes and the abrogation of PGC-specific gene expression (Ohinata et al., 2005).
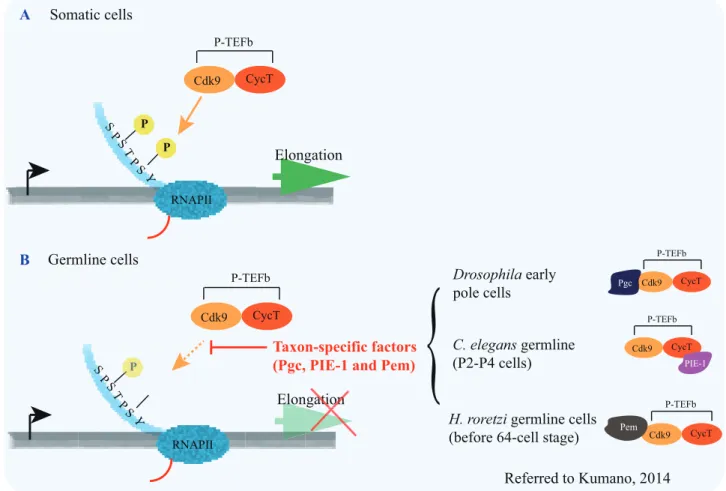
In contrast, transcription is known to be globally repressed through the inhibition of RNAP polymerase II (RNAPII) activity in germline cells during early embryogenesis of Drosophila, C. elegans and ascidians (Martinho et al., 2004; Batchelder et al., 1999; Kumano et al., 2011; Shirae-Kurabayashi et al., 2011). The carboxy-terminal domain (CTD) of the largest subunit of RNAPII (Fig. 1-2; referred to Kumano, 2014) consists of dozens of repeats of the heptapeptide consensus motif, which are subject to extensive modifications, especially phosphorylation (Brookes and Pombo, 2009; Hsin and Manley, 2012). In particular, the phosphorylation of serine 5 and serine 2 of the CTD (pSer5- and pSer2-CTD) are required for initiation and elongation of transcriptional events, respectively (Brookes and Pombo, 2009; Hsin and Manley, 2012). Interestingly, early studies in animals using the preformation way to form PGCs have shown that taxon-specific proteins, PIE-1 of C. elegans (Batchelder et al., 1999), Pgc of Drosophila (Hanyu-Nakamura et al., 2008) and Pem of H. roretzi (Kumano et al., 2011; Shirae-Kurabayashi et al., 2011), bind to and interfere with P-TEFb, a protein complex containing a kinase CDK9 phosphorylating pSer2-CTD, thereby repressing the activity of RNAPII in early germline (more detail description in Fig. 1-2) (Kumano, 2014). In the C. elegans embryo, a P4 cell is established as a PGC at the 16-24 cell stage through four successive asymmetric cell divisions of the germline blastomeres P0, P1, P2 and P3 (Fig. 1-1). During these cell divisions, the germ plasm is partitioned into the daughter germline blastomeres (P1-P4), but not somatic blastomeres AB, EMS, C and D. One protein component of the germ plasm, PIE-1, inhibits pSer2-CTD and pSer5-CTD of RNAPII (Mello et al., 1996; Seydoux and Dunn, 1997; Batchelder et al., 1999; Zhang et al., 2003); therefore, the transcription is globally repressed. In pie-1 mutant embryos, the P2 germline cell would transform into its somatic sister cell EMS (Mello et al., 1992). This transformation depends on a maternal transcription factor, SKN-1,
which is present in both EMS and P2 cell lineages. Therefore, the transcriptional repression mediated by PIE-1 is required to preserve germline cells from adopting somatic fates induced by the maternal transcription factors for somatic cell differentiation.
Fig. 1-2. RNAPII is targeted for transcriptional repression by taxon-specific factors in distantly related animals. mRNA transcription is tightly associated with the activity of RNAPII, which is critically determined by the post-translational modification of carboxy-terminal (CTD) (blue tail) of the largest subunit of RNAPII. The CTD consists of repeats of the heptapeptide consensus motif (Tyr1-Ser2-Pro3-Thr4-Ser5-Pro6-Ser7). During transcription initiation, the phosphorylation (P in yellow circles) is added on serine 5 of CTD (pSer5-CTD) and a short mRNA (red line) is produced. Later, the RNAPII is paused. (A) In somatic cells, the paused RNAPII is then phosphorylated on its serine 2 of CTD (pSer2-CTD) by P-TEFb, and the transcription elongation occurs (green arrow). (B) In early germline cells of different animals, including ascidian, C. elegans and Drosophila, weak pSer5 (P in light yellow circle) and almost no pSer2 are observed. In H. roretzi, Pem (caramel) in germline cells binds to the CDK9 (light orange) before the 64-cell stage. Consequently, the function of P-TEFb is suppressed and transcription elongation does not take place (light green arrow marked with red cross). In C. elegans early germline cells (P2-P4), PIE-1 (purple) represses transcription elongation by binding to CycT (dark orange) to interfere with P-TEFb. In Drosophila early pole cells (before stage 6-7), Pgc (dark blue) functions to obstructs transcription elongation by targeting to Cdk9.
Y S S P P T S RNAPII P P Cdk9 CycT P-TEFb Elongation RNAPII Cdk9 CycT P-TEFb Elongationatioon Somatic cells Y S S P P T S P A B Referred to Kumano, 2014 Cdk9 CycT P-TEFb PIE-1 Cdk9 CycT P-TEFb Pgc C. elegans germline (P2-P4 cells) Drosophila early pole cells Cdk9 CycT P-TEFb Pem H. roretzi germline cells (before 64-cell stage)
Taxon-specific factors (Pgc, PIE-1 and Pem)
{
1.3 Transcriptional repression after initiation of zygotic PGC program
At later stages of PGC development, the strategy to prevent ectopic somatic program in the germline by overall transcriptional repression might be inapplicable, because germline also needs to start zygotic transcription as the preparation for the PGC migration, meiosis and germ cell differentiation. When compared to the early stage of transcriptional repression in the germline described above (Fig. 1-2), the mechanism governing transcriptional regulation in later stage PGCs is poorly understood. Previous studies in C. elegans and Drosophila suggest that transcriptional regulation in the germline may switch from global transcriptional repression mediated by maternally localized repressors (PIE-1 in C. elegans and Pgc in Drosophila) to a chromatin-dependent regulation when germline cells start zygotic transcription.
In C. elegans, following the division of the P4 cell into Z2 and Z3 cells at the ~100-cell stage, PIE-1 disappears and Z2/Z3 acquire pSer2- and pSer5-CTDs of RNAPII and starts zygotic germline gene expression such as genes for oocyte differentiation (e.g. cpg-1), meiosis (e.g. xnd-1) (Schaner et al., 2003; Spencer et al., 2011). Concurrently, however, the levels of the active transcription-related chromatin modifications H3K4me2 and H3K4me3 specifically decrease in Z2/Z3 (Schaner et al., 2003; Xiao et al., 2011). Prolonged retention of the active mark was reported to result in sterility (Schaner et al., 2003; Katz et al., 2009), which is correlated with germline desilencing (Katz et al., 2009).
In Drosophila, a chromatin-related mechanism also appears to be involved in transcriptional repression even after Pgc disappears. For instance, high levels of H3K4me2 start to appear in somatic nuclei around the syncytial blastoderm stage and are maintained through the cellular blastoderm stage (Schaner et al., 2003). In contrast, the nuclei of the pole cells at the same stages do not harbor H3K4me2 but instead accumulate H3K9me2, which is correlated with an inactive chromatin state (Schaner et al., 2003; Rudolph et al., 2007). In addition, a previous functional study proved that the mutation of Osa, a component of the Swi/Snf chromatin remodeling complex, causes precocious zygotic transcription in the pole cells soon after Pgc vanishes (Martinho et al., 2004).
1.4 Germline development and transcriptional regulation in ascidian, Halocynthia roretzi
Ascidians, simple chordate animals, Halocynthia roretzi and Ciona intestinalis/robusta and savignyi, separate their germline blastomeres progressively from somatic cells during early embryogenesis (Fig. 1- 3). During the three sequential unequal cell divisions from the 8- to 64-cell stages, germline cells are featured as a pair of the smallest cells at the posterior end of the embryo. Importantly, in each of those cleavages, a subcellular structure called Centrosome-Attracting Body (CAB), morphologically similar to that of the germ plasm in other organisms with the presence of electron-dense matrixes, is inherited only by the germline (Hibino et al., 1998; Nishikata et al., 1999; Shirae-Kurabayashi et al., 2006). It is also shown that CAB situated at the posterior cortex of the germline cells pulls one of the centrosomes and the nucleus posteriorly during the interphase to promote unequal cell divisions thereby forming the smallest germline cells at the
posterior (Hibino et al., 1998; Iseto and Nishida, 1999; Nishikata et al., 1999). Molecular studies of CAB components revealed that a number of maternal mRNAs are enriched in CAB (Yoshida et al., 1996; Sardet et al., 2003; Makabe and Nishida, 2012; Paix et al., 2009). These factors associated with CAB are essential for different embryogenesis regulations, including Posterior end mark (Pem) for anterior-posterior patterning (Kumano and Nishida, 2009), germline transcriptional regulation (Kumano et al., 2011; Shirae-Kurabayashi et al., 2011) and unequal cell division (Yoshida et al., 1996; Negishi et al., 2007), Macho-1 for anterior-posterior patterning and muscle development (Nishida and Sawada, 2001; Kobayashi et al., 2003), Popk-1 for CAB formation (Sasakura et al., 2000; Nakamura et al., 2005). Besides, the localization of a conserved germline marker, Vasa mRNA and protein to CAB has been observed (Shirae-Kurabayashi et al., 2006).
In ascidians, zygotic mRNA transcription starts at the 4- to 8-cell stages in somatic blastomeres (Kumano et al., 2011; Treen et al., 2018), whereas it has been suggested in H. roretzi that zygotic germline gene expression initiates at the 110-cell to early gastrula stages (Miyaoku et al., 2018). Only a weak pSer5- and almost no pSer2-CTDs are detected in germline cells at the 8- and 16-cell stages in H. roretzi (Fig. 1-2B) (Kumano et al., 2011). In C. intestinalis, on the other hand, weaker pSer5- and pSer2-CTD signals are observed in germline cells at the 8-, 16-, 32- and 110-cell stages when compared to somatic cells (Shirae-Kurabayashi et al., 2011). The transcriptional quiescence in early germline cells at the 8- and 16-cell stages in Ciona and Halocynthia has been shown to be mediated by a maternally localized factor Pem as described above, whose mRNA and protein are enriched in CAB and the protein in germline nuclei (Kumano et al., 2011; Shirae-Kurabayashi et al., 2011). In contrast to C. intestinalis, however, an earlier study showed that pSer2-CTD in H. roretzi was detected in germline cells at the 32-, 64- and 118-cell stages at a comparable quantity to that in somatic cells (Tomioka et al., 2002). Consistent with this, while all the somatic genes tested showed ectopic expression in germline cells upon Pem knockdown at the 16-cell stage, only a subset of genes did so at the 32-cell stage (Kumano et al., 2011). In addition, the Pem protein level decreases as development proceeds apparently starting at the 32- to 64-cell stages, judging from an antibody staining (Negishi et al., 2007). These results suggest that the contribution of Pem to germline transcriptional repression becomes smaller starting at the 32- and 64-cell stages in H. roretzi embryos. A recent study unveiled the function of another maternally localized factor to CAB called Zf-1, an RNA binding protein, is responsible for down-regulating Pem protein level, thereby allowing zygotic germline gene expression at the 110-cell to early gastrula stages (Miyaoku et al., 2018).
All these observations point to a model that Pem may no longer protect germline from expressing somatic genes in H. roretzi embryos around the timing when zygotic germline gene expression commences. However, the somatic transcripts should still be faithfully repressed in the germline (Strome and Lehmann, 2007; Strome and Updike, 2015). Therefore, I was curious to determine how later germline cells distinguish the regulation of desired germline-specific genes from unfavorable somatic programs.
transcriptionally active germline at the 110-cell stage:
1) Does Pem still contribute to repressing pSer2-CTD of RNAPII and to inhibiting somatic fates in the germline at later stages?
2) Is it possible that other factors participate in protecting germline from expressing somatic transcripts in the later stage germline?
In the first chapter, I confirmed that Pem is still important for repressing the activity of RNAPII in later stage germline cells. In addition, I found that a repressive transcription related chromatin modification, H3K27me3, became evident in germline cells after the 64-cell stage, hinting that this mark may be involved in regulating germline transcription at later stages. In further experiments, I proved that both Pem and H3K27me3 are required for germline to firmly protect germline cells from getting sister cells’ transcription profiles at the 110-cell stage. Collectively, my study in a chordate animal species supports the notion that the chromatin-based transcriptional repression following the decrease of transcriptional repression by maternal factors has been repeatedly seen in different preformation species.
Fig. 1-3. The germline segregation in ascidian species. (A) Schematic diagram of ascidian embryos and an adult. Stages and views from which embryos are looked at are indicated at the top of each embryo. A, anterior. P, posterior. The germline cells (dark green) (B4.1 at the 8-, B5.2 at the 16-, B6.3 at the 32-, and B7.6 at the 64- and 110-cell stages), are gradually segregated from sister somatic cells (light green) by mean of unequal cell divisions. These two sister cells are connected by black lines. During the cleavage stages from 8- to 110-cells, the CAB (shown in red), ascidian germ plasm, is inherited by a pair of posterior-most germline blastomeres. PGCs at the tailbud stage (dark green) are located close to the tip of the tail, while after metamorphosis the germ cells (dark green) are preserved in the gonad of the adult animal. (B) Cell lineage during ascidian embryogenesis. The red line indicates the germline and the inherence of the germ plasm into germline cells (enclosed in green boxes).
B3 A3 B4.1 A4.1 a4.1 b4.1 B5.1 B5.2 B6.4 B6.3 B7.5 B7.6 PGCs Germ cells
4-cell lateral view 8-cell lateral view 16-cell vegetal view 32-cell vegetal view
110-cell vegetal view
64-cell vegetal view Tailbud lateral view Adult lateral view
A P A P P A P A A P P A P A B7.5 B7.6 B7.7 B7.8 B7.3 B7.4 B5.2 B5.1 B6.2 B6.1 B6.4 B6.3
8-cell 16-cell 32-cell
Mesenchyme, Notochord Mesenchyme Muscle Muscle 64-cell Endoderm Muscle , Heart Germ cell
B4.1
B
B4.1A
B7.5 B7.61.5 Evolutionary view of germline development
It is suggested that the epigenesis mechanism is ancestral and that the preformation mechanism is derived since the former appears to be more prevalently used across different animal species, and be also found in early branched animals such as ctenophore and cnidarian species (Extavour, 2003; Whittle and Extavour, 2017). Consistent with this convergent evolutionary scenario for preformation, key maternally localized factors necessary and sufficient for the assembly of the germ plasm in different preformation animals such as Oskar in Drosophila, PGL-1/3 in C. elegans and Bucky ball in zebrafish are all evolutionary new and taxon-specific genes (Mahowald, 2001; Shirae-Kurabayashi et al., 2006; Knaut et al., 2000; Kumano et al., 2011). Similarly, the intriguing fact that RNAPII is repeatedly chosen as a target for germline transcriptional quiescence by taxon-specific genes among distantly related animals (Pem in ascidian, PIE-1 in C. elegans and Pgc in Drosophila) (Fig. 1-2) also supports the notion that the preformation has evolved independently in different animal clades.
However, we still do not understand how mechanisms by which PGCs are formed and segregated from somatic cells during animal development have become diversified in such a way, especially considering that PGC formation is absolutely essential for the continuity of species. Previous studies indicate that mechanisms could be diversified even among ascidian species, suggesting that Tunicate species may offer us a valuable chance to study this issue. The subphylum Tunicata is comprised of three classes Ascidiacea, Appendicularia and Thaliacea. Molecular phylogenetic analysis supports the basal-most position of Appendicularia among these three groups (Wada, 1998; Swalla et al., 2000; Delsuc et al., 2018), although it is still in debate (Stach, 2005).
Previous studies with two Ascidiacea species, C. intestinalis and H. roretzi, have suggested that Pem may execute transcriptional repression by different mechanisms (Kumano et al., 2011; Shirae-Kurabayashi et al., 2011). A functional domain required for transcriptional repression activity within the H. roretzi Pem protein has been mapped onto an un-conserved sequence among different Pem orthologues (Kumano et al., 2011).
In addition, a CAB-like structure has been discovered in an Appendicularian species, Oikopleura dioica (Personal communication with Drs Nishida and Nishino at Osaka and Hirosaki Universities, respectively), hinting that O. dioica takes the preformation mode. However, Pem gene has not been found in the genome of O. dioica.
Altogether, these observations suggest an interesting possibility that even within closely-related species, factors important for PGC formation or mechanisms by which these factors function may differ, and led me to ask the following questions:
1) Does Pem from different ascidian species act differently to achieve the same goal in different ascidian species? 2) Does O. dioica use preformation or epigenesis to segregate germline?
3) Does O. dioica experience an embryonic stage when transcription is quiescent during germline development even without Pem?
In the second chapter, I first studied C. savignyi Pem showing that it has the transcriptional repression activity like other Pem genes and that function domains required for the activity between H. roretzi and C. savignyi Pems are different. In addition, I confirmed the localization of Vasa protein, a conserved germline marker among animal species, to germline cells of early O. dioica embryos, suggesting the preformation mechanism for its PGC formation. I also found that pSer5- and pSer2-CTDs were absent in germline cells at the 32-cell stage.
Collectively, my current study suggests that mechanisms by which germline transcription is repressed might be different even within closely-related species.
2. Material and Methods
2.1 Animals and embryos
2.1.1 The H. roretzi adults were purchased from local fishermen or collected near the Asamushi Research Center for Marine Biology, Aomori, Japan. To restrain H. roretzi from spawning before use, the animals were consistently kept in tanks under the light at 8°C. The spawning was induced by putting the animals under the dark for more than 6 hours followed by exposing to light for 4-5 hours in 11-13°C seawater. Eggs were fertilized by mixing with non-self-sperm. Embryos were cultured in Millipore-filtered seawater (MFSW) containing 50 mg/L streptomycin sulfate (Sigma) and 50 mg/L kanamycin sulfate (Wako) at 9-13°C.
2.1.2 The O. dioica individuals were maintained by Dr. Nishino lab at Hirosaki University. To collect eggs and sperm from O. dioica, a pair of O. dioica male and female animals at day 5 stage were selected. After several washes with clean MFSW to eliminate the sperm potentially taken from the culturing system, the animals were kept in the dish until natural spawning. The eggs and sperm were basically released after the female and male gonads burst, respectively. To fertilize these eggs, some sperm solution (about 50~100 µl) was added bit by bit into the dish containing eggs. Before fixing O. dioica embryos at the stages of interest, embryos were treated with 0.05% actinase E (Kaken) as described previously (Onuma et al., 2017) to break the vitelline membrane.
2.1.3 The C. savignyi adults were collected or kindly offered by local fishermen near the Asamushi Research Center for Marine Biology, Aomori, Japan. To restrain C. savignyi from spawning before use, the animals were consistently kept under the light in about 18°C seawater. The eggs and sperm were collected by cutting off the tunic and piercing the surface of egg duct or sperm duct with the sharp forceps. The eggs were fertilized by sperm from a different individual.
2.2 Microinjection (MO and mRNA) and GSK-126 inhibitor treatment
2.2.1 H. roretzi experiments: Pem (Harore.CG.MTP2014.S480.g14149) morpholino (Pem MO) (Kumano et al., 2011) (5-CATATTTTTCTAATGTTTTCAAGAA-3) or standard control MO (NC MO) (Gene Tool) was injected from about 25 minutes to 50 minutes after fertilization. About 250 pg Pem MO was basically injected, but a lower amount of Pem MO at about 180 pg was injected in the late spawning season (after May).
GSK-126 inhibitor (Cayman Chemical) was prepared as 14.7 mM stock and kept in DMSO at -30°C. Prior to use, the stock solution was diluted in MFSW to give a concentration of 50 µM (e.g., add 2.9 µl stock solution to 850 µl MFSW), while the same volume of DMSO was added into MFSW for a control. For collecting Pem- and H3K27me3-deficient or Pem-deficient embryos, after Pem MO injection, about half of injected embryos were randomly transferred into MFSW
containing GSK-126 and the rest of embryos were transferred to the MFSW containing DMSO. For collecting NC MO + inhibitor-treated embryos, after NC MO injection, embryos were cultured in MFSW containing GSK-126. For collecting embryos treated with inhibitor or DMSO, embryos were cultured in MFSW containing GSK-126 or DMSO, respectively.
For suppression of Macho-1 function in addition to the downregulation of Pem and H3K27me3, about 25 pg EnR -Macho-1 mRNA (Sawada et al., 2005; Kumano et al., 20-Macho-10) together with about 250 pg (or about -Macho-180 pg) Pem MO were injected into fertilized eggs. After injection, the embryos were cultured in MFSW containing 50 µM GSK-126 inhibitor. For the positive control experiment (Pem- and H3K27me3 double knockdown), the same batch of embryos were only injected with about 250 pg (or about 180 pg) Pem MO and then cultured in MFSW containing 50 µM GSK-126 inhibitor. The same batch of embryos only treated with GSK-126 inhibitor were used as the negative control.
For Pem functional domain experiment, about 40 pg of mRNAs synthesized from different C. savignyi Pem deletion constructs were injected into fertilized eggs. In addition, mRNAs for injection in this study were synthesized with the mMessage mMachine kit (Ambion) and the poly (A) was added to the 3’ end of the synthesized mRNAs using the poly A tailing kit (Ambion), according to the manufacturer’s instructions.
2.2.2 Microinjection with C. savignyi: Before injection, the unfertilized eggs were treated with the pre-dechorionation solution containing 0.05% actinase E and 1% Sodium thioglycolate (Sigma) for about 15 minutes to remove the follicle cells. Next, after several washes with MFSW, the eggs lacking follicle cells were transferred onto a cover glass that is placed on a petri dish filled with MFSW. Without the follicle cells, sticky eggs were able to be fixed on the surface of cover glass during the injection. In the present study, about 4 pg of each mRNA synthesized from different C. savignyi Pem deletion constructs was injected. After injection, the embryos were cultured in MFSW. Before fixation with 4% PFA in fixation buffer (0.5 M NaCl, 0.1 M MOPS, pH 7.5) at the 16-cell stage, the embryos were treated with dechorionation solution (e.g., 12 mL pre-dechorionation solution with 100 µl 2.5N NaOH) in agarose-coated petri dish (1% agarose in MFSW) for about 5 to 10 minutes to remove the chorion. During the treatment, the embryos were softly touched or pipetted to accelerate the removal of the chorion.
2.3 Construction of expression vectors for in vitro mRNA transcription
Ciona savignyi Pem (Yoshida et al., 1996) plasmid (Cs-Pem in pBS) was kindly offered by Dr. Satou at Kyoto University. To generate the in vitro expression vector for C. savignyi Pem, the full length of Pem coding sequence was amplified from Cs-Pem in pBS plasmid using the primer named as ‘C. savignyi Pem in vitro expression vector’ (in Table 2-1). And the PCR product was then cloned into EcoRI/NotI sites of the pBSRN3 vector (Lemaire et al., 1995). To make the deletion constructs lacking domain 1 to 5 (described in chapter 2), invert PCRs using KOD Plus (Toyobo) were carried out. For
invert PCRs, Cs-Pem in pBS was used as template DNA, while the primers listed in Table 2-1, named as C. savignyi Pem deletion construct 1-5, were used. The PCR products were then self-ligated using the T4 Polynucleotide Kinase (Takara) and DNA Ligation Kit (Takara) according to the manufacturer’s instructions. The successful construction of different deletion constructs was finally confirmed by sequencing from T3 promoters prior to the inserted sequences in pBSRN3 and by sequencing from the middle of Pem coding DNA sequence using a primer named as ‘C. savignyi Pem sequencing primer’ in table 2-1.
2.4 Immunostaining
2.4.1 The immunostaining experiments for H. roretzi embryos were performed as described in Kumano et al., 2011, with the following modifications: (1) the embryos were fixed overnight (over 16 hours) with 4% PFA in fixation buffer (0.5 M NaCl, 0.1 M MOPS, pH 7.5). (2) For H. roretzi, the H5 antibody against pSer2-CTD of RNAPII (Kumano et al., 2011; Tomioka et al., 2002) was diluted at 1: 5000. In addition, the H3K27me3 antibody (abcam, EPR18607), H3K4me3 antibody (abcam, ab8580) and DNA methylation antibody (abcam, ab73938) were used at 1: 5000. The H3K4me2 antibody (abcam, ab32356), H3K9me3 antibody (abcam, EPR16601) and H3K9me2 antibody (abcam, ab32521) were used at 1:1000.
2.4.2 The immunostaining experiments for O. dioica embryos were conducted as described in Kumano et al., 2011, with the exceptions that H5 antibody was used at 1:1000, H14 antibody against pSer5-CTD of RNAPII was used at 1:500 (Kumano et al., 2011). In addition, immunostaining experiments with different histone modifications were also carried out using a protocol as same as the one used for H14 antibody staining in Kumano et al., 2011. H3K27me3 and H3K9me3 antibodies were used at the concentration of 1:1000. The H3K4me2 antibody was used at 1:500.
2.4.3 Vasa antibody staining for O. dioica: The embryos were fixed in 4% PFA in fixation buffer (0.5 M NaCl, 0.1 M MOPS, pH 7.5) at room temperature for 1 hour or at 4°C overnight. Then the samples were washed with PBS, 0.1% Triton X-100 (PBSTr) about 5 times (5 minutes each), followed by PBS wash for 5 minutes. The embryos were then blocked in 0.5% blocking reagent (Roche) in PBS at room temperature for 1 hour. After blocking, the samples were incubated in 1/200 guinea pig anti-CiVH antiserum in the blocking solution at room temperature for 1 hour or at 4°C overnight. After the antibody reaction, the samples were washed with PBSTr for 5 times (5 minutes each), followed by PBS wash for 5 minutes. Next, the samples were incubated in 1/500 Alexa 594-conjugated anti-guinea pig IgG antibody (Invitrogen) at room temperature for 1 hour or at 4°C overnight. Then, wash the samples in PBSTr 5 times (5 minutes each). The Vasa antibody was kindly given by Dr. Shirae-Kurabayashi at Nagaya University (Shirae-Kurabayashi et al., 2011).
2.4.4 The immunostaining experiments for C. savignyi embryos were conducted with a protocol for H. roretzi immunostaining that was described in Kumano et al., 2011, with the exceptions that H5 antibody was used at 1:1000.
2.5 SYTOX nuclear staining
After the immunostaining experiments, the samples were washed in Solution A (0.5 M NaCl, 5 mM EDTA, 10 mM Tris 0.1% Tween 20, pH 8.0) for 5 minutes, followed by treatment with 100 µg/mL RNase A in solution A for 1 hour at 37°C. Samples were washed with Tris Buffer (0.15 M NaCl, 0.05 M Tris, pH 7.4) for 3 times (5 minutes each). After washes, the nuclei were stained with SYTOX dye at the concentration of 2 µM, followed by washing with Tris Buffer 3 times (5 minutes each).
2.6 Mounting and quantification of fluorescent intensity
The specimens were mounted in 80% glycerol in PBS and observed with confocal microscope LSM5 PASCAL (ZEISS). For quantifying pSer2-CTD and H3K27me3 signals in nuclei, the confocal Z stack fluorescent images containing only germline nuclei (or nuclei of B7.5 cells and nerve cord cells in Fig. 3-4C) were created by average-intensity method. The area of nuclei was selected using a polygon selection tool in ImageJ. The fluorescent intensities were then quantified with the measurement tool in ImageJ. All the pictures compared in the same experiment were taken under the same conditions. The relative H3K27me3 or pSer2-CTD signal was defined as the intensity of H3K27me3 or pSer2-CTD signal in a nucleus divided by the SYTOX nuclear signal intensity of the same nucleus. Then differences in relative intensity were compared using the Mann–Whitney U test.
2.7 Whole-mount in situ hybridization
Whole-mount in situ hybridization for H. roretzi and C. savignyi embryos was performed using digoxigenin-labeled probes as previously described (Wada et al., 1995). To make the antisense probe for H. roretzi Tbx6 (Harore.CG.MTP2014.S461.g12970 in Aniseed database: https://www.aniseed.cnrs.fr/aniseed/), a 683 bp fragment of Tbx6 CDS sequence was amplified using a plasmid containing full Tbx6 CDS sequence as a template (Kumano et al., 2014). The PCR product was cloned into the pGEM-T Easy vector (Promega). The plasmid DNA was then digested with SaiI and served as a template for in vitro transcription using T7 RNA polymerase (Roche). The Tbx6 probe was used at about 0.8 ng/µl. To synthesize the antisense probe for H. roretzi Mesp gene (Harore.CG.MTP2014.S97.g06901 in Aniseed database), a 539 bp fragment of CDS sequence was amplified using cDNA prepared with early gastrula stage embryos as a template. The PCR product was cloned into the pGEM-T Easy vector and the plasmid DNA was then digested with NcoI and served as a template for in vitro transcription using Sp6 RNA polymerase (Roche). The working concentration of the Mesp probe was used at about 0.64 ng/µl.
For making probe for Mhc-1 (GenBank: D45163.1) and different PRC2 components (unique gene ID in Aniseed database for each component is shown in figure legend of Fig. 3-5), the PCR products obtained in the RACE experiment using SMARTer™ RACE cDNA Amplification Kit (Clontech) were cloned into pGEM-T Easy. The cDNA prepared from early gastrula stage embryos were used as templates for RACE experiments. For the Mhc-1 antisense probe, an about 932 bp fragment (about 716 bp of CDS and 216 bp of 3’ UTR) acquired from RACE experiment was cloned into the pGEM-T Easy vector. pGEM-The plasmid DNA was then digested with SalI and served as template for in vitro transcription using pGEM-T7 RNA polymerase. The Mhc-1 probe was used at about 0.5 ng/µl. For making the Ezh antisense probe, a 945 bp fragment (865 bp of CDS and 80 bp of 5’UTR) obtained from the RACE experiment was cloned into the pGEM-T Easy vector. The plasmid DNA was then digested with NcoI and served as template for in vitro transcription using Sp6 RNA polymerase. The Ezh antisense probe was used at about 0.41 ng/µl. For making Ezh sense probe, the plasmid DNA was then digested with PstI and served as template for in vitro transcription using T7 RNA polymerase. The Ezh sense probe was used at about 0.43 ng/µl. For making the Suz12 antisense probe, a fragment longer than 1114 bp obtained from the RACE experiment was cloned into the pGEM-T Easy vector. The plasmid DNA was then digested with SacI and served as the template for in vitro transcription using T7 RNA polymerase. The Suz12 antisense probe was used at about 0.31 ng/µl. For making the Rbbp4/7-r.a antisense probe, an about 793 bp fragment (about 772 bp of CDS and 21 bp of 5’UTR) obtained from the RACE experiment was cloned into the pGEM-T Easy vector. The plasmid DNA was then digested with NcoI and served as a template for in vitro transcription using Sp6 RNA polymerase (Roche). The Rbbp4/7-r.a antisense probe was used at about 0.41 ng/µl. For making the Rbbp4/7-r.b antisense probe, an about 918 bp fragment (about 783 bp of CDS and 135 bp of 5’UTR) obtained from the RACE experiment was cloned into the pGEM-T Easy vector. The plasmid DNA was then digested with NcoI and served as a template for in vitro transcription using Sp6 RNA polymerase. The Rbbp4/7-r.b antisense probe was used at about 0.37 ng/µl. For making the Eed antisense probe, an about 951 bp fragment (about 943 bp of CDS and 8 bp of 5’UTR) obtained from the RACE experiment was cloned into the pGEM-T Easy vector. The plasmid DNA was then digested with NcoI and served as a template for in vitro transcription using Sp6 RNA polymerase (Roche). The Eed antisense probe was used at about 0.37 ng/µl.
The vectors for making probes of the following genes were kindly offered by Pro. Nishida at Osaka University: MA4 (GenBank: BAA00956.1) (Restriction enzyme: BamHI; RNA polymerase: T7; probe working concentration: 0.44 ng/µl) (Kusakabe et al., 1991), Clone 22 (Restriction enzyme: NotI; RNA polymerase: T7; probe working concentration: 0.25 ng/µl) (Tomioka et al., 2002), Brachyury (GenBank: BAA03910.1) (Restriction enzyme: HindIII; RNA polymerase: T3 (Roche); probe working concentration: 0.4 ng/µl) (Mitani et al., 1999; Kumano and Nishida, 2009) and ETR-1 (GenBank: BAB40781.1) (Restriction enzyme: BamHI; RNA polymerase: T7; probe working concentration: 0.44 ng/µl) (Yagi and Makabe, 2001; Kobayashi et al., 2003), FoxD (Harore.CG.MTP2014.S128.g04021 in Aniseed database) (Restriction enzyme: NotI; RNA polymerase: T7; probe working concentration: 0.4 ng/µl) (Kumano et al., 2006).
polymerase: T7; probe working concentration: 0.2 ng/µl) and FoxA probe (GenBank: BAB16313.1) (Restriction enzyme: NotI; RNA polymerase: T7; probe working concentration: 0.2 ng/µl) (Imai et al., 2002) were provided by Dr. Satou at Kyoto University.
After in situ hybridization, the nuclei were stained with SYTOX dye to facilitate the better recognition of blastomeres. The specimens were mounted and observed with microscope BX51(Olympus).
2.8 Blast search and phylogenetic analyses
Molecular phylogenetic analyses were carried out with full-length amino acid sequences of Mesp, and core PRC2 components. The putative sequences of Mesp and PRC2 components in H. roretzi genome were obtained by BLASP search in ascidian genome database Aniseed (https://www.aniseed.cnrs.fr/aniseed/) using the Ciona sequence (Mesp) or mouse/human sequences (PRC2 components) as queries. NCBI (https://www.ncbi.nlm.nih.gov/pubmed/) was used to search for genes of interest in different animals.
Sequence alignment were conducted with the MUSCLE algorithm which is offered in the Molecular Evolutionary Genetics Analysis (MEGA 7) software. GAPs produced after alignments were manually deleted. For constructing the phylogenetic tree, the neighboring-joining method was used. Bootstrap replications (1000 replications) were conducted to estimate the reliability of trees. The bootstrap percentage was shown as the number at each internal node.
2.9 Primers
Table. 2-1 Primers used in the current study. GSP: Gene Specific Primer. nGSP: nested Gene Specific Primer.
H. roretzi Tbx6 Sense: GGTTCGAAGTGGATGAGCGA
Antisense: GTGATGCCGTTCTGGGTGTA
H. roretzi Mesp Sense: TTATCAGATTTACCAGTATAG
Antisense: TAAATTACCACAATATGAATC
Nested PCR-sense: GGAACAGACAAGTACATCCA
H. roretzi Mhc-1 GSP: ACTTGGGCATGCAACACGACAAGCTTCTGA (3’ RACE)
nGSP: CCGCTCTTGAACAAGCGGAACGAGGAAGA (3’ RACE)
H. roretzi Ezh GSP: CTCCACAGGCTTCATTACCAGGCTTT (5’ RACE)
nGSP: GCTCTCTCTGCACCGACTTTGCATTA (5’ RACE)
H. roretzi Suz12 Gsp: CCCGGCTGGCTGAAAATGTTTTGCGGA (5’ RACE)
nGSP: CTCTGCCCCCATCGAACGATTCCCACA (5’ RACE) H. roretzi Rbbp4/7-r.a GSP: GCAGTTAACCTCGGCTGTGTGTGCCT (5’ RACE)
nGSP: TGGTCGTCAGCCACCGATCCGAACAA (5’ RACE) H. roretzi Rbbp4/7-r.b GSP: CGGTTTTATCCGAGGACCCGGTAGCGA (5’ RACE) nGSP: CGTGGGCTACGATCGCGTGAATAGGT (5’ RACE)
H. roretzi Eed GSP: GCCATATTGGTTTCCGAGAGCCAGA (5’ RACE)
nGSP: AGCCAGGTTTCCAACAGACCAAGTG (5’ RACE) C. savignyi Pem in vitro expression Sense: CCGGAATTCCCACCATGAAGATGGTGGTGG
vector Antisense: ATAAGAATGCGGCCGCCTAGCACCATGGCC
C. savignyi Pem deletion construct 1 Sense: TACGGTTTGACTGCAAGTCCAAAC Antisense: AGATTCCGTCAATGGCACCAC C. savignyi Pem deletion construct 2 Sense: TCAGCGAGTCGGCGATCG
Antisense: GTTTCGCGAAGACGCGACAA C. savignyi Pem deletion construct 3 Sense: ACAAAATCCAGTGGAAGATACAGTCG
Antisense: CGGAGCGTAGTTGTAAGTGAACTG C. savignyi Pem deletion construct 4 Sense: AAACGACTGCTGCTGAACGAAA
Antisense: GGTGTTTTGAGACTTCCCGCTG C. savignyi Pem deletion construct 5 Sense: GGCGCATCGGAGTTCACTTCAG
Antisense: GCGCCTATCACTGGAGACACC C. savignyi Pem sequencing primer GCAGAGAGTCCATTCACCCCGAATCGACA
Chapter 1 Germline transcriptional regulation in H. roretzi
3. Results
3.1 Pem still represses pSer2-CTD of RNAPII in the germline of ascidian embryos at later stages
Previous work showed that Pem represses somatic gene expression in early germline blastomeres (B3 at the 4-cell, B4.1 at the 8-cell, B5.2 at the 16-cell) by inhibiting pSer2-CTD of RNAPII and transcriptional elongation in H. roretzi (Kumano et al., 2011). Pem knockdown resulted in the de-repression of pSer2-CTD of RNAPII and somatic gene expression in germline cells before the 32-cell stage. However, fewer somatic genes were ectopically expressed in Pem-morphant germline at the 32-cell stage compared to the 16-cell stage as mentioned in the introduction section, hinting that contribution of Pem to transcriptional repression decreases over the period. In addition, another study reported that later embryonic germline cells (B6.3 at the 32-cell, B7.6 at the 64-cell and B7.6 at around the 118-cell stages) showed comparable levels of positive pSer2-CTD to the somatic cells (Tomioka et al., 2002). Thus, it was curious whether Pem still represses pSer2-CTD of RNAPII after the 32-cell stage.
As a first step to study this issue, here I re-examined the pSer2-CTD of RNAPII at the 16- and 110-cell stages using a new antibody staining method (used a different fixation method and a different type of secondary antibody compared to Tomioka et al., 2002). As previously reported, I confirmed that pSer2-CTD of RNAPII was detected in somatic cells (yellow arrows in Fig. 3-1B) but not in the germline at the 16-cell stage (0%, n = 13; white arrows in Fig. 3-1B) (Kumano et al., 2011). In contrast, 110-cell stage germline displayed a recognizable but weak pSer2-CTD signal (when compared to that in somatic cells) (50%, n = 14; red arrows in Fig. 3-1D). This is consistent with a reported decreased amount of Pem protein (Negishi et al., 2007). I also noticed that the detection of positive pSer2-CTD signal seems to be affected by cell cycle, as I have not seen positive signals in anaphase nuclei (purple arrows in Fig. 3-1C, D; whereas the same blastomere not undergoing cell division in a different embryo showed positive pSer2-CTD, green arrows in Fig. 3-1E, E’). Considering that germline cells at the 110-cell stage are not undergoing cell division (Nishida, 1986; Shirae-Kurabayashi et al., 2006), the absence of or lower pSer2-CTD in germline cells may indicate that pSer2-CTD at later stages of embryonic germline was still under repression.
To test the above hypothesis, I tried to knock down Pem by injecting fertilized eggs with a Pem morpholino (MO) and then checked whether CTD of RNAPII in the germline would be enhanced or not. Ectopic germline pSer2-CTD was observed in the 16-cell stage germline cells of embryos injected with about 200 pg of Pem MO (61.5%, n = 13; red arrow in Fig. 3-2) as previously reported, validating the Pem knockdown effect in our experiment. Next, I checked pSer2-CTD levels in germline cells of Pem-morphant at the 110-cell stage. I noticed that stronger pSer2-CTD was detected in the germline of Pem knocked down embryos, when compared to that in the germline cells of un-injected or
negative control MO (NC MO) injected embryos (red arrows in Fig. 3-1E’’, F’’, G’’). This increased germline pSer2-CTD in the 110-cell stage Pem morphant was also confirmed by quantifying the average pSer2-pSer2-CTD signal (Fig. 3-1H). Thus, the results indicated that Pem still represses the activity of RNAPII at the later embryonic stage, around the timing when zygotic germline gene expression starts (Miyaoku et al., 2018).
Fig. 3-1. Pem represses pSer2-CTD of RNAPII in the germline at the 110-cell stage. (B, D, E’, E’’, F’, F’’, G’, G’’) Immunostaining of the 16-cell stage (B) and 110-cell stage (D, E’, E’’, F’, F’’, G’, G’’) embryos with the antibody against pSer2-CTD of RNAPII. (A, C, E, F, G) All nuclei were stained with SYTOX dye. Vegetal hemispheres of representative embryos are shown with anterior up in the confocal Z-stack maximum projection. (B, D) Numbers in the lower right corner of the panels show the numbers of embryos with positive germline pSer2. (B) The yellow arrows indicate the positive pSer2-CTD in somatic nuclei. (B, D, E’’, F’’, G’’) The white and red arrows indicate the negative and positive pSer2-CTD in germline nuclei, respectively. (C, D, E) The purple arrows indicate a somatic cell undergoing cell division, in which the positive pSer2-CTD was not observed, while the green arrows indicate that the same somatic cell with positive pSer2-CTD, which was not undergoing cell division in another embryo. (E’’, F’’, G’’) Closer views of posterior regions with red arrows indicating the positive pSer2-CTD signals in germline cells. Scale bar, 100 µm. (H) Quantification of fluorescent intensities in the germline nuclei of embryos in (E’, F’, G’). The vertical scale indicates the relative pSer2-CTD signal intensity to the SYTOX nuclear staining intensity. The horizontal scale indicates the different experimental groups. Each circle on in bar graph represents a blastomere. The numbers of blastomeres examined are shown on the bar boxes. Differences in relative intensity were analyzed by the Mann–Whitney U test. ns, no significant difference. Error bars (red) indicate 95% confidence intervals.
Fig. 3-2. Pem MO injection de-represses the pSer2-CTD of RNAPII in the 16-cell stage germline cells. (A’, B’) Immunostaining of the 16-cell stage embryos with an antibody against pSer2-CTD of RNAPII. (A, B) All nuclei were stained with SYTOX dye. Vegetal hemispheres of representative embryos are shown with anterior up in the confocal Z-stack maximum projection. (A’, B’) Numbers in the lower right corner of panels show the numbers of embryos with positive germline pSer2-CTD of RNAPII. Yellow arrows and red arrows indicate the negative and positive pSer2-CTD signals in the germline, respectively. Scale bar, 100 µm.
3.2 H3K27me3 is enriched in the later ascidian embryonic germline
Data in Fig. 3-1 suggest that Pem still functions to repress the activity of RNAPII in later stage germline cells. However, according to the preliminary observations, the percentage of embryos showing ectopic somatic gene expression in the germline cells upon Pem knockdown was low, suggesting that there might be another factor(s).
In eukaryotic organisms, gene expression regulation is not limited to the modulation of the transcriptional machinery, in addition, at least the DNA methylation as well as posttranslational modifications on the histone play important role in the regulation of gene activity (Moore et al., 2013; Zhang et al., 2015). In present study, to screen whether other factor(s) may also contribute to germline transcriptional regulation at later stages, I conducted immunostainings with antibodies against DNA methylation and histone modifications, including the heterochromatin marks, H3K9me2 and H3K9me3; the active chromatin modifications, H3K4me2 and H3K4me3; and a repressive transcription mark, H3K27me3. I expected to see whether any marks would show different patterns between germline and somatic cells, and between the early and later stages.
Collectively, with my current experiments, DNA methylation and H3K9me2 were barely detected in whole embryo at all the stages tested (from the 16-cell to 110-cell stages), while there was almost no difference between germline and somatic cells and between early and late stages in terms of staining intensities of H3K9me3 (from 32- to 110 cell stages) and H3K4m2/3 (from 32-cell stage to early gastrula stages) (Table. 3-1) (Fig. 3-3; and data not shown). Given the observations discussed below, in the current study, I was interested in testing the possible involvement of H3K27me3 in regulating germline transcription.
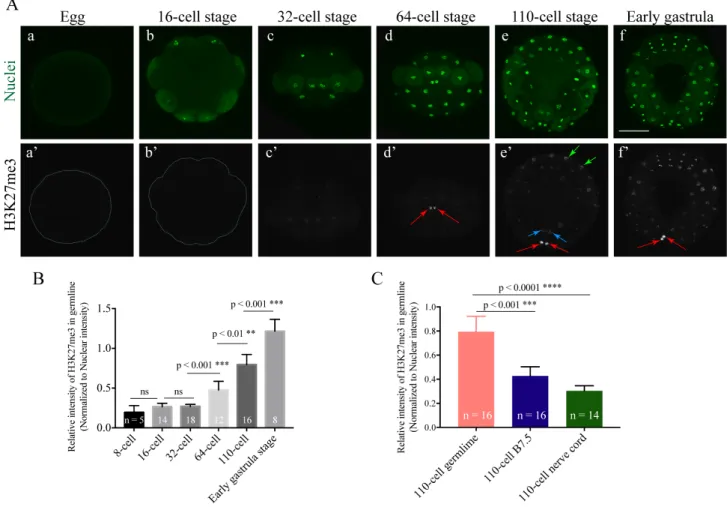
Under the current immunostaining condition, the faint H3K27me3 started to appear in some vegetal hemisphere blastomeres, including germline at the 16- to 32-cell stages (Fig. 3-4Ab, b’, c, c’). From the 64-cell stage onwards, the intensity of H3K27me3 signal markedly increased in the germline (red arrows in Fig. 3-4Ad’, e’, f’), while its level in somatic cells at vegetal side also increased (blue and green arrows in Fig. 3-4Ae’, f’). The intensive increase of germline signals was further confirmed by assessing the average intensities of signal from confocal Z-stack fluorescent images (Fig. 3-4B). Importantly, the germline cells showed the highest levels of H3K27me3 among all the blastomeres at the 110-cell stage (Fig. 3-4C). Germline cells, B7.5 cells (sister cells of germline) and nerve cord cells showed relatively higher H3K27me3 signal intensities than the other cells at the 110-cell stage, therefore I specifically quantified the H3K27me3 signal intensities in these three lineages (Fig. 3-4C). Given that H3K27me3 is a repressive transcription related mark, its enrichment in later embryonic germline implies its potential role in repressing transcription there.
Early 16-cell 32-cell 64/110-cell H3K4me2/3 Soma +/- +++ +++ Germline +/- +++ +++ H3K9me3 Soma ++ +++ +++ Germline ++ +++ +++ H3K9me2 Soma - - - Germline - - -
DNA methylation Soma - - -
Germline - - -
H3K27me3 Soma - +/- +/-
Germline - +/- ++
Table. 3-1 Summary of immunostaining against histone modifications and DNA methylation. The symbols ‘-’ indicate that the signal was none or almost undetectable, ‘+/-’ barely detectable, ‘++’ clearly observed and ‘+++’ detected strongly.
Fig. 3-3. Germline cells harbor H3K4me2/3, H3K9me3 at similar intensities to that in somatic cells at the 32-cell and the 110-cell stages, while H3K9me2 and DNA methylation are barely detected in all the blastomeres. (A’-E’) Immunostaining of the 32-cell stage embryos with the antibody against H3K4me3 (A’), H3K4me2 (B’), H3K9me3 (C’), H3K9me2 (D’) and DNA methylation (E’). (A’’’-E’’’) Immunostaining of the 110-cell stage embryos with antibody against H3K4me3 (A’’’), H3K4me2 (B’’’), H3K9me3 (C’’’), H3K9me2 (D’’’) and DNA methylation (E’’’). (A-E, A’’-E’’) All nuclei were stained with SYTOX dye. Vegetal hemispheres of representative embryos are shown with anterior up. White arrows indicate the positions of the germline. Scale bar, 100 µm.
Fig. 3-4. H3K27me3 is enriched in later embryonic germline cells of H. roretzi. (Aa’-f’) Immunostaining of H3K27me3 in representative embryos at different stages. (Aa-f) All nuclei were stained with SYTOX dye. Vegetal views are shown for 16- and 110-cell, and early gastrula stage embryos with anterior up. Posterior views are shown for 32- and 64-cell stage embryos. Red arrows indicate the clear positive H3K27me3 signals in the germline, while the blue and green arrows indicate signals in B7.5 and nerve cord (A8.8, A8.15) cells, respectively. Scale bar, 100 µm. (B) Quantification of H3K27me3 fluorescent signal intensities in the germline nuclei of embryos from 8-cell to early gastrula stages. (C) Quantification of H3K27me3 fluorescent signal intensities in the nuclei of the germline, B7.5, and nerve cord (A8.8 and A8.15) cells in the 110-cell stage embryos. The vertical scale indicates the relative H3K27me3 intensity normalized to the SYTOX nuclear staining. The numbers on the columns indicate the numbers of blastomeres measured. The horizontal scale represents the stages. Differences in H3K27me3 relative intensity were analyzed by the Mann–Whitney U test. ns, no significant difference. Error bars indicate 95% confidence intervals.
3.3 The mRNAs of the core PRC2 components in H. roretzi are maternally supplied
H3K27me3 is catalyzed by a conserved complex called PRC2 (Lee et al., 2006; Simon and Kingston, 2009; Prokopuk et al., 2017), which comprises four core components: EZH1/2, SUZ12, EED, RBBP4/7 in human (Margueron and Reinberg, 2011). With an attempt to understand the mechanism of the enrichment of H3K27me3 in the later ascidian embryonic germline cells, I decided to clone these core components from H. roretzi. Taking the sequences from human as queries, I used BLAST to search for H. roretzi orthologs of core PRC2 components in the H. roretzi genome. Finally, I got two copies of RBBP4/7, namely Rbbp4/7-r.a and Rbbp4/7-r.b. For other components, I found a single hit for each, referring to as Ezh, Suz12, and Eed, respectively. These components were further confirmed as H. roretzi orthologues by phylogenetic analyses (Fig. 3-5) in addition to the BLAST search.
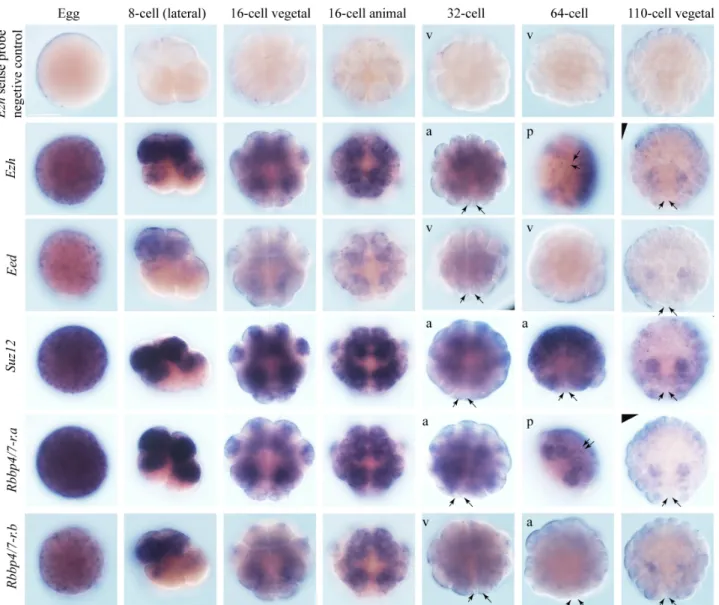
Then the whole-mount in situ hybridization was carried out to study the expression pattern of these components, and results showed the following key observations (Fig. 3-6): (1) All of them showed high expression in eggs, suggesting that they are maternally supplied transcripts. Additionally, they showed a quite similar expression pattern; (2) No mRNAs for these core components were specially enriched in the germline at all stages analyzed. Conversely, germline cells seemed to have weaker signals than other cells; (3) These transcripts all became more enriched in the animal than vegetal hemispheres at the 8 to 16-cell stages; (4) No increased levels of mRNAs were observed in germline cells at the stages when germline H3K27me3 became increased. Thus, I was not able to find out how H3K27me3 becomes enriched in germline from mRNA distributions of PRC2 core components. Therefore, the protein localization study will be needed in the future to understand the mechanism by which H3K27me3 becomes enriched in germline cells.
(Figure legend is on the next page.)
Mus-musculus-RBBP4
histone-binding protein RBBP4 isoform a Homo sapiens Mus-musculus-RBBP7
histone-binding protein RBBP7 isoform 1 Homo sapiens chromatin assembly factor 1 p55 subunit Drosophila melanogaster Harore.CG.MTP2014.S14.g04532.01.p
FullProbable histone-binding protein lin-53 Caenorhabditis elegans Harore.CG.MTP2014.S12.g03265.01.p
FullProbable histone-binding protein rba-1 Caenorhabditis elegans lethal (2) 09851 isoform B Drosophila melanogaster
glutamate-rich WD repeat-containing protein 1 Homo sapiens glutamate-rich WD repeat-containing protein 1 Mus musculus
Harore.CG.MTP2014.S13.g06622.01.p 100 100 100 91 86 100 100 100 88 65 0.10 A B C D
polycomb protein EED isoform c Homo sapiens polycomb protein EED Mus musculus embryonic ectoderm development Xenopus laevis
Harore.CG.MTP2014.S326.g09247 extra sex combs Drosophila melanogaster Polycomb protein EED Hydra vulgaris
Polycomb protein mes-6 Caenorhabditis elegans
guanine nucleotide-binding protein subunit beta-4 Homo sapiens guanine nucleotide binding protein beta2 subunit Mus musculus
guanine nucleotide-binding protein G(I)/G(S)/G(T) subunit beta-2 Homo sapiens
95 100 99 80 85 100 100 0.20
histone-lysine N-methyltransferase EZH1 Mus musculus histone-lysine N-methyltransferase EZH1 isoform 1 Homo sapiens histone-lysine N-methyltransferase EZH2 isoform 1 Mus musculus histone-lysine N-methyltransferase EZH2 isoform a Homo sapiens
Harore.CG.MTP2014.S59.g15552
enhancer of zeste isoform C Drosophila melanogaster Histone-lysine N-methyltransferase mes-2 Caenorhabditis elegans
Harore.CG.MTP2014.S19.g05532 SETD1A protein partial Homo sapiens
Setd1a protein partial Mus musculus
100 100 100 100 100 96 97 0.20 Ezh Eed Suz12
Suppressor of zeste 12 homolog Homo sapiens Suppressor of zeste 12 homolog Mus musculus
suppressor of zeste 12 Xenopus laevis Harore.CG.MTP2014.S68.g10825 Su(z)12 isoform B Drosophila melanogaster Polycomb protein SUZ12 partial Hydra vulgaris
Eea1 protein partial Mus musculus
early endosome antigen 1 isoform X1 Homo sapiens 100 100 100 57 92 0.20
Second blast hit
.01.p
.01.pRbbp4/7-r.b
Rbbp4/7-r.a
Fig. 3-5. Phylogenetic analyses of putative core PRC2 components in H. roretzi. Phylogenetic trees were constructed by the Neighbor-Joining method for putative PRC2 core components (A) Ezh, (B) Eed, (C)Suz12 and (D) Rbbp 4/7-r.a and Rbbp 4/7-r.b found in H. roretzi (enclosed in red boxes). The sequences enclosed in blue boxes are the second or third closest hits that appeared during BLAST studies. The GeneBank accession numbers of the genes: NP_001261682.1 (Drosophila melanogaster enhancer of zeste, isoform C), NP_496992.3 (Caenorhabditis elegans Histone-lysine N-methyltransferase mes-2), NP_031997.2 (Mus musculus histone-lysine N-N-methyltransferase EZH2 isoform 1), NP_031996.1 (Mus musculus histone-lysine methyltransferase EZH1), NP_001982.2 (Homo sapiens histone-lysine N-methyltransferase EZH1 isoform 1), NP_004447.2 (Homo sapiens histone-lysine N-N-methyltransferase EZH2 isoform a), AAH27450.1 (Homo sapiens SETD1A protein, partial), AAH42890.1 (Mus musculus Setd1a protein, partial). The unique gene ID in Aniseed: Harore.CG.MTP2014.S59.g15552 (H. roretzi Ezh), Harore.CG.MTP2014.S19.g05532 (H. roretzi the second-best hit found in BLASTP search).
NP_001294936.1 (Homo sapiens polycomb protein EED isoform c), CDG71776.1 (Hydra vulgaris Polycomb protein EED), NP_068676.1 (Mus musculus polycomb protein EED), NP_001021320.1 (Caenorhabditis elegans Polycomb protein mes-6), CAD19130.1 (Xenopus laevis embryonic ectoderm development), AAA86427.1 (Drosophila melanogaster extra sex combs), BAB19816.1 (Mus musculus guanine nucleotide binding protein beta2 subunit), NP_067642.1 (Homo sapiens guanine nucleotide-binding protein subunit beta-4), NP_005264.2 (Homo sapiens guanine nucleotide-binding protein G(I)/G(S)/G(T) subunit beta-2); The unique gene ID in Aniseed: Harore.CG.MTP2014.S326.g09247 (H. roretzi Eed).
NP_730465.1 (Drosophila melanogaster Su(z)12, isoform B), NP_001165346.1 (Xenopus laevis suppressor of zeste 12), AAH64461.1 (Mus musculus Suppressor of zeste 12 homolog), AAH15704.1 (Homo sapiens Suppressor of zeste 12 homolog), CDG70008.1 (Hydra vulgaris Polycomb protein SUZ12, partial), AAH21363.1 (Mus musculus Eea1 protein, partial), XP_011537116.1 (Homo sapiens early endosome antigen 1 isoform X1). The unique gene ID in Aniseed: Harore.CG.MTP2014.S68.g10825 (H. roretzi Suz12).
NP_033057.3 (Mus musculus RBBP7), NP_033056.2 (Mus musculus RBBP4), NP_005601.1 (Homo sapiens RBBP4 isoform a), NP_001185648.1 (Homo sapiens RBBP7 isoform 1), AAF55146.1 (Drosophila melanogaster chromatin assembly factor 1, p55 subunit), NP_492551.1 (Caenorhabditis elegans histone-binding protein rba-1), NP_492552.1 (Caenorhabditis elegans histone-binding protein lin-53), NP_001260713.1 (Drosophila melanogaster lethal (2) 09851, isoform B), NP_113673.3 (Homo sapiens glutamate-rich WD repeat-containing protein 1), NP_700468.2 (Mus musculus glutamate-rich WD repeat-containing protein 1). The unique gene ID in Aniseed: Harore.CG.MTP2014.S14.g04532 (H. roretzi Rbbp4/7-r.a), Harore.CG.MTP2014.S12.g03265 (H. roretzi Rbbp4/7-r.b), Harore.CG.MTP2014.S13.g06622 (H. roretzi the third best hit found in BLASTP search).
Fig. 3-6. All the core PRC2 components are maternally supplied transcripts with no enrichment in germline cells at later stages. The expression pattern of core components of PRC2 complex genes is revealed by in situ hybridization with DIG-labeled probes. The black arrows indicate the germline without clear staining. The positions of germline especially at the 64- and 110-cell stages were determined by nuclear staining (data not shown). The stages and views of embryos are shown at the top of the figure, except that the views for the embryos at the 32- and 64-cell stages, which are shown in the upper left corner of the pictures. a, animal view. v, vegetal view. p, posterior view. Scale bar, 100 µm.