A case study about potential educational effects of “Freemiun” social Games
A Thesis Submitted to the Department of Computer Science and Communications Engineering, the Graduate School of Fundamental Science and Engineering
of Waseda University
in Partial Fulfillment of the Requirements for the Degree of Master of Engineering
Ding Lei
Student ID 5114FG20-2 Submission Date July 30 2017 Supervisor Tatsuo Nakajima
Department of Computer Science and Engineering
Index
Abstract 1 Introduction
1.1 Problems of Game-based learning in the past.
1.2 Incidental Game-based Learning 1.3 Structure of this paper
2 Related Research
2.1 A new business Strategy : Freemium 2.2 The merits of Smart phone social Games.
3 Experiment Design
3.1 Hypothesis and targeted learning effect 3.2 The Subject Game
3.3 Factors to exam
3.4 Reaction speed testing method 3.5 Experiment Period
3.6 Data to collect
4 Evaluation Experiment4 Results and Evaluation 4.1 Data collected
4.2 Relationship between the 3 main factors
4.2.1 Learning effect against play amount of “Live” mode
4.2.2 Learning effect against play amount of “Communication” Mode 4.2.3 Learning effect against Sunk cost effect
4.2.4 Mixed Factor evaluation 4.3 Other effects
4.3.1 The endowment effect 4.3.2 Network externality 5 Conclusion and Future work
Reference Appendix
Abstract
Game-based learning has been a great concern among educators and researchers for nearly 4 decades since when video games comes into existence. Attempts have been made trying to bring fun into classrooms but few were successful due to the high-cost nature of video games. But things have changed when smart devices comes to take over. More and more people that have never played any form of video game before start to get familiar with games thanks to the new gaming business strategy: the
“Freemium”. Through this “free to download” mechanism, video games which once were expensive and requires extra devices become totally free to start and just one press of button away. As the market for console and pc games are shrinking, smart devices game applications is growing tremendously. Looking into this new trend of video game market may give us hint about how to design game-based learning in the future.
1. Introduction
1.1 Problems of Game-based learning in the past.
With the spread of personal computer and video game machines ever since the 1980s, digital education has been raised to be an emerging topic. Many approaches, such as
“Edutainment”, “Gamification”, “Game-Nics” and “Serious games”, have been made trying to find out an effective definition about education using video games. These concepts are believed to be “next generation” once, but finally it turned out that they are not. There are many reasons explaining why serious games do not fit in everyday classrooms. Among them most of all, the costs of creating such computer games are very expensive. In the military and medical fields, practicing in the real world is risky and expensive, but in classrooms blackboard and chalks is always safe and cheap.
According to SERIOUS GAMES INTERACTIV: Generally speaking 1 hour of e-learning with multimedia will cost $65.000, whereas a more traditional e-learning application will cost $35.000. [1] Which is high-cost and probably low return, hardly profitable for the game Developers.
Other than trying to design games for educational purpose, there are also research cases using existing commercial games. Games that are not purposely designed for the use of education may also be useful for education. One famous example would be Using simulation games for the social studies classroom. But still there exists
obstacles. To introduce video games into classrooms require quite a bit enthusiasm from faculties. In Solomon Senrick ‘s research [2] trying to introduce the game
“Civilization IV” into the classroom:
In order to facilitate students learning effectively, for instance in determining what aspects to focus on and expect students to fully understand, teacher play of game was a significant first step
Teachers spend approximately 15 hours outside the class playing the game in order to understand and master the game itself.
Despite all of those efforts made, due to the complexity of the game itself Managing student responses and reflections was challenging for the teachers.
Which reveals the ineffectiveness of introducing a game.
And also, though a lot of efforts are made such e-learning typical problem as high dropout rates and lack of long-tern motivation still remains to be difficult issues. If a student is neither interested in the theme which the game covers nor forced to play the game as homework for school, the student is not likely to play games using their free time outside of classroom. [3]
1.2 Incidental Game-based Learning
There are a lot of type of learning effect the Game-based learning could provide. In this paper, we focus mainly on the incidental learning effect. Back in the 90’s the Edutainment provided many game software offered the learning contents through quiz, puzzles and simple actions. In these games players simply play those games for fun instead of having a main goal to learn anything. Players play the games as entertainment, the learning effects are incidental, which mean they comes unconsciously along with the enjoyment of the game. [4]
In these games, communication method between users and trouble shooting assist tools are provided to users for reaching the goal of the games and learning effects are stacked during repeated plays of the game. The gaining of learning effects will be unconscious, incidental when achieving goals of the games.
In this research, the experiment and discussion will be focused on this incidental type of Game-based Learning and the subject game used in the experiment will just be the type of games which required repeated play, and the learning effect is supposed to be incidental.
1.3 Structure of this paper
In this research, problems in the history of game-based learning, why and how the use of the new “freemium” type of game can solve those problems will be explained. A case study experiment is design to exam the influence on learning effect caused by a new factor of social game, the sunk-cost effect, along with traditional elements of games in order to gain hint about the design of educational games. In the experiment there will also be contributing factors that were not able to be quantified, interviews will be held with participants for further discovery.
2. Related research
2.1 A new business Strategy : Freemium
Nowadays, since 2010, smart device have earned itself explosive favor from all over the world. Uplift by this trend, game market has changed tremendously, instead of playing games on pc and consoles, people turns their attention to game
applications, especially in Japan, smart phone games has taken over more than 50% of the game market. Over 30% of gaming population plays only on their smart phones [5]. Smart device games, different from traditional console games, are usually made
“free-to-download” but trough in-game purchasing, upgrading itself into a premium version. This kind of typical business model of social game is named as: “freemium”
[6]. The characteristic of the “Freemium” business model is that Digital data copies of games are distributed all free through the Internet of which the merit is so that the game may reach its maximum potential customers. Only if several percent out of all purchase inside the game, due to huge base number the business is able to sustain.
Most of in-service social games in Japan introduce this business model.
2.2 The merits of Smart phone social Games.
Anybody can play it anywhere and anytime
According to Japan Consumer Commission [7] (Sep.2016), over 87% under 20
Japanese population uses smart phone. Among them over 45% plays game application at least once every week. People are already familiar with Smart phone games. There will be no need for teachers to introduce smart phones into classrooms when
providing Game-based learning using smart phone games.
Simple and repeated play
Different from old day commercial games, nowadays’ smart phone games are usually very simple. Traditional video games are linear, players plays the game to reach the ending. But in the case of social games, there are usually no goals. The structure of social games are considered to be in cycles.(Fig.1)
Fig1. Basic social game cycle model
This makes it easier to focus on a single aspect. Remember in the example of Game-based learning using Civilization IV. [8] The game itself was complex thus made it hard to control which aspects the participant students were focusing on. But with social games the game action is usually or supposed to be sole.
Designed to keep players’ motivation in a long term
The flow of development also changes from traditional video games to social games.(Fig2)
Fig2-1.Development flow of traditional video games
Fig2-2.Development flow of freemium social games
The flow of development is also in cycle in the case of social games. Traditional
【Action】
※Battle,match,quest
【Result】
※Exp,item,score,money
【Extention】
※New Episode,quest
Planning Develop Release
Planning Develop Service-
in Close
provide new contents in order to keep players interested. Most of the social games updates it’s content every month, implement it as a time-limited event thus to keep players’ attention.
And also other mechanism such as “login bonus” is often used to keep players’
attention. Free-to-take in game items are offered everyday when the player activate the game for the first time. These items are usually virtual currency that can be used as money to help make the play more stressless.
The Sunk cost Effect
Despite of the characteristics mentioned above perhaps this is the most significant difference. News blames social games for people getting addicted to it. The reason is mainly because of this “Sunk cost effect”. It is a concept from economics and business decision-making, also known as the “Concorde Effect”. It is a maladaptive economic behavior that is manifested in a greater tendency to continue an endeavor once an investment in money, effort, or time has been made (Arkes & Blumer, 1985).
[9] The money, effort, time here are called sunk cost. That is in this case a prior investment actually has influence on current decision-making. For example when one plays crane game at the game center, it is often hard to stop until he/she already paid too much to get the price.
In social games this effect is more obvious than it is in traditional video games because: 1.Social games used the strategy of freemium to let players download it for free and set stress in the game cycle which can be solved though paying a lot of time and effort or charging and purchasing of in-game items. 2.To keep user motivation the game is frequently updated with new charged items. Players that once purchased are easily persuaded to purchase again because of sunk cost. [10]
As shown in Fig3, there exist 2 main stress that social games are trying to make players purchase. Usually social games implement the concept of “Stamina”.
Carrying out the Action part consumes “Stamina” and it recovers with time or purchasing. And the since the game is frequently updated the difficulty of the Action part rises, if one wishs to play the game smoothly one need to pay time and efforts to bulid up stronger status, purchasing in game characters or weapons makes this process faster and easier.
Fig3. Stress and factors for in-game purchasing in social game cycle model Though the world often has negative image about this effect, it is in fact part of human nature and if used properly it could become a contributing factor to keep player motivation in the field of Game-based-learning.
3. Experiment Design
In this research, the purpose is to reveal potential educational effect through freemium social games and find out possible contributing factors through a field study using a popular rhythm social game.
3.1 Hypothesis and targeted learning effect
A hypothesis is made here that continuously playing of rhythm game has positive learning effect on one’s kinetic vision and reaction speed. Ask participant subjects to play the game from a new start during a period of two weeks. Record their play data and carryout reaction speed test during the experiment period. Analyze the play data and educational outcome and compare possible influencing effects to get hint about the potential of freemium in the field of Game-based learning.
3.2 The Subject Game
THE iDOLM@STER Cinderella Girls: Starlight Stage (BANDAI NAMCO Entertainment Inc.)
Game basics:
THE iDOLM@STER Cinderella Girls: Starlight Stage is a rhythm smart phone social game. Players play the role of a idol producer, the goal of this game is to produce idols.
According to the basic cycle model summarized in the previous section (Fig1). Game cycle of the subject game can be divided into the following two modes.
【Action】
The main action in this game is the “Live” mode.
Players play following the designed music pattern and interact with the game by tapping the dropping notes within right order and reaction time duration. Doing this correctly and continuously will earn scores. (The scores are counted according to the idol unity’s abilities.) Failed to much one will get lower score or worse lose the game.
Fig3.2.1 “Live” mode display (BANDAI NAMCO Entertainment Inc. All rights reserved)
There also exist sub action called “Communication” mode
Most of this mode is not necessary during the play. Players can view side stories about idols when episodes are unlocked.
Fig3.2.2 “Communication” mode display (BANDAI NAMCO Entertainment Inc. All rights reserved)
【Result】
According to there scores gained in action. The rank of result will be judged and correspond prize will be granted. The viewing of “Communication” mode for the first time will gain in-game items.
【Extension】
Within the prize there are Exp to rank up and items to leveling up idol characters for further play. When players get to higher rank new music “Live” will be unlocked.
When player idol characters reaches higher level, the abilities of each idol grows and with that the player can earn high score next time he plays the Action part.
Also the prize contains friendship points bind with correspond idol character. The reaching of certain points unlocks side story episode that can be viewed in
“Communication” mode.
【Stress】
Playing the action part consumes stamina. It can be restored by purchasing in game items or through time.
The game provide harder degree of difficulty. To earn high score and clear harder difficulty requires player effort of practicing or purchasing characters with stronger abilities. Side story episodes are attached to corresponding idols which can also be unlocked through purchasing.
3.3 Factors to exam
As explained in 4.2 the subject game is divided into two modes: the “Live” mode and the “Communication” mode. In the hypothesis the educational effect to be expected here is the growth in reaction speed which is commonsensically more related to the playing of the “Live” mode, but since the subject game is build in a entwined way, the play of one of the two mode has influence on the other.
How the play amount of the two modes and the sunk cost affects the outcome of reaction speed growth are 3 main factors to be recorded and evaluated.
3.4 Reaction speed testing method
The reaction speed of each and every participant who attended this experiment are tested and collected using Another simple pattern matching game :
“FLASH!” (©iY Works 2011-2012)
In this game players are simply ask to tap the same image as fast as they can within 45 seconds, the result score is recorded to be the representative of the participants’
Fig3.4.1 Reaction time testing through “FLASH!” (©iY Works 2011-2012)
The reaction speed test is carried out 3 times: before the experiment, in the middle of it and afterwards. Each time a participant plays the game for 3 times and the recorded data takes the average of scores to avoid bias.
3.5 Experiment Period
The experiment is designed to be a field study.
In total 18 participants who had never played the subject game are invited to play it for a period of 2 weeks from Dec 25th 2016 to Jan 9th 2017. The play data of every participant are recorded at the end of each period. The schedule is as follows (Fig4)
Fig4. Experiment duration division
The experiment is divided into two periods because on Jan 1st there was supposed to be a special deal on sale. Purchasing this special deal allows the player to choose one of all the characters he/she like. This could contribute to raise user motivation of playing the game. The behavior change is also discussed in the later chapters.
Test 1
Game Play Period 1
12/24 – 12/31
Test
2 S
P
Game Play Period 2 1/1 – 1/9
Test 3
3.6 Data to collect
For evaluation the following data are collected.
Reaction speed testing result Purchasing history
Player rank
Cleared “Live” number each difficulty (Debut, Regular, Pro, Master) Read “Communication” Number
Extra interviews are also made and will be discussed in the following chapters.
4 Results and Evaluation
4.1 Data collected Please refer to Appendix
4.2 Relationship between the 3 main factors As mentioned in section 3.3 the three factors are The play amount of “Live” mode
The play amount of “Communication” mode The sunk cost effect
Are considered to be main factors that influence the outcome of educational effect. In this chapter collected data in 5.1 are calculated and rearranged in order to find out a law-like nature. And also since the data comes from the same game and the players played different game modes and purchased for items at the same time. The three main effect that affects the player simultaneously, the three factors are not completely independent, each factors may have interference from another. For example, the player may purchase for characters at first, find out that he/she likes the character and view the story mode of it. And also the player can like a character and try to use it in the “Live” mode then find out playing rhythm game interesting and then continues to play more. Therefore, there will also be need to evaluate the three factors at once.
4.2.1 Learning effect against play amount of “Live” mode
There are two set of data recorded that can be considered as the representative of the player’s play amount of “Live” mode. The player rank and cleared “Live” number.
Here the normalized sum of the cleared “Live” number is chose for the reason that playing lower difficult or even the same “Live” repeatedly can also bring exp in order to rank up. How much one is good at dealing with reaction should be represented by how much reactive tasks he/she has accomplished.
The game uses the required stamina to represent the difficulty of each “Live”. So here the sum can be represented by the sum of required stamina for “Live” cleared each difficulty as the following equation:
And Learning effect here is represented by the growth in reaction speed test result.
The normalized data is as follows:
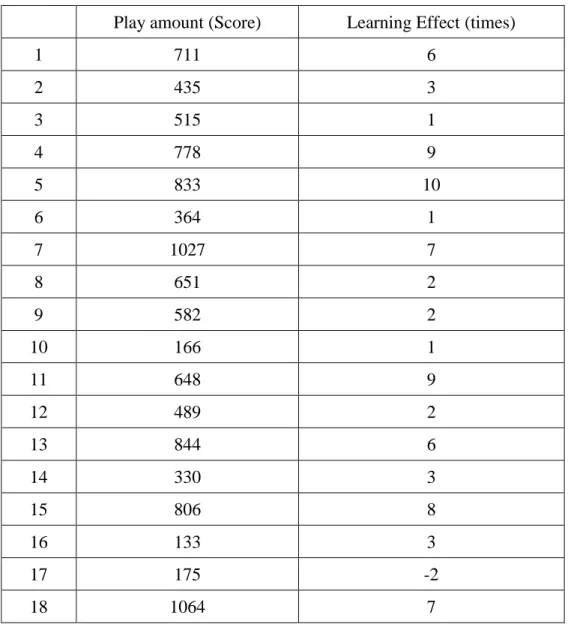
Table 4.2.1 Learning Effect against Play Amount of “Live” mode Play amount (Score) Learning Effect (times)
1 711 6
2 435 3
3 515 1
4 778 9
5 833 10
6 364 1
7 1027 7
8 651 2
9 582 2
10 166 1
11 648 9
12 489 2
13 844 6
14 330 3
15 806 8
16 133 3
17 175 -2
18 1064 7
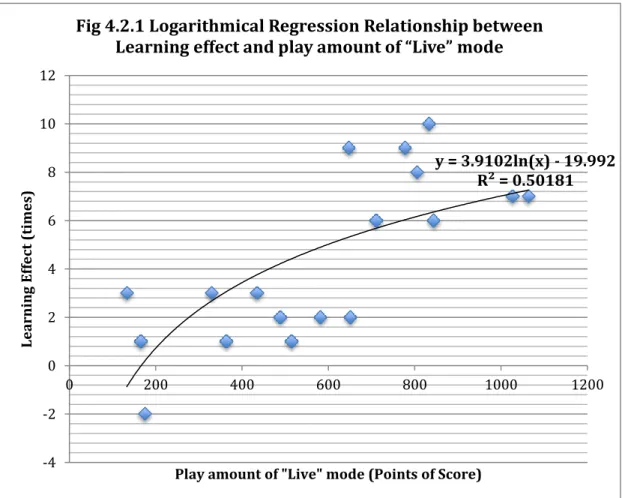
According to the data, a distribution graph can be made.(Fig4.2.1)
The trend line is simulated looking into the distribution of the data and applying a logarithmical regression. Basically learning effect grows with the play amount, but the value correlation coefficient R2 is 0.50 meaning there is uphill relationship between the two but not strong.
4.2.2 Learning effect against play amount of “Communication” Mode
Similarly, apply the same analyze to the relationship between the learning effect and the play amount of the “Communication” Mode. To set representative for the play amount of “Communication” Mode the number of side story episodes unlocked is used.
The data is as follows:
Table 4.2.2 Learning Effect against Play Amount of “Communication” Mode Communication
Episode Unlocked
(episodes) Learning Effect (times)
1 27 6
y = 3.9102ln(x) - 19.992 R² = 0.50181
-4 -2 0 2 4 6 8 10 12
0 200 400 600 800 1000 1200
Learning Effect (times)
Play amount of "Live" mode (Points of Score)
Fig 4.2.1 Logarithmical Regression Relationship between Learning effect and play amount of “Live” mode
2 22 3
3 20 1
4 50 9
5 34 10
6 23 1
7 32 7
8 18 2
9 30 2
10 12 1
11 35 9
12 16 2
13 40 6
14 20 3
15 30 8
16 14 3
17 18 -2
18 60 7
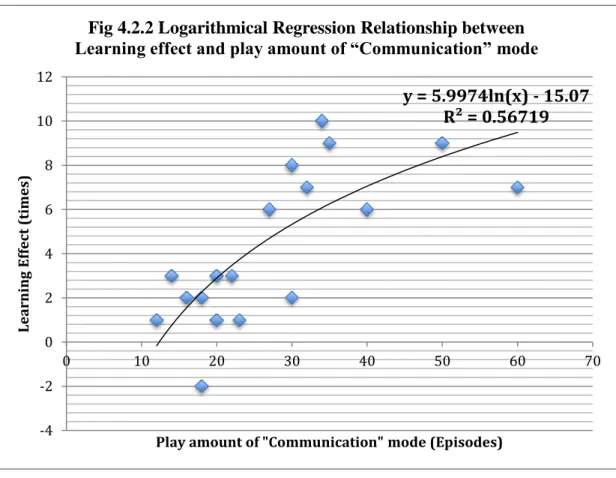
According to the data, the distribution graph is as follows:
The trend line is generated the same way as in 4.2.1. Correlation coefficient R2 value is 0.56 which means the relationship between Learning effect and the play amount of
“Communication” mode is uphill but not strong again.
4.2.3 Learning effect against Sunk cost effect
Thirdly, compare the learning effect against the sunk cost. The representative for sunk cost is set as the purchase amount of cash during the experiment period. As definition the sunk cost is a concept that contains time money and effort but as the Experiment is designed to take place at the same time period for each and every participant the time factor here weights little, and also the effort part was discussed as play amounts in 4.2.1 and 4.2.2. Thus in this section the representative for sunk cost effect is set as investments, the purchased amount of cash.
The data is as follows:
Table 4.3.3 Learning Effect against purchase amount
Purchase amount (JPY) Learning effect (times)
1 10120 6
y = 5.9974ln(x) - 15.07 R² = 0.56719
-4 -2 0 2 4 6 8 10 12
0 10 20 30 40 50 60 70
Learning Effect (times)
Play amount of "Communication" mode (Episodes)
Fig 4.2.2 Logarithmical Regression Relationship between Learning effect and play amount of “Communication” mode
2 0 3
3 2560 1
4 19600 9
5 17600 10
6 0 1
7 7800 7
8 0 2
9 2560 2
10 0 1
11 13000 9
12 0 2
13 5120 6
14 0 3
15 0 8
16 0 3
17 0 -2
18 13000 7
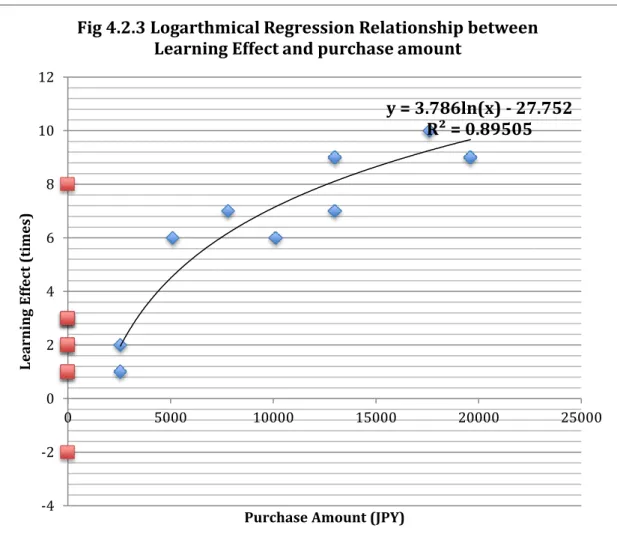
According to the data the distribution graph is as follows:
The trend line is generated the same way as in the previous two sections using Logarithmical Regression. However there is one difference to be noted : since there exist players who did not purchase, these points on the y-axis with the x value 0 are excluded. The correlation coefficient R2 here is nearly 0.9 which indicates a strong positive relationship between Learning effect and the purchase amount.
4.2.4 Mixed Factor evaluation
As discussed in section 5.2.1 to 5.2.3 , the three main factors do have positive
relationship with the Learning effect, but the correlation coefficient value is not strong.
Only the relationship between the Learning effect and the sunk cost effect shows a strong bond. However this is not enough, there is need to find out how the 3 main factors affect one another.
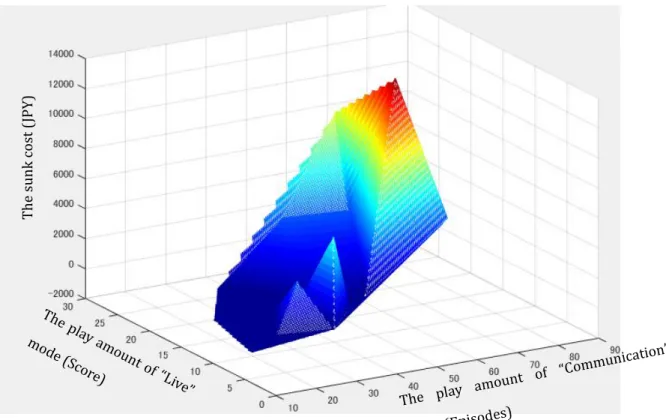
According to the arranged data from 4.2.1 to 4.2.3, ii able to plot a 4D distributed graph(Fig4.2.4). In this graph the three axis are set as value of Play amount of “Live”
y = 3.786ln(x) - 27.752 R² = 0.89505
-4 -2 0 2 4 6 8 10 12
0 5000 10000 15000 20000 25000
Learning Effect (times)
Purchase Amount (JPY)
Fig 4.2.3 Logarthmical Regression Relationship between Learning Effect and purchase amount
mode, Play amount of “Communication” mode and the purchase amount. The degree of learning effect is set as the color.
Fig 4.2.4 Learning effect against the 3 main factors
In this graph it is easy to see that the Learning effect forms a positive relationship with the 3 main factors. Out of the 3 main factors the purchase amount (sunk cost effect) has the most influence and the other 2 factors are driven by the growth of investment (sunk cost effect).
4.3 Other effects
After the experiment, individual interviews are held to discover further hints.
As already noticed in 5.2 the sunk cost effect has great influence of ones learning effect and continuity of the game. But how about those who did not purchase for the game. What was their motivation of continuing to help with this experiment?
4.3.1 The endowment effect
Interviews with each participant (9 out of 18) that did not purchase were held.
8 out of 9 participants reported the same reason why they kept playing as follows:
The sunk cost (JPY)
Gatcha is the way of purchasing extra characters in this game. The definition of Gatcha is “Random type item offering method that users use for a fee.”[12]
The characters that the player get each time when he/she rolls the gatcha is random with a percentage. Higher rarity characters are offered with lower percentage of chance.
The game provides enough in-game token for playing the Gotcha for 10 times when a player first come into the game. The 8 participants in this experiment had all gained at least one character of highest reality when they start the game. (though reset marathon ,etc.[13]) The other one participant (No.17) did not and it is clear to see from the results that he did not continuously play the game very much.
This phenomenon can be explained by the endowment effect. In psychology and behavioral economics, the endowment effect is the hypothesis that people ascribe more value to things merely because they own them. [14] Which in this case participants values their character and because of fearing to lose it, motivated to play the game though in fact they really did not pay any money.
4.3.2 Network externality
Another fact that might be concerned to have influence on the user’s continuing of the game is “I continue to play the game because my colleagues around me also plays it.”
The participants of this experiment are all colleagues from the same company. The are asked to take part in this experiment at the same period of time. So it might have become everyone’s topic. Playing the game might have become a way of catching up with the workspace conversation.
This phenomenon can be explained by the network externality. In economics and business, a network effect is the effect that one user of a good or service has on the value of that product to other people. When a network effect is present, the value of a product or service is dependent on the number of others using it.[15] Which in this case participants are motivated to play the game continuously because the people around him/her are playing the same game.
5. Conclusion and Future work
In this research the using of games made under the freemium strategy for educational purpose is advocated. How the freemium overcomes many traditional game-based education’s weakness is explained. There is a main characteristics of freemium games : the Sunk cost effect.
Case study using one popular freemium game about learning effect is reviewed. From the outcome discovery is found that In short period of time (in this case a period of two weeks) the sunk cost effect has greater influence on Learning effect than the actual play amount of game. Thus it is reasonable to say that the Sunk Cost Effect Characteristics of the new generation freemium social games have great potential when it comes to the design of game-based learning.
In the evaluation section, through interviews other factors under low sunk cost effect conditions are found. They are the Endowment effect and the Network externality.
They could be contributing factors of learning effects, however in this research it was not possible to quantify them. In the future, method of conversion of the Endowment effect and the Network externality into numerical form is still to be discovered.
Reference
1. Experiential eLearning: An ID Model for Serious Games, SERIOUS GAMES INTERACTIVE, Griffenfeldsgade 7A, 4.floor 2200 Copenhagen N Denmark, http://www.seriousgames.dk/ (aceessed Jan 26th 2017 )
2. Civilization IV in 7th Grade Social Studies: Motivating and Enriching Student learning with constructivism, content standards, and 21th Century skills. Solomon Senrick 2013. P85
3. ゲーム学習の新たな展開 ,藤本 徹(東京大学 大学総合教育研究センター), 放送メディア研究 No.12 2015, NHK放送文化研究所, P240
4. Prensky, M. (2006=2007), Don’t Bother Me, Mom. I’m Learning! Paragon House.
(藤本徹訳『テレビ ゲーム教育論』東京電機大学出版局)
5. スマホゲームの動向1,Mitsubishi Research Institute, Inc. Mar.24th 2016,
http://www.caa.go.jp/adjustments/pdf/160324shiryo1.pdf (accessed Jan 14th 2017) 6. Anderson, Chris (2009) Free: The Future of a Radical Price, Hyperion. (小林
弘人訳(2009) 「フリー<無料>からお金を生みだす新戦略=、NHK 出版。
7. 業界の変革と未来に迫る! 『ファミ通ゲーム白書2016』(KADOKAWA 2016) https://www.f-ism.net/fgh/2016.html (accessed Jan 14th 2017)
8. Civilization, Colonization, SimCity: Simulations for the Social Studies Classroom.
Frye, Beth; Frager, Alan M. Learning & Leading with Technology, v24 n2 p21-23,32 Oct 1996.
9. Anderson, Chris (2009) Free: The Future of a Radical Price, Hyperion. (小林 弘人訳(2009) 「フリー<無料>からお金を生みだす新戦略=、NHK 出版。=
10. 新井範子 *ソーシャルゲームにおけるユーザーの心理特性と課金行動の 関連
性について 『上智大学経済論集』 第58巻 277−286
11. The Sunk Cost and Concorde Effects: Are Humans Less Rational Than Lower Animals? ,Hal R. Arkes Peter Ayton, Psychological Bulletin 1999, Vol. 125, No.
5, 591-600
12. オンラインゲームの「コンプガチャ」と景品表示法の景品規制について, (平成24
年5月18日 消費者庁) 一部改定 平成28年4月1日 消費者庁,
http://www.caa.go.jp/representation/pdf/120518premiums_1.pdf (accessed Jan 14th 2017 )
13. About reset marathon
9 (accessed Jan 26th 2017)
14. Morewedge, Carey K.; Giblin, Colleen E. (2015). "Explanations of the
endowment effect: an integrative review". Trends in Cognitive Sciences. 19 (6):
339–348.
15. Carl Shapiro and Hal R. Varian (1999). Information Rules. Havard Business School Press. ISBN 0-87584-863-X.
Appendix :
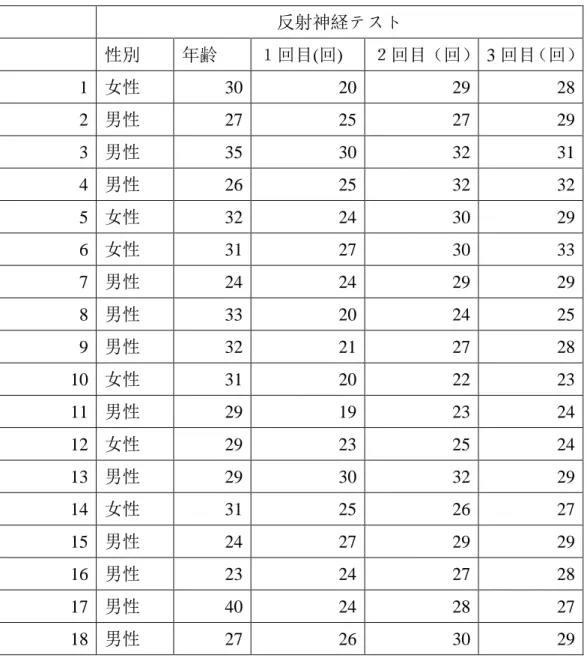
Collected data from Chapter 5.1Table 1. Player Reaction Speed Test 1 Result – Dec 24th 反射神経テスト
性別 年齢 1回目(回) 2回目(回) 3回目(回)
1 女性 30 20 29 28
2 男性 27 25 27 29
3 男性 35 30 32 31
4 男性 26 25 32 32
5 女性 32 24 30 29
6 女性 31 27 30 33
7 男性 24 24 29 29
8 男性 33 20 24 25
9 男性 32 21 27 28
10 女性 31 20 22 23
11 男性 29 19 23 24
12 女性 29 23 25 24
13 男性 29 30 32 29
14 女性 31 25 26 27
15 男性 24 27 29 29
16 男性 23 24 27 28
17 男性 40 24 28 27
18 男性 27 26 30 29
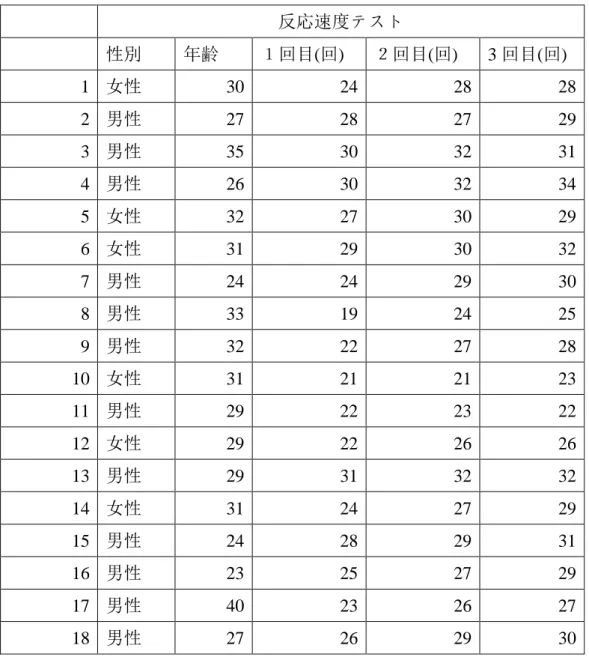
Table 2.Player Reaction Speed Test 2 Result – Dec 31st 反応速度テスト
性別 年齢 1回目(回) 2回目(回) 3回目(回)
1 女性 30 24 28 28
2 男性 27 28 27 29
3 男性 35 30 32 31
4 男性 26 30 32 34
5 女性 32 27 30 29
6 女性 31 29 30 32
7 男性 24 24 29 30
8 男性 33 19 24 25
9 男性 32 22 27 28
10 女性 31 21 21 23
11 男性 29 22 23 22
12 女性 29 22 26 26
13 男性 29 31 32 32
14 女性 31 24 27 29
15 男性 24 28 29 31
16 男性 23 25 27 29
17 男性 40 23 26 27
18 男性 27 26 29 30
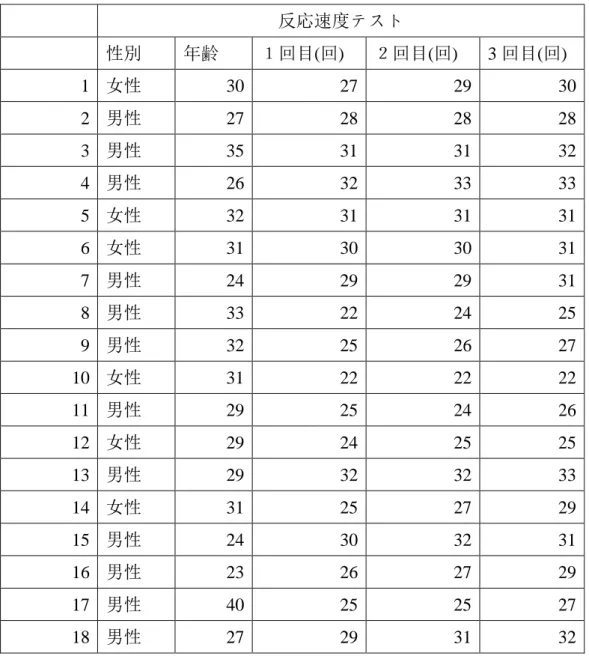
Table 3.Player Reaction Speed Test 3 Result – Jan 9th 反応速度テスト
性別 年齢 1回目(回) 2回目(回) 3回目(回)
1 女性 30 27 29 30
2 男性 27 28 28 28
3 男性 35 31 31 32
4 男性 26 32 33 33
5 女性 32 31 31 31
6 女性 31 30 30 31
7 男性 24 29 29 31
8 男性 33 22 24 25
9 男性 32 25 26 27
10 女性 31 22 22 22
11 男性 29 25 24 26
12 女性 29 24 25 25
13 男性 29 32 32 33
14 女性 31 25 27 29
15 男性 24 30 32 31
16 男性 23 26 27 29
17 男性 40 25 25 27
18 男性 27 29 31 32
Table 4.Player Rank with cleared “Live” number each difficulty – Dec 31st
DEBUT REGULAR PRO MASTER DEBUT REGULAR PRO MASTER
1 女性 14 12 20 14 0 5 4 1 0
2 男性 7 4 18 10 0 1 0 0 0
3 男性 15 10 10 5 0 1 2 0 0
4 男性 25 9 12 8 5 4 7 4 2
5 女性 10 6 6 1 0 1 0 0 0
6 女性 4 12 4 3 0 4 0 0 0
7 男性 23 4 4 19 10 2 3 2 0
8 男性 13 8 10 12 0 4 0 0 0
9 男性 13 4 14 10 0 3 0 0 0
10 女性 10 4 4 2 0 0 0 0 0
11 男性 23 7 12 4 1 1 7 0 0
12 女性 16 8 12 5 0 4 8 1 0
13 男性 29 8 15 12 2 2 12 8 0
14 女性 14 12 8 4 0 5 5 0 0
15 男性 19 10 9 6 0 5 6 0 0
16 男性 12 7 3 0 0 7 2 0 0
17 男性 6 4 2 3 0 4 2 0 0
18 男性 27 4 12 24 8 0 7 5 0
クリア楽曲数 フルコンボ楽曲数
Rank
Table 5. Player Rank with cleared “Live” number each difficulty – Jan 9th
DEBUT REGULAR PRO MASTER DEBUT REGULAR PRO MASTER
1 女性 23 24 24 15 0 10 9 8 0
2 男性 12 7 18 10 0 4 1 1 0
3 男性 20 15 20 10 0 4 6 0 0
4 男性 37 18 20 12 8 10 15 12 8
5 女性 30 20 20 19 5 10 16 7 0
6 女性 14 12 12 8 0 4 1 0 0
7 男性 32 6 12 25 16 2 6 12 2
8 男性 30 15 20 18 0 4 4 0 0
9 男性 18 10 20 16 0 3 5 0 0
10 女性 14 12 4 2 0 5 0 0 0
11 男性 34 18 18 18 0 4 10 8 0
12 女性 30 8 12 17 0 4 8 8 0
13 男性 29 8 20 20 8 8 12 18 2
14 女性 17 12 12 6 0 5 5 0 0
15 男性 30 20 20 22 2 10 10 6 0
16 男性 13 7 7 0 0 7 5 0 0
17 男性 7 4 8 3 0 4 2 0 0
18 男性 35 20 20 28 8 18 18 20 2
Rank クリア楽曲数 フルコンボ楽曲数
Table 6. “Communication” unlock number and purchase amount – Dec 31st
性別 年齢
コミュ
達成数 課金量(円)
1 女性 30 24 2560
2 男性 27 6 0
3 男性 35 10 2560
4 男性 26 18 13000
5 女性 32 13 0
6 女性 31 20 0
7 男性 24 25 2560
8 男性 33 14 0
9 男性 32 12 0
10 女性 31 4 0
11 男性 29 10 3200
12 女性 29 12 0
13 男性 29 18 2560
14 女性 31 10 0
15 男性 24 11 0
16 男性 23 12 0
17 男性 40 7 0
18 男性 27 30 3200
Table 7. “Communication” unlock number and purchase amount – Jan 9th
性別 年齢
コミュ
達成数 課金量(円)
1 女性 30 27 10120
2 男性 27 22 0
3 男性 35 20 2560
4 男性 26 50 19600
5 女性 32 34 17600
6 女性 31 23 0
7 男性 24 32 7800
8 男性 33 18 0
9 男性 32 30 2560
10 女性 31 12 0
11 男性 29 35 13000
12 女性 29 16 0
13 男性 29 40 5120
14 女性 31 20 0
15 男性 24 30 0
16 男性 23 14 0
17 男性 40 18 0
18 男性 27 60 13000