再生氾濫原の洪水 : 貝 : 水生植物の関係性に関す る生態工学的研究
劉, 佳
https://doi.org/10.15017/1441211
出版情報:Kyushu University, 2013, 博士(工学), 課程博士 バージョン:
権利関係:Fulltext available.
A RELATIONSHIP AMONG FLOOD, MUSSELS AND MACROPHYTE IN A RESTORED WETLAND
FOR ECOLOGICAL MANAGEMENT
By Jia Liu
A dissertation submitted
In partially fulfillment of the requirements for the degree of
Doctor of Engineering
Department of Urban and Environment Engineering Graduate School of Engineering
Kyushu University Fukuoka, Japan
January, 2014
DEPARTMENT OF URBAN AND ENVIRONMENTAL ENGEENEERING KYUSHU UNIVERSITY
FUKUOKA, JAPAN
CERTIFICATION
The undersigned hereby certify that they have read and recommended to the Graduate School of Engineering for the acceptance of this dissertation entitled, “A Relationship among Flood, Mussels and Macrophyte in a Restored Wetland for Ecological Management” by Jia Liu in partial fulfillment of the requirements for the degree of Doctor of Engineering.
Dated: January, 2014 Thesis Supervisor:
Prof. Yukihiro SHIMATANI
Department of Urban and Environmental Engineering, Graduate School of Engineering,
Kyushu University
Examination Committees:
Prof. Takahiro KUBA
Department of Urban and Environmental Engineering, Graduate School of Engineering,
Kyushu University Prof. Yasuhiro MITANI
Department of Civil and Structural Engineering, Graduate School of Engineering,
Kyushu University
Acknowledgement
謝辞著者が,中国から九州大学に留学に来て,本研究に取り組んでから
3
年が経ちました.多くの方々のご指導のおかげであり,学位論文として本研究をまとめることができまし た,心より感謝しております.
恩師である島谷幸宏先生は,教師として懇切丁寧に「伝道・授業・解惑」して頂き,
知識を吸収しながら,研究者の役割を深く認識でき,非常に充実した,楽しい研究生活 をおく送らせていただきました.また,島谷先生が技術者として多自然河川づくりに尽 くしている姿を見て,感慨が湧き,自らも高い志を立てるようになりました.
九州大学教授久場隆広先生,同学教授三谷泰浩先生には,本論文に対する適切かつ丁 寧なご指摘とご指導を頂きました.
熊本大学准教授皆川朋子先生,福岡大学の伊豫岡宏樹先生には,二枚貝と藻類の研究 計画・実施についてご指導,ご協力頂きました.
九州大学の助教大石京子先生には,水質分析の実験について丁寧にご指導頂きました.
九州大学の特任助教橋本彰博先生には,
SS
分析実験において,ご協力いただきました.アザメの瀬を管理する国土交通省九州地方整備局武雄河川事務所の皆様,NPO 法人 アザメの会の皆様には,現場調査およびデータ提供についてご協力頂きました.
九州大学工学府流域システム工学研究室の方々に多くのご協力を頂きました.同研究 室教授橋本晴本先生には,ご指導をいただきました.同助教林博徳先生には,研究の考 え方と論文の書き方について丁寧にご指導いただきました.同技術職員池松伸也氏には,
実験器具の作成,現地調査,実験用薬品の発注について多大ご協力いただきました.同 特任助教鹿野雄一氏,同特任助教山下奉海氏,同研究員(在籍当時)一柳英隆氏,同研 究員(在籍当時)佐藤辰郎氏,皆様に英語論文の書き方や生物に関する知識のご指導を 頂きました.同事務員(在籍当時)北島寿子氏,末松由美氏には,日々の研究室の生活 において大変の世話になりました.また,アザメの瀬班のメンバー小崎拳氏,稲熊祐介 氏,Thanti氏,現場調査を協力した坂田賢亮氏,橋村京介氏,兵頭拓氏,劉義涛氏には 感謝致します.ここに記していない,流域システム工学研究室の諸氏には,日々の生活 や研究活動において,協力を頂きました.
最後に,私はどこに行っても,何をしても,支えてくれている両親に心から感謝の意 を表します.
九州大学伊都キャンパスウエスト
2
号館1008
号室 平成26
年1
月29
日 晨CONTENTS
CHAPTER Ⅰ INTRODUCTION ... 1
1.1
B
ACKGROUND... 1
1.1.1 Reflection – Importance of wetland was recognized when it disappeared ... 1
1.1.2 Remediation – Action for Wetland Restoration ... 3
1.1.3 Review – Former Research Concerning Engineering Ecosystem of Restored Wetland ... 5
1.1.4 Introduction of Unionoida ... 5
1.2
P
URPOSES,
S
IGNIFICANCES ANDV
ALUES OF THISP
APER... 7
1.2.1 Purposes of This Paper... 7
1.2.2 Significances and Values of This Paper ... 7
1.3
I
NTRODUCTION OFA
ZAME–
NO–
SEW
ETLAND... 9
1.4
C
OMPOSITION OF THEP
APER... 17
R
EFERENCE... 19
CHAPTER Ⅱ EFFECTS OF FLOOD ON WATER QUALITY IN AZAME–NO–SE WETLAND ... 23
2.1
I
NTRODUCTION... 23
2.2
M
ETHODS&
M
ATERIALS... 26
2.2.1 Physical variation ... 26
2.2.2 Chemical variation ... 27
2.2.3 Biomass and species richness of phytoplankton ... 29
2.3
R
ESULTS... 30
2.2.1 Changes of physical variation and effects of flood on physical variation ... 30
2.2.2 Changes of chemical variation nutrients effect of flood on chemical variation ... 40
2.2.3 Changes of biomass and species of phytoplankton variation due to flood ... 53
2.4
D
ISCUSSIONS... 58
2.4.1 DO and T. japonica ... 58
2.4.2 Nutrients load in Matsuura River during a flood event ... 60
2.4.3 Nutrients budgets assessment in the restored wetland and issues for the assessment ... 62
2.5
S
UMMARIES... 67
R
EFERENCE... 69
CHAPTER Ⅲ MACROPHYTE’S (T. JAPONICA) INVASION AND ITS CHANGES IN AZAME–NO–SE
WETLAND ... 71
3.1
I
NTRODUCTION... 71
3.2
M
ETHODS&
M
ATERIALS... 74
3.2.1 Coverage and biomass of T. japonica ... 74
3.2.2 Leaf beetle (G. nipponensis) ... 75
3.2.3 Morality of mussels ... 76
3.2.4 An experiment about relationship between T. japonica and DO ... 77
3.3
R
ESULTS... 78
3.3.1 Coverage and biomass of T. japonica ... 78
3.3.2 Leaf beetle (G. nipponensis) ... 81
3.2.3 Morality of mussels ... 82
3.3.4 A relationship between T. japonica and DO ... 83
3.4
D
ISCUSSIONS... 85
3.4.1 T. japonica and phytoplankton dynamic ... 85
3.4.2 The reasons caused decreasing of T. japonica ... 86
3.4.3 Natural regulation happened in the restored wetland——considering principles for the ecological restoration of aquatic resources ... 88
3.5
S
UMMARIES... 90
R
EFERENCE... 91
CHAPTER Ⅳ FEEDING BEHAVIORS OF A. LAUTA & EFFECTS OF A. LAUTA ON THE WATER QUALITY IN AZAME–NO–SE WETLAND ... 93
4.1
I
NTRODUCTION... 93
4.1.1 Feeding behaviors of A. lauta ... 93
4.1.2 Effects of A. lauta on the water quality ... 94
4.2
M
ETHODS&
M
ATERIALS... 95
4.2.1 Feeding behavior experiments ... 95
4.2.2 Water quality study ... 96
4.3
R
ESULTS... 97
4.3.1 Feeding behavior of A. lauta ... 97
4.3.2 Effects of A. lauta on water quality ... 106
4.4
D
ISCUSSIONS... 126
4.4.1 Factors influencing feeding behavior ... 126
4.4.2 A. lauta changes the form of nutrients in water but not removes... 128
4.4.3 Can A. lauta improve water quality by eating more? ... 129
4.5
S
UMMARIES... 132
R
EFERENCE... 134
CHAPTER Ⅴ RELATIONSHIPS AMONG A. LAUTA, T. JAPONICA AND OTHER ENVIRONMENTAL VARIATIONS ... 138
5.1
M
ETHOD... 138
5.2
R
ESULTS... 140
R
EFERENCE... 145
CHAPTER Ⅵ CONCLUSIONS AND PROSPECTS ... 146
6.1
C
ONCLUSION... 146
6.2
P
ROSPECTS ANDS
UGGESTIONS... 147
6.2.1 Check the design principles for Azame‐no‐se Wetland ... 147
6.2.2 Proposals for management of T. japonica ... 148
6.2.3 Proposals for protecting and using A. lauta ... 149
APPENDIX: PHYTOPLANKTON SPECIES IN 3 SITES OF THE WETLAND ... 150
CHAPTER Ⅰ
1
CHAPTER Ⅰ INTRODUCTION
1.1 Background
1.1.1 Reflection – Importance of wetland was recognized when it disappeared A wetland is defined by either of two definitions as “lands transitional between terrestrial and aquatic systems where the water table is usually at or near the surface or the land is covered by shallow water” (Cowardin LM et al., 1979), or, “areas of marsh, fen peatland or water, whether natural or artificial, permanent or temporary, with water that is static or flowing, fresh, brachish, or salt, including areas or marine water the depth of which at low tide does not exceed six meters” (Royal CG et al., 1971; Roggeri H, 1995).
Often called “nurseries of life”, wetlands provide habitat for thousands of aquatic species and terrestrial plants and animals (Luef B et al., 2007), plays an important role of maintaining biodiversity and integrative ecological function in the river (Middleton BA et al., 1999). Wetlands provide values that no other ecosystem can, including natural water quality improvement, flood protection, shoreline erosion control, opportunities for recreation and aesthetic appreciation, and natural products for our use at no cost (EPA, wetlands and people). Only recently have we begun to understand the importance that wetlands perform.
Half of the world’s wetlands disappeared since 1900s. Development and conversion
continue to pose major threats to wetlands despite their value and importance (WWF,
Threats to wetlands; Brinson MM et al., 2002; Malmqvist B et al., 2002). In Japan, there
was 2110.6km
2area of wetland in Meiji Period and Daisho Period. Nowadays, 1300km
2area of wetland decreased due to draining of wetlands for commercial development and
agricultural land use until 2000 (Fig. 1–1). Western Japan where Kyushu located had the
lowest wetland resource in past and almost didn’t increase nowadays (Fig. 1–2).
2
Figure 1-1 Variation of wetland area from Meiji / Daisho Period to nowadays in Japan (the figure is from Geospatial Information Authority of Japan, Investigation results of Lake and Wetland).
Figure 1-2 Variation of wetland area in each region of Japan (the figure is from Geospatial
Information Authority of Japan, Investigation results of Lake and Wetland).
CHAPTER Ⅰ
3
1.1.2 Remediation – Action for Wetland Restoration
Restoration is the process of inducing and assisting biotic and biotic components of an environment to recover to the state that they existed in the unimpaired or original state (Bradshaw AD, 1997). For relieving threatens of wetland worldwide, restoration of rivers and wetlands has emerged as worldwide issues as well as a booming enterprise (Kondolf GM, 1995; Brookes A et al., 1996; Nienhuis PH et al., 2001, Shields FD et al., 2003; Bernhardt EC et al., 2005; Palmer MA et al. 2005). Large areas of wetlands are now protected under the International Convention on Wetlands.
In Japan, the year of 1990 was a turning point in river management. The River Bureau launched the initiative “Nature–oriented River Works”, with the goal of conserving and restoring river corridors and their rich biodiversity. This initiative was strongly influenced by “Naturanher Wasserbau” in Awitzerland and in Bavaria, Germany (Yamawaki M, 2000). From 1990 to 2004, river restoration has been growing rapidly and the number of natural–oriented river works arrived more than 23,000 (Nakamura K et al., 2006). Wetland, as a part of river restoration, constructed in this boomed period, and Azame–no–se Wetland related in this paper was one example.
In United States, including increasing wetland, many on–going or completed
restoration projects now offer valuable lessons. To help build on these lessons and
promote effective restoration, The Watershed Ecology Team of the Office of Wetlands,
Oceans, and Watersheds has assembled the following list of principles in 2000 (EPA
Number: 841F00003). It has been critical to the success of a wide range of aquatic
resource restoration projects. These principles apply to different stages in the life of a
restoration project – from early planning to post–implementation monitoring – and are
offered here for use by a wide variety of people and organizations, ranging from Federal,
State, Tribal, and local agencies to outdoor recreation or conservation groups,
corporations, landowners, and citizens’ groups. The Azame–no–se Wetland was also
compared to these principles in this paper.
4
Restoration Guiding Principles
Preserve and protect aquatic resources
Restore ecological integrity
Restore natural structure
Restore natural function
Work within the watershed/landscape context
Understand the potential of the watershed
Address ongoing causes of degradation
Develop clear, achievable and measurable goals
Focus on feasibility
Use reference sites
Anticipate future changes
Involve a multi–disciplinary team
Design for self–sustainability
Use passive restoration, when appropriate
Restore native species, avoid non–native species
Use natural fixes and bioengineering
Monitor and adapt where changes are necessa
CHAPTER Ⅰ
5
1.1.3 Review – Former Research Concerning Engineering Ecosystem of Restored Wetland
It is said that easy to destroy, but difficult or impossible to restore completely. As a result, the restoration strategy, criteria and assessment methods became discussion issues of wetland restoration (Tockner K et al., 1997; Lake PS, 2001; Kentula ME, 2000). And as theoretical basis, these researches supported wetland restoration.
In addition, as the most important process for wetland, the effects of flood disturbance and related hydrology dynamics for wetland restoration were also focused (Acreman MC et al., 2007; Middleton BA, 1999). Seed supply and seed dispersal through flood flow was considered to be important for restoration of vegetation growing in wetland (Bischoff A, 2002; Middleton BA, 2003). Hayashi et al., 2011 also reported the study of seed dispersal by flood flow in the Azame–no–se Wetland.
However, the researches concerning habitats and variation of aquatic livings just like plants, plankton, fish, insects or benthic animals in restored wetland are very limited, even there are a lot of related studied in natural wetland (Frank CJMR, 2008; Mihaljević M, 2009; Burron NE, 2011; Schomaker Y, 2011).
1.1.4 Introduction of Unionoida
Freshiwater mussels (Order Unionoida) constitute one of important biological components of freshwater ecosystems particularly because some fish species (bitterling) require them as spawnig beds whereas mussels need other fish species to reproduce themselves. As filter–feeding grazers, they can also remove large amounts of particulate matter from the water column and transfer these resources to the substrate as biodeposits (Howard JK et al., 2006). Unioniod mussels used to widely inhabit in both lentic and lotic environments and 18 species have been reported in Japan;
approximately 1000 species exist worldwide (Negishi J et al. 2008; Negishi J et al.
6
2010). However, decreases in species diversity, abundance, and habitat range of Unionoida are common throughout the world, and major cuasues include alteration of physical chemical and biological characteristics of habitat environments through human activites such as harvestiong of individuals, river works, landuse and invasion of alien species.
Anodonta lauta is a kind of Unionoida. We found it is decreasing and difficult to be
collected in Matsuura River basin. It is urgent to protect and restore this kind of
Unionoida.
CHAPTER Ⅰ
7
1.2 Purposes, Significances and Values of this Paper
1.2.1 Purposes of This Paper
The purpose of this paper is to elucidating the mechanisms and vital factors of the Unionoida’ habitat; furthermore, aiming to guide restoration methods and management systems of the wetlands for protecting Unionoida
For reaching our goals, we focused to research the four problems: 1) the relationship between floods and water quality of A. lauta’ (a species of Unionoida) habitat; 2) the relationship between aquatic plants (Trapa japonica) and A. lauta; 3) characteristics of A. lauta’ habitat and its feeding behavior; 4) effects of A. lauta on water quality (from a viewpoint of sustained development).
We carried out investigations and experiments from 2010 to 2012, got amount data about water quality, flood, T. japonica, A. lauta and other related parameters.
1.2.2 Significances and Values of This Paper
Restoration is a science in need of application and is application in need of science (Palmer MA, 2009).
The fact that wetlands are products of their hydrology and that hydrological regimes are readily modified, offers wetland ecologists unique opportunities to uncover the details of cause–effect relationships and to use this knowledge in wetland restoration (Zedler JB, 2000). Experimental research is needed to explain the impacts of flood disruptions to wetland as well as to guide efforts to restore wetlands. Until nowadays, restoration of river or wetland aims at a general purpose and restoration principles are also not point at a certain livings. Knowledge and technology is not enough yet for protecting a concrete object, for example, an endangered species. In future, restoration methods and principles should be focused on a certain living in need of protection.
This paper researched alternations of a freshwater mussel’s habitat in a restored
8
wetland by investigation and experiment. The results are important to understanding the
running of the restored wetland system, and benefit to management of the restored
wetland. Furthermore, it will become reference and methodology when carried out new
restoration project with the purpose to create the freshwater mussel’s habitat.
CHAPTER Ⅰ
9
1.3 Introduction of Azame–no–se Wetland
The Matsuura River valley located in Saga Prefecture with the total length of 47km and watershed area of 446km
2, which occupies 20% area of Saga Prefecture. Restored wetland Azame–no–se located at the middle reach (15.8km far from estuary) of the Matsuura River with the area of 6 hectares (about 1000 meters of length and 400 meters of width). The wetland has diverse biotopes as pools, creaks and terrace fields, which were benefits to create biodiversity (Fig. 1–3).
The purpose of restoring the Azame–no–se Wetland were 1) Restoring the ecosystem
of the wetland to protect habitat of livings depend on natural wetland or still water; 2)
Creating an comfortable environment to make residents and nature achieve harmonious,
enable the wetland to become recreation place and education base.
10
Figure 1-3 Map of Azama–no–se Wetland and Matuura River Basin (the picture is from Ministry of Land, Infrastructure, Transport and Tourism, MLIT).
(1) Design and Construction
When we restored the Azame–no–se Wetland, the high bank of river had been
removed for recovering the continuity between Matsuura River and the wetland. The
construction continued for 8 years from 2001to 2008 (Fig. 1–4).
CHAPTER Ⅰ
11
Figure 1-4 Construction process of Azama–no–se Wetland (the picture is from Ministry of Land, Infrastructure, Transport and Tourism, MLIT).
An entrance from Matsuura River to the Azame–no–se Wetland was created and a waterway (creek) was constructed to derive water to the wetland. Height of left creek bank (the bank close to the wetland) was set to be T.P. (Tokyo Peil) 2.7m–3.0m. That means that the river connects to the wetland and water flows to wetland when water level rises over 2.7m. Height of right creek bank (the bank close to the river) was set to be T.P. 3.5m. Height of Shitaike Pool and Ueike Pool was set to be T.P. 2.0m. Height of Tomboike Pool was set to be T.P. 4.5m and its bank was set to be T.P. 6.0m (Fig 1–5).
Fig 1–6 showed, Shitaike Pool and Ueike Pool have high flood frequency but Tomboike
Pool has low frequency. The multiple landscapes and different floods frequency are
supporting biodiversity development in the restored wetland.
12
Figure 1-5 The overall construction sits plan of Azame–no–se Wetland (apart of the picture is
from Ministry of Land, Infrastructure, Transport and Tourism, MLIT).
CHAPTER Ⅰ
13
Figure 1-6 The flood frequency in Ueike Pool, Shitaike Pool and Tomboike Pool in spring and
summer 2011. The left bank of creek and bank of Tomboike Pool is showed by dash line. When
water level rises over the bank, the flood happened.
14
(2) Biodiversity restoration
At the same time, fish and plant investigation was also carried out in the wetland from 2001. The researches, consulting companies, members of NGO and students continued the studies and accumulated a lot of valuable data until now for more than 10 years. It was confirmed that the Azame–no–se Wetland is running with the power of nature (flood pulse) but not human approach. Nutrients, seeds of planks and livings transferred from the river to the wetland by floods. The Azame–no–se Wetland formed an environment of biodiversity. Kinds of grasses, trees, fish, insects, amphibious, reptiles and benthic aquatic animals were found in the biodiversity investigations.
Furthermore, the restored wetland also became a spawning ground for fish in spring and a refuge of some endangered livings when flood event happened. Azame–no–se Wetland achieved the goals both of ecosystem restoration and human utilize during its 10–year run (Ministry of Land, Infrastructure, Transport and Tourism, Government of Japan).
(3) As habitat of Anodon lauta
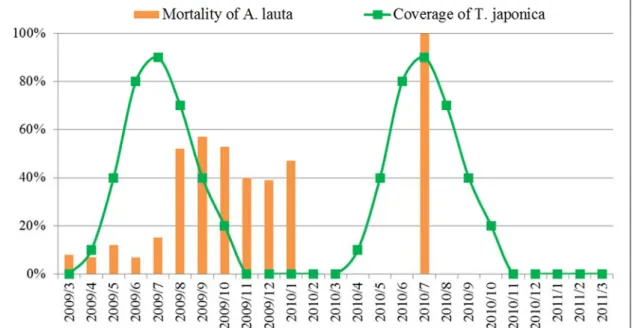
A kind of Unionoida (A. lauta) invaded into the Shitaike Pool and Ueike Pool owing to flood pulses from 2006. The numbers of mussels increased more than 1700 in Shitaike Pool until 2008. However, the mussels died with the invasion of Trapa japonica from 2009 and died out in summer 2010. The Ueike Pool who has no invasion of T. japonica is still mussels’ habitat until nowadays.
Some researchers (Hayashi H et al.,2012; Inakuma Y et al. 2012) based on the theory
of evolutionary morphology and experiments, reported that A. lauta is more prone to be
washed away by flood pulse than other nomussel species; however, the reasons for the
mussels’ living after their invasion and the changed of their habitat (Fig. 1-7) have not
yet been clearly determined.
CHAPTER Ⅰ
15
Figure 1-7 Changes of mussel’s habitat in Azame–no–se Wetland from 2009 to 2013
.
16
CHAPTER Ⅰ
17
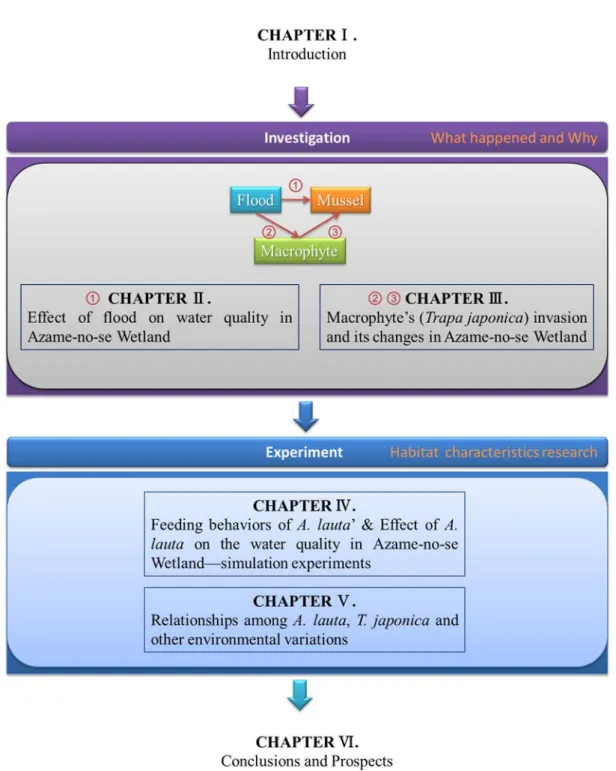
1.4 Composition of the Paper
For solving the four problems as related before: 1) the relationship between floods and water quality of A. lauta’ (a species of Unionoida) habitat; 2) the relationship between aquatic plants (Trapa japonica) and A. lauta; 3) characteristics of A. lauta’
habitat and its feeding behavior; 4) effects of A. lauta on water quality (from a viewpoint of sustained development). I arranged 6 chapters as Fig. 1–8 showed:
Chapter Ⅰ introduced the background of restored wetland and purposes of this research; Contents of Chapter Ⅱ and Chapter Ⅲ were about our field investigation.
In Chapter Ⅱ, we researched the changes of water quality and effects of floods on
water quality; In Chapter Ⅲ, the change of T. japonica coverage and impact of
T.japonica invasion on mussel’s living. Chapter Ⅳ illustrated feeding behavior of
mussel and the effects of mussels on water quality; Chapter Ⅴ analyzed and verified
the relationship among mussels, plants and environment variations; Chapter 6
summarized the research, gave proposals for protecting mussel and managing restored
wetland. The necessary studies should be conducted in future were also proposed.
18
Figure 1-8 The composition and process of this paper.
CHAPTER Ⅰ
19
Reference
Acreman MC, Fisher J, Stratford CJ, Mould DJ, Mountford JO (2007) Hydrological science and wetland restoration: some case studies from Europe. Hydrol. Earth Syst. Sci. 11 (1): 158–
169.
Bernhardt ES, Palmer MA et al (2005) Synthesizing U.S. river restoration efforts. Science 308:
636–637
Brinson MM, Malvarez AI (2002) Temperate freshwater wetlands: Types, status, and threats.
Environmental Conservation 29: 115–133
Bradshaw AD (1997) Restoration of mined lands: using natural processes. Ecological Engineering 8: 255–269
Brookes A, Shields FD (1996) River Channel Restoration: Guiding Principles for Sustainable Projects. John Wiley and Sons: Chichester, UK,433 pp
Burron NE, Marinone MC, Freire MG, Schweigmann N, Loetti MV (2011) Invertebrate communities from different wetland types of Tierra del Fuego. Insect Conservation and Diversity 4(1): 39–45
Bischoff A (2002) Dispersal and establishment floodplain grassland species as limiting factors in restoration. Biological Conservation 104 (1): 25–33
Cowardin LM, Carter V, Golet FC, LaRoe ET (1979) Classification of Wetlands and Deepwater Habitats of the United States, U.S. Fish and Wildlife Service, U.S. Department of the Interior, Washington D.C.
EPA, Wetland and People, http://water.epa.gov/type/wetlands/people.cfm
Environment Survey Report For Azame–no–se Wetland (2003–2007), Ministry of Land, Infrastructure, Transport and Tourism, Government of Japan
Frank CJMR, Edwin THM, et al (2008) Fast response of lake plankton and nutrients to river inundations on floodplain lakes. River Research and Applications 24(4): 388–406
Geospatial Information Authority of Japan, Investigation Results of Lake and Wetland,
20
http://www1.gsi.go.jp/geowww/lake/shicchimenseki2.html
Hayashi H, Shimatani Y, Shigematsu K, Nishihiro J, Ikematsu S, Kawaguchi Y (2012) A study of seed dispersal by flood flow in and artificially restored floodplain. Landscape Ecol Eng 8:129–143
Howard JK, Cuffey KM (2006) The functional role of native freshwater mussels in the fluvial benthic environment. Freshwater Biology 51:460–474
Inakuma Y, Hayashi H, Tsujimoto Y, Shimatani Y (2013) Settling characteristics and the limiting factor of habitat distribution of unionoida mussels in the Matsuura River. Journal of JSCE B1 69(4):1297–1302
Kondolf GM (1995) Five elements for effective evaluation of stream restoration. Restoration Ecology 3: 133–136
Kentula ME (2000) Perspectives on setting success criteria for wetland restoration. Ecological Engineering 15 (3–4): 199–209
Lake PS (2001) On the maturing of restoration: Linking ecological research and restoration.
Ecological Management and Restoration 2: 110–115
Luef B, Aspetsberger F, Hein T, Huber F, Peduzzi P (2007) Impact of hydrology on free–living and particle–associated microorganisms in a river floodplain system (Danube, Austria).
Freshwater Biology 52(6): 1043–1057
Malmqvist B, Rundle S (2002) Threats to the running water ecosystems of the world.
Environmental Conservation 29: 134–153
Middleton BA (1999) Wetland restoration, flood pulsing and disturbance dynamics. John Wiley and Sons: Chichester, UK, 387 pp
Middleton BA (2003) Soil seed banks and the potential restoration of forested wetlands after farming. Journal of Applied Ecology 40 (6): 1025–1034
Mihaljević M, Stević F, Horvatić J, Kutuzović BH (2009) Dual impact of the flood pulses on the
phytoplankton assemblages in a Danubian floodplain lake, (Kopački Rit Nature Park,
Croatia). Hydrobiologia 618 (1): 77–88
CHAPTER Ⅰ
21
Nakamura K, Tockner K, Amano K (2006) River and Wetland Restoration: Lessons from Japan.
BioScience 56 (5): 419–429
Negishi J, Kayaba Y, Ysukahara K, Miwa Y (2008) Unionoid mussels as imperiled indicator organisms: habitat degradation prosesses and restoration approaches. Ecol. Civil Eng.
11(2):195–211
Negishi J, Sagawa S, Kayaba Y, Sanada S, Kume M, Miyashita T (2012) Mussel responses to flood pulse frequency: the importance of local habitat. Freshwater Biology 57(7):1500–
1511
Nienhuis PH, Leuven RSEW (2001) River restoration and flood protection: Controversy or synergism? Hydrobiologia 444: 85–99
Palmer MA, et al (2005) Standards for ecologically successful river restoration. Journal of Applied Ecology 42: 208–217
Palmer MA (2009) Reforming watershed restoration: science in need of application and applications in need of science. Estuaries and Coasts 32: 1–17
Roggeri H (1995) Tropical Freshwater Wetlands: A Guide to Current Knowledge and Sustainable management. Developments in Hydrobiology 112. Kluwer Academic Publishers, Dordrecht, the Netherlands
Royal CG, Kim DC (2007) The Ramsar Convention on wetland: Assessment of international designations within the United States. Environmental Law Review 37
Shields FD, Cooper CM, Knight SS, Moore MT (2003) Stream corridor restoration research: A long and winding road. Ecological Engineering 20: 441–454
Shimatani Y, Imamura M, Ootsuka K (2003) The plan of the Matsuura River restoration at Azame (in Japanese with English summary). Adv Rver Eng 14: 451–456
Schomaker C, Wolter C (2011) The contribution of long–term isolated water bodies to floodplain fish diversity. Freshwater Biology 56 (8): 1469–1480
Tockner K, Schiemer F (1997) Ecological aspects of the restoration strategy for a river–
floodplain system on the Danube River in Austria. Global Ecology and Biogeography 6:
321–329
22
WWF, Threats to wetlands,
http://wwf.panda.org/about_our_earth/about_freshwater/intro/threats/
Yamawaki M (2000) Naturnaher Wasser und Strassenbau [in Japanese]. Tokyo: Shinzansya Sci–
tech
Zedler JB (2000) Process in wetland restoration ecology. Trend in Ecology and Evolution
15(10): 402–407
CHAPTER Ⅱ
23
CHAPTER Ⅱ Effects of Flood on Water Quality in Azame–
no–se Wetland
2.1 Introduction
It is widely recognized that hydrological conditions provide the basic control of wetland structure and functioning. Flood pulsing regulates the connections and exchange of water among wetlands water bodies and rivers that could highly influence the wetland ecosystem (Junk WT et al., 2004). When rivers overflow, wetlands help to slow floodwaters and the ability to control floods can alleviate property damage or loss and can even save lives. Wetland can also support primary and secondary production, as well as basic food web properties could be disturbed by the flood (Lindholm M et al., 2007; Muylaert K et al., 2006; Medley KA et al., 2007). Whilst, nutrients also immediately responded to the flood event (Wilson J at el., 2008) and it promoted an increase in nutrient inputs and these processes were important to maintain the high productivity of aquatic communities over time (Agostinho AA et al., 2004). Besides, wetland also absorbs excess nutrients, sediment, and other pollutants before they reach rivers, lakes, and other water bodies (EPA, Wetlands Overviews).
Wetland restorationists begin by considering how water should influence the site.
Flood event happened in Matsuura River basin every year due to larger rainfall (spring and summer) and typhoon (autumn). Pools distributed in Azame–no–se Wetland were differently influenced by flood according to their different T.P. (Tokyo Peil) and the different distance to entrance of the river. Shitaiek Pool and Ueike Pool were lower and near to entrance of the river, therefor they suffered the highest flood frequency. While Tomboike Pool located higher and far away from the entrance, as a result, it had the lowest flood frequency of all of surveyed pools. The different topography and flood frequency caused the different habitat condition and water quality among sites of the Azame–no–se Wetland.
However, effects of flood pulse from the river on restored wetland were not well
understood yet, including the timing of flood, fate of nutrients, sediments delivered and
the primary producers who catchment nutrient sources. Responses of aquatic
24
environmental factors in each pool of the restored wetland to flood pulse were never compared and analyzed before, which is considered to be important to explain mechanism and changes of mussel’s habitat.
We chose 4 sites (Fig. 2–1) and observed the floods happened in the Matsuura River basin with different peak water level from 2010 to 2012. Shitaike Pool and Ueike Pool are lying lower, plankton (T. japonica) bloomed from spring in Shitaike Pool, but it was not happened in Ueike Pool; Tomboike Pool is lying highest with the lowest flood frequency and T. japonica did not be observed there; the still water region of Matsuura River has a few of T. japonica in spring and summer.
We continued to investigate once a month for about 2 years. When flood happened, the water samples of before, during and after flood event had been also collected for catching the effects of flood event on water quality. In addition, for understanding the changes of water quality over time during flood event, installations for collecting water samples was designed and set in different elevations from T.P. 3.0 to T.P. 7.0. in 4 sites located in the restored wetland and the Matsuura River (entrance of Azame–no–se Wetland, Shitaike Pool and Ueike Pool) during spring and summer of 2011.
In this chapter, we investigated effects of floods on water quality of pools in Azame–
no–se Wetland, with a purpose to find functions of flood for forming mussels’ habitat
from the viewpoints of water quality of the pools where they are living and their
primary production.
CHAPTER Ⅱ
25
Figure 2–1 Location of Azame–no–se Wetland and Matsuura River Basin indicating the position of the sampling stations. The pictures of 4 sites showed that, T. japonica appeared in still water of Matsuura River in spring and summer; T. japonica dominated Shitaike Pool in summer;
there is no plants appeared on surface of water in Ueike Pool and Tomboike Pool.
①Matsuura River
②Shitaike
③Ueike
④Tomboike Azame-no-se Wetland
N
0 50m
①
②
③ ④
Matsuura River Basin
② ③ ④ ①
26
2.2 Methods & Materials
2.2.1 Physical variation
We carried out the investigation once a month from April 2010 to March 2012 and we increased the number of investigation (daily or weekly before and after flood) when the flood came.
HOBO U20 Water Level Logger and tidbit v2 Temp Logger were set in sites for monitoring water level and temperature, the results were recorded every 30 minutes; pH, DO were surveyed by Portable Multi–parameter Meters produced by Shimadzu monthly.
2L surface water was collected from each station for suspended substance measure.
Whatman GF/C grass microfiber filters pre–rinsed were applied to filter water samples,
then dried (105℃) and ashed (450℃) (American Public Health Association, 1985). TSS
(Total Suspended Substance) was measured after dried; NVSS (Non–Volatile
Suspended Substance) was determined by weight after ashing, and VSS (Volatile
Suspended Substance) was determined by difference of TSS and NVSS (TSS minus
NVSS).
CHAPTER Ⅱ
27
2.2.2 Chemical variation
The investigation for chemical variation was the same to physical variation that once a month from April 2010 to March 2012. The numbers of investigation was increased during flood period. Whilst, for measuring nutrients changes accompanied by water level rose over time, the specific devices had been designed with PVC pipe and Ping–
pong ball. The flood flow removed the gaps of pipe and floated the ping–pong to seal the pipes. We set the devices in various elevations of 4 sites (site A, site B, site C and site D) from T.P.3 to T.P.7 as shown in Fig. 2–2 and Fig 2–3.
The TN (Total Nitrogen), TP (Total Phosphorus), DTN (Dissolved Total Nitrogen), DTP (Dissolved Total Phosphorus) and NO
3(nitrate nitrogen) was analyzed according HACH methods by HACH DRB/200 and DR/2400 Portable Spectrophotometer. The NO
2(nitrite nitrogen), NH
4(ammonia nitrogen) and PO
4(dissolved orthophosphate) were determined colorimetrically (Methods for the Chemical Analysis of Water and Wastes, EPA) and Shimadzu UV Spectrophotometer was applied for colorimetric estimation; hot–ethanol extraction method was applied to analyze chlorophyll–a (Chen YW et al., 2006).
Figure 2–2 The site selection for dynamics of nutrients variation over time during flood event.
28
Figure 2–3 The 5 PVC pipes were set in every elevation from T.P.3 to T.P.5. A ping–pang ball
was put in the pipe. When water level rose, gaps were removed by water flow, the ping–pang
floated to the mouth of pipe and seal up the pipe. After flood, the water samples in pipes were
collected and analyzed.
CHAPTER Ⅱ
29
2.2.3 Biomass and species richness of phytoplankton
Investigations of phytoplankton were conducted monthly (July 2010–June 2012). The water samples for phytoplankton were collected from surface water in each site and were fixed by Lugol’s acidified solution (1%) as soon as possible. Then precipitating and concentrating the water samples to 40ml in laboratory. An Olympus microscope and algae identification books (Yamagishi T, 2007; Hu H et al., 2005) were used to identify the phytoplankton species.
Algae density calculation (cell/L) was performed in a phytoplankton counting chamber under a microscope (Fig. 2–4). And density of phytoplankton (cell/L) was calculated according to equation as below. Taxa variances were checked with F–test among stations.
N=Ns× Ls Lc
N: cell numbers in 1L sample; Ns: cell numbers in counting chamber; Ls: volume of concentrated sample; Lc: effective volume of water in counting chamber ( 4×10
–4L ).
Figure 2–4 The structure of counting chamber we used in this experiment.
30
2.3 Results
2.2.1 Changes of physical variation and effects of flood on physical variation (1) Changes of water level and flood frequency
We have got water level data over two years in a site of the Matsuura River and 3 sites in the restored wetland. The sites located in Azame–no–se Wetland maintain low average water levels less than 1 meter, and were not influenced by water level of Matsuura River during non–flood period (October to March). Flood period is from April to September every year in Matsuura River basin, however floods also happened in autumn due to typhoon (Nov. 2011). The water level of the Azame–no–se Wetland changed with the water level of Matsuura River during flood event. We observed the highest water level of about T.P. 9 meter both in Matsuura River and the Azame–no–se Wetland in summer of 2012.
Fig. 2–5 shows that the flood frequency changed year by year, there was low flood frequency in 2010 and flooding time was short, whereas, there was high flood frequency in 2012 and flooding time was long. The floods appeared in spring was considered to be important for spawn of fish (Kozaki, 2012). In this research, we also found the floods crucial for T. japonica. Fig.2–5 shows that there was rainfall and flood event in May and June 2010 and 2011, however there was no rainfall in the same time 2012. As a result, Shitaike Pool dried up and the seeds of T. japonica lost its chance for growth.
Though we just get a little data from Tomboike Pool, it was found Tomboike Pool was almost not affected directly by flood event because it was lying the highest in Azame–
no–se Wetland. Whilst, lower lying Shitaike Pool and Ueike Pool were easy to be
influenced by river floods and had higher flood frequency.
CHAPTER Ⅱ
31
Figure 2–5 The variation of water level (T.P. m) in Matsuura River, Ueike Pool, Shitaike Pool and Tomboike Pool. The data of Tomboike Pool was not complete because HOBO U20 Water Level Logger lost.
(2) Water temperature
Fig. 2–6 shows, the water temperature of 4 sites changed identically ranged from 0 to
40℃ that the lowest temperature appeared in January and February, the highest
appeared in August. However, we observed that temperature of daytime and nighttime
were quite different in sites located in the Azame–no–se Wetland (Fig 2–7). The Ueike
Pool was specially fluctuated in day–night during autumn and winter may be due to the
shallow depth of water level. In contrast, water temperature of the Matsuura River kept
at a related stable level. It was also showed by Fig. 2–6 that flood influenced water
32
temperature significantly. When flood event came, water temperature had a sudden descend.
Figure 2–6 The variation of water temperature (
℃) and average water level in Matsuura River,
Ueike Pool, Shitaike Pool and Tomboike Pool. When flood event happened, the water level
peaked (presented by black lines), whilst water temperature decreased.
CHAPTER Ⅱ
33
Figure 2–7 The variation of water temperature (
℃) in Matsuura River, Ueike Pool, Shitaike
Pool during one day (1
stApr. 2011).
34
(3) DO (Dissolved Oxygen)
DO analysis measures the amount of gaseous oxygen dissolved in water. Oxygen gets into water by diffusion from the surrounding air, aeration and as a waste product of photosynthesis. As a result, it closed related to temperature and growth of algae. DO is necessary for good water quality and provide for aerobic life forms.
Table 2–1 shows that DO concentration in Tomboike Pool and Matsuura River kept stable levels and had a high average value. However, the concentration of DO in Shitaike Pool and Ueike Pool changed dramatically (Fig. 2–8) due to growing of T.
japonica, phytoplankton dynamic, flood and other complex reasons.
Fig. 2–8 presents DO prone to increasing to peak values in spring and summer,
because enough nutrients could support growth of phytoplankton. The flood event
influenced DO that DO decreased when flood came. By comparing the DO in different
depth, we found DO value almost did not dropped vertically from surface water to
deeper water of 20–60cm when flood event happened.
CHAPTER Ⅱ
35
Figure 2–8 Variation of DO (mg/L) in 4 sits from Aug. 2010 to Oct. 2012. When water level
became higher, the deep layer of water had been also measured. The green symbolize indicates
the date of flood event.
36
(4) pH
pH is an important index for water quality, the value of pH affects many chemical and biological processes in the water. The largest variety of aquatic animals prefers a range of 6.5–8.0. The pH outside this range reduces the diversity in the stream because it stresses the physiological systems of most organisms and can reduce reproduction.
Low pH can also allow toxic elements and compounds to become mobile and
"available" for uptake by aquatic plants and animals.
The pH of the Matsuura River was steady, whilst the pH of the Shitaike Pool and the Ueike Pool was affected by phytoplankton growth in spring and summer. Because photosynthesis of phytoplankton produced DO and it could increase pH in water.
Besides, it should be attended that in summer of 2010 and 2011, pH in the Shitaike Pool
kept low values below 7 persistently, the low DO promoted the production of poisonous,
and the low value of pH could increase the poisonous gas for example H
2S and
enhanced the toxicity of poisonous gas by synergistic effects. And, similar to the effects
of flood event on DO, pH decreased suddenly when flood event came (Fig. 2–9).
CHAPTER Ⅱ
37
Figure 2–9 Variation of pH in 4 sites from Sep. 2010 to Oct. 2012. When water level became
higher, the deeper layer of water was also measured. The green symbolize indicates the date of
flood event.
38
Table 2–1 Summary of average value and varied range of physical variations in each sits. Nor.
means the normal period (Oct.–Mar.) and Flo. Means the flood period (Apr.–Sep.) . Shitaike Pool Ueike Pool Tomboike Pool Matsuura River
Temperature (℃) 17.66(3.68–32.35) 17.69(3.60–38.14) 17.57(4.03–31.77) 17.49(4.20–28.05)
Depth (m)
Nor. 0.21(0.10–0.28) 0.30(0.24–0.40) 0.41(0.28–0.53) 0.41(0.31–0.48)
Flo. 0.49(0.28–5.60) 0.50(0.24–5.55) 1.17(0.51–4.50) 0.75(0.40–6.00)
DO (mg/L) 8.79(2.58–16.27) 8.31(5.46–13.24) 9.26(7.11–13.95) 9.64(7.10–14.66)
pH 7.02(6.35–8.49) 6.9–4(5.6–8.24) 7.12(6.38–9.39) 6.87(6.02–7.44)
(5) Suspended Solids (SS)
Suspended solids can clog fish gills, either killing them or reducing their growth rate (Au DWT, et al., 2004). They also reduce light penetration and reduce the phytoplankton (Sherk JA et al., 1976). Indirectly, the suspended solids affect other parameters such as temperature and dissolved oxygen. Because of the greater heat absorbency of the particulate matter, the surface water becomes warmer.
The value of SS of the Shitaike Pool was the highest of all of sites, there was a low percentage of VSS from July to September in 2010 might be due to growth of algae affected by T. japonica bloom. However, VSS increased due to phytoplankton growing from October of 2010. Which indicated the VSS closed related to concentration of chlorophyll–a and the relationship. Compared to the Shitaike Pool, the Ueike Pool had a lower value of SS might because filter function of mussels. The Tomboike Pool and Matsuura River had low SS values, but SS of the Matsuura River increased in flood event. Whilst, flood flow promoted water quality that both VSS and NVSS concentration of the Shitaike Pool and the Ueike Pool decreased after flood event (Fig.
2–10).
CHAPTER Ⅱ
39
Figure 2–10 Variation of VSS and NVSS (mg/L) in 4 sites from Jul. 2010 to Nov. 2011. The
green symbolize indicates the date of flood event.
40
2.2.2 Changes of chemical variation nutrients effect of flood on chemical variation
(1) Changes of nutrients after flood event in each site
Nutrients, such as nitrogen and phosphorus, are essential for plant and animal growth and nourishment. We observed twice floods in May and June of 2011 to research the changes of nutrients before and after flood.
Nitrogen
Total nitrogen in natural water consisted mainly by dissolved nitrogen, in the forms of nitrate, nitrite, or ammonium, is a nutrient needed for plant growth. In twice flood event (marked by green in Fig. 2–11), When floods events happened, apart from Tomboike Pool, TN including PTN and DTN in all of sites tended to increase significantly (Fig. 2–
11).
In the flood event happened in May of 2011, in the wetland, there was higher TN concentration than flood flow in Matsuura River on account of disturbance and releasing of sediment. As a result, PTN concentration increased especially significantly.
Flood event happened in June of 2011 carried a lot of DTN in its flood flow (Fig. 2–
11), however, floodwater flowed into the wetland had been cut off 53.3% DTN (in which 56.7% was NO
3) (Fig. 2–12), which might due to high primary production in the wetland. It also indicated the purification function of wetland.
After flood event, the nitrogen forms in water of the Shitaike Pool and the Ueike Pool changed obviously that the ratio of PTN reduced while the ratio of DTN increased.
In non–flood period, nitrogen concentration changed dramatically in the Shitaike
Pool and the Ueike Pool. We attended high concentration of NH
3–N (Fig.2–13) in
summer of 2010 the suggested water quality deteriorated under a low DO condition due
to T. japonica bloom. Compared to the Shitaike Pool, the Ueike Pool had related low
nitrogen (Table 2–2) that indicated the Ueike Pool became a better habitat than the
Shitaike Pool. Nevertheless, the Tomboike Pool was less affected by floods, as a result,
didn’t have fertile sediment as the Shitaike Pool and the Ueike Pool had, which made
the nitrogen concentration kept at a low level with no significant changes in the
Tomboike Pool. Table 2–2 shows that nitrogen loads of Matsuura River were high
CHAPTER Ⅱ
41
during flood period. We can infer that the surface runoff of agriculture largely
contributed to the nitrogen load. The Matsuura River also had a high average
concentration of TN (1.32mg/L) and DTN (1.23mg/L) even in normal period. The
griculture pollution in Matsuura River basin should be regarded in future.
42
Figure 2–11 Variation of PTN concentration and DTN concentration (mg/L) in 4 sites from Jul.
2010 to Feb. 2012. The green symbolize indicates the date of flood event.
CHAPTER Ⅱ
43
Figure 2–12 Variation of NO
3concentration (mg/L) in 4 sites from Jul. 2010 to Feb. 2012. The green symbolize indicates the date of flood event. The Ueike Pool and the Shitaike Pool had cut down the NO3 concentration during flood event
0.0 0.5 1.0 1.5 2.0
2010-7-29 2010-8-4 2010-8-11 2010-8-26 2010-9-8 2010-9-30 2010-10-14 2010-11-4 2011-3-17 2011-4-17 2011-5-12 2011-5-19 2011-6-10 2011-6-12 2011-6-13 2011-6-23 2011-7-28 2011-8-31 2011-9-22 2011-10-28 2011-11-25 2011-12-21 2012-1-20 2012-2-20
NO3 (mg/L)
Tomboike Matsuura 0.0
0.5 1.0 1.5 2.0
2010-7-29 2010-8-4 2010-8-11 2010-8-26 2010-9-8 2010-9-30 2010-10-14 2010-11-4 2011-3-17 2011-4-17 2011-5-12 2011-5-19 2011-6-10 2011-6-12 2011-6-13 2011-6-23 2011-7-28 2011-8-31 2011-9-22 2011-10-28 2011-11-25 2011-12-21 2012-1-20 2012-2-20
NO3 (mg/L)
Ueike Shitaike
44
Figure 2–13 Variation of NH
3concentration (mg/L) from July. 2010 to Feb. 2012 in 4 sites. The green symbolize indicatess the date of flood event. The high value of NH3 appeared in summer of 2010 in Shitaike Pool indicate the anaerobic environment due to by bloom of T. japonica
0.0 0.1 0.2 0.3 0.4
2010-7-29 2010-8-4 2010-8-11 2010-8-26 2010-9-8 2010-9-30 2010-10-14 2010-11-4 2011-3-17 2011-4-17 2011-5-12 2011-5-19 2011-6-10 2011-6-12 2011-6-13 2011-6-23 2011-7-28 2011-8-31 2011-9-22 2011-10-28 2011-11-25 2011-12-21 2012-1-20 2012-2-20
NH3-H (mg/L)
Tomboike Matsuura 0.0
0.1 0.2 0.3 0.4
2010-7-29 2010-8-4 2010-8-11 2010-8-26 2010-9-8 2010-9-30 2010-10-14 2010-11-4 2011-3-17 2011-4-17 2011-5-12 2011-5-19 2011-6-10 2011-6-12 2011-6-13 2011-6-23 2011-7-28 2011-8-31 2011-9-22 2011-10-28 2011-11-25 2011-12-21 2012-1-20 2012-2-20
NH3-H (mg/L)
Ueike Shitaike
CHAPTER Ⅱ
45
Phosphorus
Both phosphorus and nitrogen are essential nutrients for the plants and animals that make up the aquatic food web. Since phosphorus is the nutrient in short supply in most fresh waters, even a modest increase in phosphorus can, under the right conditions, set off a whole chain of undesirable events in a stream including accelerated plant growth, algae blooms, low dissolved oxygen, and the death of certain fish, invertebrates, and other aquatic animals. There are many sources of phosphorus, both natural and human.
These include soil and rocks, wastewater treatment plants, runoff from fertilized lawns, runoff from animal manure storage areas and so on.
The flood happened in May of 2011 didn’t carried large amount of phosphorus in its flood flow (Fig. 2–14), TP in the Shitaike Pool and the Ueike Pool also had no significant changes, nevertheless, DTP increased slightly in the two sites that might due to disturbance of sediment but not flood flow. Because the DTP concentration in the two pools was higher than that in flood flow. Both PTP and DTP increased in the Tomboike Pool and we presume it contributed by the runoff from terrace (Fig. 2–1) next to it.
During flood event happened in June of 2011, the flood flow carried a lot of phosphorus and the TP concentration peaked to 0.83 mg/L in the river. It largely influenced the Ueike Pool that concentration of both PTP and DTP increased significantly. Since water of the Shitaike Pool had high background level, the flood just enhanced PTP concentration in the pool.
One day later after flood event in June, similar to changes of nitrogen, both PTP and DTP concentration decreased but ratio of DTP increased. Nevertheless, the condition didn’t continue more than one week that the concentration decreased after flood.
However, the phosphorus concentration increased week later both in May and June.
Which indicated the Azame–no–se Wetland is a source of phosphorus thanks to the floods supply, and the sediment has the potential to release phosphorus.
In non–flood period, the Shitaike Pool had a surprising high average TP concentration of 0.41 mg/L and PTP concentration of 0.31 mg/L, PTP is the main form of TP and had a significantly positive correlation with TP in the sites (Fig. 2–15a). The high PTP was on account of low water level that the sediment easy to be disturbed even by wind, as a result, PTP concentration also related to TSS concentration (Fig. 2–15b). Besides, PTP concentration had a positive relationship with chlorophyll–a concentration (Fig. 2–15c).
However, average concentration of DTP was low of 0.1 mg/L that might relate to
46
growth of T. japonica and phytoplankton (Table. 2–2). Even the Ueike Pool have
similar water level to the Shitaike Pool (Table 2–1), it had low average concentration of
PTP and we suggested it due to filter of mussels. As presumed before, the same as
nitrogen, Matsuura River has a high phosphorus level which might cause by agriculture,
and the eutrophication risk should be assessed.
CHAPTER Ⅱ
47
Figure 2–14 Variation of PTP concentration and DTP concentration (mg/L) from July. 2010 to
Feb. 2012 in 4 sites. The green marks indicates the date of flood event.
48
(a) (b) (c)
Figure 2–15 (a) Relationship between TP, PTN and PTP. The concentration of PTP positively related to TP concentration significantly; (b) Relationship between TSS, DTP and PTP. The concentration of PTP relate to TSS concentration positively; (c) Relationship between chlorophyll–a (mg/m3), DTP and PTP. There is positive correlation between PTP and chlorophyll–a.
Table 2–2 Summary of average values and varied range of nutrients variations in each sits. Nor.
means the normal period (Oct.–Mar.) and Flo. Means the flood period (Apr.–Sep.)
Ueike Pool Shitaike Pool Tomboike Pool Matsuura River
TN (mg/L)
Nor. 0.99(0.50–1.01) 2.36(1.20–3.60) 0.79(0.30–1.20) 1.32(1.00–1.80) Flo. 1.64(0.80–3.10) 1.81(0.60–4.00) 0.92(0.30–2.20) 1.44(0.70–4.40)
TP (mg/L)
Nor. 0.25(0.14–0.36) 0.41(0.21–0.63) 0.21(0.10–0.31) 0.19(0.07–0.3) Flo. 0.39(0.18–0.66) 0.46(0.21–0.75) 0.20(0.07–0.34) 0.27(0.13–0.82)
DTN (mg/L)
Nor. 0.74(0.45–1.00) 1.23(0.55–2.11) 0.54(0.20–1.05) 1.23(0.90–1.40) Flo. 0.99(0.50–1.25) 0.98(0.40–2.1) 0.53(0.20–0.90) 1.10(0.30–3.35)
DTP (mg/L)
Nor. 0.07(0.04–0.10) 0.10(0.03–0.12) 0.12(0.03–0.27) 0.11(0.03–0.27) Flo. 0.14(0.07–0.25) 0.13(0.07–0.28) 0.07(0.03–0.21) 0.13(0.06–0.41)
CHAPTER Ⅱ
49
(2) Changes of nutrients over time during flood event
During the flood happened in 10
th–12
thJune 2011, water samples ranged from T.P.
3.0m to T.P. 7.0m in 4 sites were collected (Fig. 2–1) and the nutrients were analyzed.
Based on water level data measured by HOBO U20 Water Level Logger (Fig. 2–16), the time of water samples on each elevation was found and summarized in Table 2–3.
Fig. 2–16 Changes of water level in Matsuura River (site A), Shitaike Pool (site C) and Ueike Pool (sit B) over time during a flood (10
thJune–12
thJune 2011). The water level of entrance (site B) was set to be the same as Matsuura River.
Table 2–3 Time of captured water samples on each elevation in Matsuura River (site A), Shitaike Pool (site C) and Ueike Pool (sit B) in a flood (10
thJune–12
thJune 2011). The water level of entrance (site B) was set to be the same as Matsuura River. There was no sample captured at 7m of Ueike Pool.
Matsuura Shitaike Ueike
T.P. 3m 6/10 23:00 6/11 00:00 6/11 01:00
T.P. 4m 6/11 06:00 6/11 07:00 6/11 07:00
T.P. 5m 6/11 08:00 6/11 09:00 6/11 09:00
T.P. 6m 6/11 10:00 6/11 11:00 6/12 14:00
T.P. 7m 6/12 16:00 6/12 16:00 no data
50
Fig. 2–17, 18 show time curves of nutrients during the flood in 4 sites. The time curves of Ueike Pool lagged behind Shitaike Pool and Shitaike Pool lagged behind the river.
Nitrogen: Fig. 2–17 shows TN concentration in Matsuura River (site A) and entrance (site B) was not high at the beginning. As time went on, TN concentration in Matsuura River (site A) and entrance (site B) increased and peaked when water level arrived to T.P. 4.0m. Because non–point agriculture source distributed to the nutrients load and the flow was not large at that time. TN concentration in Matsuura River decreased accompanied by the flow increased. TN concentration was quite high in Shitaike Pool (site C) when water level became T.P. 3.0m (height of creek left bank), however, DTN was not so high at the same time. It indicated the sediment of Shitaike Pool was disturbed at the beginning of flood, might due to the pool was near to the entrance. TN concentration in Ueike Pool (site D) was low when water lever was T.P. 3m due to it was far away from entrance and not be disturbed. As time went on, water level rose and TN concentration in Shitaike Pool and Ueike Pool decreased. TN and DTN concentration in the two pools and entrance became to be the same when water level arrived to T.P. 6m–7m.
It found that TN concentration in the river was higher than that in the wetland when water level rose over T.P. 4m. DTN concentration in the river kept higher than that in the wetland. It suggested the wetland could reduce nitrogen by sediment absorption and deposition.
Phosphorus: Fig. 2-18 shows that TP concentration in Matsuura River (site A) didn’t have regular variation over time, however DTP concentration increased and peaked when water level became T.P. 6m. TP and DTP concentration in the entrance (site B) peaked when water level arrived T.P. 4m, and decreased by water level increased over T.P. 4m. TP concentration in Shitaike Pool (site C) was not high at the beginning when water level was T.P. 3.0, however, DTP was not so high at the same time. It indicated the sediment disturbance. TP concentration in Ueike Pool (site D) kept decreased over time, however DTP concentration increased when water level rose over T.P. 4.0m.
It found that TP and DTP concentration in the Shitaike Pool was higher than that in
the river until water level arrived to T.P. 4m. It might due to the high background value
CHAPTER Ⅱ
51
of TP in Shitaike Pool. TP concentration in Ueike Pool was lower than that in the river and it also indicated the wetland could reduce Phosphorus by sediment absorption and deposition during flood.
Figure 2–17 The concentration of nitrogen (mg/L) from T.P 3.0 to T.P. 7.0 in each site over time.
T.P. 7.0 of Ueike Pool didn’t be collected because it didn’t affected by flood event this time.
52
Figure 2–18 The concentration of phosphorus (mg/L) from T.P 3.0 to T.P. 7.0 in each site over time. T.P. 7.0 of Ueike Pool didn’t be collected because it didn’t affected by flood event this time
3.50mg/L
CHAPTER Ⅱ
53
2.2.3 Changes of biomass and species of phytoplankton variation due to flood Chlorophyll–a concentration in the Ueike Pool and the Shitaike Pool affected by flood event that it diluted temporarily during flood event happened in May and June, 2011 (Fig. 2–19). However, the concentration of chlorophyll–a increased and tended to recovered to normal level just one week later in the two pools, due to enough dissolved nutrients supported by floods (Fig. 2–20). The Tomboike Pool locates higher in the Azame–no–se Wetland and it didn’t involve by flood and didn’t present significant changes.
The chlorophyll–a concentration changed mainly due to phytoplankton dynamic that it increased in spring and summer, decreased in later autumn and winter. The Ueike Pool and the Shitaike Pool had enough nutrients and it was showed higher average value of chlorophyll–a concentration. Bloom of T. japonica also influenced growth of phytoplankton. Float leaves of T. japonica overspread water surface and hinder photosynthesis of phytoplankton which caused decreasing of chlorophyll–a. At the other hand, root, stem and leaves of T. japonica could uptake nutrients from soil and water during it growing period, deletion of dissolved nutrients (Masahiro W. et al, 2010) might cut down of phytoplankton. As Fig. 2–19 showed, in summer of 2010 when biomass of T.
japonica arrived to the peak biomass, concentration of chlorophyll–a reduced to the lowest. With death of T. japonica in autumn, nutrients contained in T. japonica released back into water and phytoplankton could get a good chance for growing in this time. As it showed in Fig. 2–20, concentration of chlorophyll–a increased from September in 2010.
In August of 2011, biomass of T. japonica was decreased by about 70% and we didn’t
find sudden drop due to T. japonica. It implied biomass of T. japonica determines
biomass of phytoplankton.
54
Figure 2–19 Variation of chlorophyll–a concentration (mg/m
3) in each site from Jul. 2010 to
May 2012. The green symbolize indicates flood period.
CHAPTER Ⅱ
55