➨ ᅇࠕᏱᐂ⎔ቃࢩ࣏ࣥࢪ࣒࢘ࠖㅮ₇ㄽᩥ㞟
207
ᝨᫍ㛫⯟⾜ྥࡅࡓࢯ࣮࣮ࣛࢭࣝ࿘㎶ࡢࣉࣛࢬ࣐ᣲືᇶ♏ゎᯒ
ۑᮧ୰ᓫಙ㸦JEDI/JAXA㸧㸪ୖ⏣⿱Ꮚ㸦ISAS/JAXA, JST/CREST㸧㸪⮻ⱥஅ㸦⚄ᡞ㝔㸧㸪
⠛ཎ⫱㸦ISAS/JAXA㸧
Fundamental Analysis of Plasma Behavior around a Solar Sail for Interplanetary Flight
by
Takanobu Muranaka, Hiroko O. Ueda, Hideyuki Usui, and Iku Shinohara (ISAS/JAXA)
Key Words: solar sail, 3D electrostatic full Particle-In-Cell Code, spacecraft charging, photoelectron emission
㸯㸬ࡣࡌࡵ
⌧ᅾ㸪ᮏ◊✲ࢢ࣮ࣝࣉ࡛ࡣᏱᐂᶵࡑࡢ࿘㎶Ꮡ ᅾࡍࡿࣉࣛࢬ࣐ࡢ┦స⏝ࡢヲ⣽ࢆゎᯒࡍࡿࢶ࣮
ࣝࡢࡦࡘࡋ࡚㸪ᆺィ⟬ᶵ࡛ࡢつᶍ୪ิ₇⟬
⏝3ḟඖ⢏Ꮚ㟼㟁ࢥ࣮ࢻࢆ㛤Ⓨࡋ࡚࠸ࡿ㸬ᮏࢥ࣮
ࢻࡣ㸪Particle-In-Cell (PIC) ἲ1)ᇶ࡙ࡁ㸪ࣉࣛࢬ࣐୰
ࡢ࢜ࣥ㟁Ꮚࡘ࠸࡚㸪㐠ື᪉⛬ᘧࢆ㝧ゎࡃࡇ
࡛┤᥋㌶㐨ࢆồࡵ㸪㟼㟁ሙࡘ࠸࡚ࡣࣇ࣮࢚ࣜኚ
ࡼࡗ࡚┤᥋ゎࢆồࡵࡿࡓࡵ㸪ࡑࢀࡒࢀࡘ࠸࡚
ཝᐦゎࢆᚓࡿࡇࡀ࡛ࡁࡿ࠸࠺≉ᚩࢆᣢࡘ㸬⌧ᅾ 㛤Ⓨࡢ➨୍ẁ㝵ࡋ࡚㸪3ḟඖ➼ᖜ┤᱁Ꮚࢆ㐺⏝ࡋ ࡓィ⟬ࣔࢹࣝࡢᇶᮏᶵ⬟ࡢ㛤Ⓨࢆࡰࡋࡓ㸬㛤
Ⓨࡋࡓࢥ࣮ࢻࢆ⏝ࡋ࡚㸪ࡇࢀࡲ࡛㸪⛉Ꮫ⾨ᫍ
ࡼࡿ㟁ィ ࡢ㧗ᗘ㛵ࡍࡿࢩ࣑࣮ࣗࣞࢩࣙࣥ࡞
ࢆ⾜ࡗ࡚ࡁࡓࡀ㸪ࡇࡇ࡛ࡣ㸪ᮏࢥ࣮ࢻࡢ᪂ࡓ࡞ゎ ᯒᑐ㇟ࡢᒎ㛤ࡋ࡚㸪ᝨᫍ㛫⯟⾜ࢩࢫࢸ࣒ࡢࡦ
ࡘ࡛࠶ࡿࢯ࣮࣮ࣛࢭࣝ࿘㎶ࡢࣉࣛࢬ࣐ᣲືゎᯒࢆ
⾜ࡗࡓ㸬
㸰㸬ࢯ࣮࣮ࣛࢭࣝືసཎ⌮ࣉࣛࢬ࣐⎔ቃ ࢯ࣮࣮ࣛࢭࣝࡣ㸪ࡑࡢྡࡀ♧ࡍࡼ࠺㸪ኴ㝧ග ᅽࢆ᥎㐍ຊࡋ࡚⏝ࡍࡿᏱᐂᶵ࡛࠶ࡿ㸬࠾ࡼࡑȣ Pa⛬ᗘࡢᚤᑠ࡞ኴ㝧ගᅽࡽᏱᐂᶵࡢ᥎ຊࢆᚓࡿⅭ
㸪104m2⛬ᗘࡢ㠃✚ࡢⷧ⭷ࢆ㸪ኴ㝧ගᅽࢆཷࡅࡿ
ᕹࡋ࡚⏝ࡍࡿࡇࡀ⪃࠼ࡽࢀ࡚࠸ࡿ㸬ࢯ࣮࣮ࣛ
ࢭࣝࡣ㸪ᝨᫍ㛫⯟⾜ࡣኴ㝧㢼ࣉࣛࢬ࣐⎔ቃ୰
Ꮡᅾࡍࡿ㸬ࡇࡢࡁ㸪ࢭࣝࡢࢫࢣ࣮ࣝ㛗ࡀኴ㝧 㢼ࣉࣛࢬ࣐ࡢࢹࣂ㛗ࡼࡾ࡛࠶ࡿࡓࡵ㸪ࢭࣝ࿘
㎶ࡢࣉࣛࢬ࣐✵㛫ศᕸࢆゎᯒࡍࡿࡣ㸪ࢭࣝ࿘㎶
⨨ࡍࡿ࣮࣌ࣟࢻ࠾ࡼࡧྛ✀ィ ჾࡢ㓄⨨ࢆỴ ᐃࡍࡿୖ࡛㔜せ࡛࠶ࡿゝ࠼ࡿ㸬ࡲࡓ㸪᪥↷࠾
ࡅࡿኴ㝧㢼ࣉࣛࢬ࣐⎔ቃ࡛ࡣ㸪⫼ᬒࣉࣛࢬ࣐ຍ࠼
࡚㸪ග㟁Ꮚ㟁ὶࡀせ࡞㟁ὶᡂศ࡛࠶ࡿࡓࡵ㸪ࡇࡢ ᙳ㡪ࡶ⪃៖ࡍࡿᚲせࡀ࠶ࡿ㸬
㸱㸬ࢯ࣮࣮ࣛࢭࣝ࿘㎶ࡢࣉࣛࢬ࣐ᣲືゎᯒ
ᮏ⠇࡛ࡣ㸪㛤Ⓨࡋࡓ3ḟඖ⢏Ꮚ㟼㟁ࢥ࣮ࢻࡼ
ࡿ㸪ࢯ࣮࣮ࣛࢭࣝ࿘㎶ࡢࣉࣛࢬ࣐ᣲືゎᯒ⤖ᯝ
ࡘ࠸࡚ሗ࿌ࡍࡿ㸬࡞ゎᯒ┠ᶆࡣ㸪㸯㸧ࢯ࣮࣮ࣛࢭ
ࣝࡢᵓయᾋື㟁ࢆồࡵࡿ㸪㸰㸧ᨺฟග㟁Ꮚࢆ
ྵࡴࢯ࣮࣮ࣛࢭࣝ࿘㎶ࡢࣉࣛࢬ࣐✵㛫ศᕸࢆồࡵ
ࡿ㸪ࡢ2Ⅼ࡛࠶ࡿ㸬㸯㸧ࡘ࠸࡚ࡣ㸪Ᏹᐂᶵᖏ㟁ゎ ᯒࢯࣇࢺ࢙࢘MUSCATࡼࡿணഛⓗゎᯒࢆཧ↷ࡋ ࡓ㸬ࡲࡓ㸪㸰㸧ࡘ࠸࡚ࡣ㸪ࢯ࣮࣮ࣛࢭࣝࡢࢫࢣ
࣮ࣝ㛗ࡼࡿ㐪࠸ࡶ᳨ドࡋࡓ㸬
Table 1ࢩ࣑࣮ࣗࣞࢩࣙࣥ⏝ࡋࡓྛ✀ࣃ࣓ࣛ
࣮ࢱࢆ♧ࡍ㸬ࢩ࣑࣮ࣗࣞࢩࣙࣥ⪃៖ࡋࡓⲴ㟁⢏Ꮚ ࡣ㸪⫼ᬒ㟁Ꮚ㸪Ỉ⣲࢜ࣥ㸪࠾ࡼࡧග㟁Ꮚ࡛࠶ࡿ㸬 ィ⟬᱁Ꮚࡣග㟁Ꮚࡢࢹࣂ㛗┦ᙜࡢ㛗ࡉ0.5mࢆ✵㛫
้ࡳᖜࡋ࡚ᵓᡂࡋࡓ㸬Fig. 1ィ⟬య⣔ࢆ♧ࡍ㸬ࢯ
࣮࣮ࣛࢭࣝࡣ⯟⾜㸪ኴ㝧ග࠾ࡼࡧኴ㝧㢼ᑐࡋ
࡚45ᗘࡢഴᩳゅࢆᣢࡘࡀ㸪ࡇࡇ࡛ࡣ⡆༢ࡢࡓࡵࡇࢀ
ࡽࡀࢭࣝᑐࡋ࡚ᆶ┤ධᑕࡍࡿࡋࡓ㸬
ࡲࡎጞࡵ㸪ࡇࢀࡽࡢࣉࣛࢬ࣐⎔ቃ࡛ࡢࢯ࣮࣮ࣛ
ࢭࣝࡢᾋື㟁ࢆồࡵࡓ⤖ᯝ㸪࠾ࡼࡑ+4.3Vࡢᐃᖖ
್ࡀᚓࡽࢀࡓ㸬ᮏࢩ࣑࣮ࣗࣞࢩࣙࣥ௨๓㸪⣽⏣
ඵ⏣ࡼࡗ࡚㸪MUSCATࡼࡿྠࢯ࣮࣮ࣛࢭࣝࣔ
ࢹࣝࡢᖏ㟁ィ⟬2)ࡀᐇࡉࢀࡓ㸬ࡇࡢ⤖ᯝ࡛ࡣFig.2
Table 1. Computation parameters for a solar wind environment.
This document is provided by JAXA.
Ᏹᐂ⯟✵◊✲㛤Ⓨᶵᵓ≉ู㈨ᩱ䚷JAXA–SP–09–006
208
♧ࡍࡼ࠺㸪ࢯ࣮࣮ࣛࢭࣝࡢᾋື㟁ᐃᖖ್ࡣ
࠾ࡼࡑ+10V࡞ࡾ㸪㠃⤯⦕యࡢ㟁ᕪ࡛࠶ࡿ
㞳㟁ࡶᖏᨺ㟁⌧㇟ၥ㢟࡞࠸⛬ᗘ࡛࠶ࡿ⤖ᯝࡀᚓ
ࡽࢀ࡚࠸ࡿ㸬ࡇࡇ࡛㸪MUSCATࢩ࣑࣮ࣗࣞࢩ࡛ࣙࣥ
ࡣ㸪ኴ㝧ග࠾ࡼࡧኴ㝧㢼ࡣࢯ࣮࣮ࣛࢭࣝ㠃ᑐࡋ
࡚45ᗘධᑕࡢ᮲௳࡛ᖏ㟁ィ⟬ࡀᐇ⾜ࡉࢀ࡚࠾ࡾ㸪ࡲ
ࡓ㸪Ⲵ㟁⢏Ꮚࡢᙳ㡪ࡋ࡚㸪ග㟁Ꮚຍ࠼࡚㸪ḟ 㟁Ꮚࡶ⪃៖ࡉࢀ࡚࠸ࡿ㸬
Fig. 3ࢩ࣑࣮ࣗࣞࢩࣙࣥ⤖ᯝࡼࡗ࡚ᚓࡽࢀࡓ㸪
⫼ᬒ࢜ࣥ࠾ࡼࡧ㟁Ꮚࡢ✵㛫ศᕸࢆ♧ࡍ㸬ኴ㝧㢼ࢻ
ࣜࣇࢺ㏿ᗘࡣ㸪⫼ᬒ࢜ࣥࡢ㡢㏿ᑐࡋ࡚࣐ࢵࣁᩘ
10⛬ᗘࡢ㉸㡢㏿࡛࠶ࡿࡓࡵ㸪ࢯ࣮࣮ࣛࢭࣝࡢୗὶ
࡛ᐦᗘࡀᕼⷧ࡞ࡿwake㡿ᇦࡀⓎ⏕ࡍࡿ㸬୍᪉㸪⫼
ᬒ㟁Ꮚᑐࡋ࡚ࡣ㸪ྠࢻࣜࣇࢺ㏿ᗘࡣள㡢㏿࡛࠶ࡿ
ࡓࡵ㸪᫂░࡞wake㡿ᇦࡣⓎ⏕ࡋ࡞࠸㸬ࡇࡢࡓࡵ㸪ࢯ
࣮࣮ࣛࢭࣝࡢୗὶ࡛ࡣ㸪⫼ᬒ㟁Ꮚࡀᐦ࡞ࡾ㸪Fig.
4♧ࡍࡼ࠺㸪㈇ࡢ✵㛫㟁ࡀᙧᡂࡉࢀࡿ㸬
Fig. 5ࢯ࣮࣮ࣛࢭࣝ୰ᚰ࡛ࢫࣛࢫࡋࡓ㸪ග㟁Ꮚ
ᩘᐦᗘࡢ2ḟඖ✵㛫ศᕸࡢ㛫Ⓨᒎࢆ♧ࡍ㸬ࡇࢀࡽࡢ ᅗࡢ୰ᚰ⨨ࡍࡿࢭࣝࡢྑഃࡀ᪥↷㠃࡛㸪ࡇࡢ
Fig. 2 Electric potential distribution on a conductor of a solar sail model obtained by MUSCAT analysis. We use the same plasma parameters for our computation as used in this simulation. The direction of the solar flux and the solar wind is 45 degrees from the normal of the surface.
Fig. 1 Numerical domain and geometric condition of the simulation. The y-direction into the paper has the same geometry as the z-direction.
Fig. 3 Spatial distributions of the ambient ions (above) and electrons (below) at 0.5 ms in xy-plane (z=64). Contours show the number density of the ions and electrons in m-3. Numerical domain is 128*128*128 in X*Y*Z dimensions. A wake structure of ambient ions is recognized in the downstream region behind the model.
Fig. 4 Spatial distribution of the electric potential (V) in zx-plane (y=64) at 0.5 ms. Negative potential up to -2.0 V is shown in the downstream region behind the model due to ion wake.
This document is provided by JAXA.
➨ ᅇࠕᏱᐂ⎔ቃࢩ࣏ࣥࢪ࣒࢘ࠖㅮ₇ㄽᩥ㞟
209
㠃ࡽග㟁Ꮚࡀᨺฟࡉࢀࡿ㸬ᨺฟࡉࢀࡓග㟁Ꮚࡣ㸪
ࢭࣝࡢ㠃ᣑᩓࡋ࡚࠸ࡃᵝᏊࡀ☜ㄆฟ᮶ࡿࡀ㸪 ኴ㝧㢼ୗὶഃ࡛㈇ࡢ✵㛫㟁ࡀᙧᡂࡉࢀࡿ㡿ᇦࡣ㸪 ග㟁Ꮚࡣᣑᩓ࡛ࡁ࡞࠸ࡇࡀศࡿ㸬ࡲࡓ㸪ᮏࢣ࣮
ࢫ࡛ࡣࢭࣝࡢ㠃୰ᚰ㏆ഐᣑᩓࡍࡿග㟁Ꮚᩘᐦ ᗘࡣ㸪⫼ᬒ㟁Ꮚᩘᐦᗘ࠾ࡼࡑ➼ࡋ࠸࣮࢜ࢲ࣮࡞
ࡗࡓ㸬
ḟ㸪ࢯ࣮࣮ࣛࢭࣝ࿘㎶ࡢࣉࣛࢬ࣐ᣲືᑐࡍ
ࡿ㸪ࢭࣝࡢࢫࢣ࣮ࣝ㛗ࡢᙳ㡪ࢆㄪᰝࡍࡿⅭ㸪ࢭ
ࣝ㠃✚ࢆ๓ࢣ࣮ࢫࡢ㸲ಸࡋ࡚ྠᵝࡢࢩ࣑࣮ࣗࣞ
ࢩࣙࣥࢆ⾜ࡗࡓ㸬ࢭࣝࡢࢧࢬࡣ28*28*0.5(m)࡛࠶
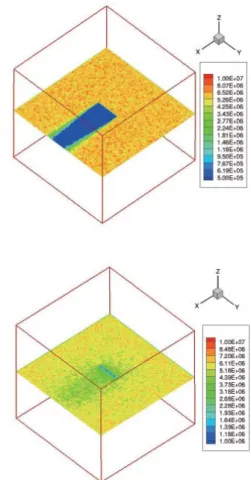
ࡿ㸬Fig. 6࠾ࡼࡧFig. 7㸪ࡑࢀࡒࢀ✵㛫㟁ග㟁Ꮚ
ᩘᐦᗘࡢḟඖࣉࣟࢵࢺࢆ♧ࡍ㸬๓ࢣ࣮ࢫྠᵝ㸪 ࢯ࣮࣮ࣛࢭࣝୗὶഃ࡛ࡣ㸪࢜ࣥwake㉳ᅉࡍࡿ
㈇ࡢ✵㛫㟁ࡀᙧᡂࡉࢀࡿࡀ㸪ࡑࡢ᭱ᑠ್ࡀ๓ࢣ࣮
ࢫ࡛ࡣ-2V࡛࠶ࡗࡓࡢᑐࡋ࡚㸪ᮏࢣ࣮ࢫ࡛ࡣ-6Vࡲ
࡛పୗࡋࡓ㸬✵㛫㟁ࡢ᭱ᑠ್ࡀపୗࡍࡿ࡛㸪ࢯ
࣮࣮ࣛࢭࣝࡢ㠃୰ᚰᣑᩓࡍࡿග㟁Ꮚᩘᐦᗘࡶ
పୗࡋ㸪ᮏࢣ࣮ࢫ࡛ࡣ⫼ᬒ㟁Ꮚᩘᐦᗘẚ㍑ࡋ࡚2᱆ ௨ୖప࠸್࡞ࡿࡇࡀศࡗࡓ㸬ࡇࡢࡼ࠺㸪ࢯ
࣮࣮ࣛࢭࣝࡢࢫࢣ࣮ࣝ㛗ࡀኚࡍࡿ㸪ࢭࣝࡢ
ୗὶഃᙧᡂࡉࢀࡿ✵㛫㟁ᙳ㡪ࢆཬࡰࡋ㸪ࢭ
ࣝ㠃㏆ഐࡢග㟁Ꮚᣑᩓ⠊ᅖࡀኚࡍࡿゝ࠼ࡿ㸬
Fig. 5 Spatial distributions of the photoelectrons at t=0.025 ms (top), 0.125 ms (middle) and 0.5 ms (bottom) in zx-plane, respectively. Contours show the number density of the photoelectrons in m-3. Numerical domain is 128*128*128 in X*Y*Z dimensions. Part of photoelectrons originally emitted from the right hand side surface of the model in the figures diffuse to the rear surface of the model.
Fig. 6 Spatial distributions of the photoelectrons at t=0.5 ms in zx-plane at y=128 grid without plasma flow. Contours show the number density of the photoelectrons in m-3. The X- and Z-axis are in grid number.
Fig. 7 Spatial distributions of the photoelectrons at t=0.3 ms in zx-plane at y=128 grid around the object of 0.5m*28m*28m. Contours show the number density of the photoelectrons in m-3. The X- and Z-axis are in grid number.
Numerical domain is 256*256*256 in X*Y*Z dimensions.
This document is provided by JAXA.
Ᏹᐂ⯟✵◊✲㛤Ⓨᶵᵓ≉ู㈨ᩱ䚷JAXA–SP–09–006
210
㸲㸬ࡲࡵ
ᮏ◊✲ࢢ࣮ࣝࣉ࡛ࡣᏱᐂᶵࡑࡢ࿘㎶Ꮡᅾࡍࡿ
ࣉࣛࢬ࣐ࡢ┦స⏝ࡢヲ⣽ࢆゎᯒࡍࡿࢶ࣮ࣝࡢࡦ
ࡘࡋ࡚㸪ᆺィ⟬ᶵ࡛ࡢつᶍ୪ิ₇⟬⏝3ḟඖ
⢏Ꮚ㟼㟁ࢥ࣮ࢻࢆ㛤Ⓨࡋ࡚࠸ࡿ㸬㛤Ⓨࡋࡓࢥ࣮
ࢻࢆ⏝ࡋ࡚㸪ḟୡ௦ᝨᫍ㛫⯟⾜ࢩࢫࢸ࣒ࡢࡦࡘ
⪃࠼ࡽࢀ࡚࠸ࡿࢯ࣮࣮ࣛࢭࣝ࿘㎶ࡢࣉࣛࢬ࣐ᣲ
ືࡢᇶ♏ⓗゎᯒࢆ⾜ࡗࡓ㸬ኴ㝧㢼ࣉࣛࢬ࣐ග㟁Ꮚ ࡀᏑᅾࡍࡿ⎔ቃ᮲௳࡛ࡇࡢゎᯒࢆ⾜ࡗࡓ⤖ᯝ㸪௨ୗ
ࡢᵝ࡞⤖ㄽࡀᚓࡽࢀࡓ㸬
㸯㸧ኴ㝧㢼ࣉࣛࢬ࣐ග㟁Ꮚ⎔ቃ࡛ࡣ㸪ࢯ࣮࣮ࣛࢭ
ࣝࡢᾋື㟁ࡣ+4V⛬ᗘ࡞ࡿ㸬㠃ࡀㄏ㟁యࡢሙ
ྜࡢ㞳㟁ࡣᖏᨺ㟁⌧㇟ၥ㢟࡞࠸⛬ᗘ࡛࠶ࡿ
ࡀMUSCATࡼࡿゎᯒࡽᚓࡽࢀ࡚࠸ࡿ㸬
㸰㸧ࢯ࣮࣮ࣛࢭࣝ㠃ഃ࡛ࡣ㸪࢜ࣥwake㉳ᅉ ࡍࡿ㈇ࡢ✵㛫㟁ࡀᙧᡂࡉࢀ㸪ࡇࡢ㡿ᇦࡢග㟁Ꮚ ᣑᩓ⠊ᅖᙳ㡪ࢆཬࡰࡍࡀ☜ㄆฟ᮶ࡓ㸬
㸱㸧ࢯ࣮࣮ࣛࢭࣝࡢࢫࢣ࣮ࣝ㛗ࡣ㸪ࢭࣝ㠃ഃ
ᙧᡂࡉࢀࡿ㈇ࡢ✵㛫㟁ࡢࡁࡉࢆኚࡉࡏ㸪ࡑ ࡢ⤖ᯝࡋ࡚ࢭࣝ㠃୰ᚰ㏆ᣑᩓࡍࡿග㟁Ꮚ
ᩘᐦᗘࢆኚࡉࡏࡿࡀศࡗࡓ㸬ᮏࢩ࣑࣮ࣗࣞࢩ
ࣙࣥࡢ࡛ࡣ㸪ࡁࡉ14.0*14.0*0.5(m)ࡢࢭࣝࡢሙ
ྜ㸪ࡇࡢ㡿ᇦᣑᩓࡍࡿග㟁Ꮚᩘᐦᗘࡣ㸪ࡰ⫼ᬒ 㟁Ꮚᩘᐦᗘ➼ࡋ࠸࣮࢜ࢲ࡛࠶ࡾ㸪ࡇࡢ㸲ಸ㠃✚
28.0*28.0*0.5(m)ࡢሙྜ㸪ྠග㟁Ꮚᩘᐦᗘࡣ㸪⫼ᬒ㟁 Ꮚᩘᐦᗘẚ㍑ࡋ࡚2᱆௨ୖᑡ࡞࠸ࡀศࡗࡓ㸬
ㅰ㎡
MUSCATࡼࡿࢯ࣮࣮ࣛࢭࣝࡢணഛⓗᖏ㟁ゎᯒ
⤖ᯝࡢᥦ౪ᑐࡋ࡚㸪JAXAᏱᐂ⛉Ꮫ◊✲ᮏ㒊ࡢ⣽⏣
⪽ྐẶ㸪ᰴᘧ♫MUSCATࢫ࣮࣌ࢫ࢚ࣥࢪࢽࣜࣥ
ࢢࡢඵ⏣┿ඣẶㅰពࢆ⾲ࡋࡲࡍ㸬
ཧ⪃ᩥ⊩
[1] Birdsall, C. K., and Langdon, A. B, Plasma Physics via Computer Simulation, McGraw-Hill, New York, 1985.
[2] Hosoda, S., Tanaka, K., Toyoda, H., Miyake, H.,
“Fundamental Experiment for Charging Measurement on a Solar Sail Foil,” Space Plasma Workshop 2008, ISAS/JAXA, Sagamihara, March 6, 2009. (in Japanese)
This document is provided by JAXA.