Wild Rice of Madagascar Collected in 1985 and
1988
著者
KATAYAMA Tadao C.
journal or
publication title
南太平洋海域調査研究報告=Occasional papers
volume
18
page range
173-180
URL
http://hdl.handle.net/10232/16690
Kagoshima Univ. Res. Center S. Pac., Occasional Papers, No. 18, 173-180, 1990 173
Wild Rice of Madagascar Collected in 1985 and 1988
Tadao C. Katayama
(Faculty of Agriculture, Kagoshima University, JAPAN)
Introduction
During the periods from August to September in 1985 and from May to June in 1988, the writer had trips in Madagascar for the collection of the wild and cultivated rice species, under the project, "Studies on the Distribution and Ecotypic Differentiation of Wild and Cultivated Rice Species in Africa", supported by a Grant from the Ministry of Education, Science and Culture of the Japanese Government, as the second and as the third tours in Africa. In these opportunities, wild rices distributed in Madagascar were
studied.
On the distribution of wild rice in Madagascar, some reports have already been
published l' 2- 6). Although Madagascar has been considered to be one of the most im
portant distribution areas of wild rice, accumulation of complete data on these aspects is far from being perfect. Taking these facts into account, the present study-series were made to accomplish the distribution and ecotypic differentiation of wild rice in Madagas
car. In the previous paper 3), the preliminary data have been reported in accordance with the second survey result made in 1985. In the following paper 4), the habitat and
grain-characters of wild rice collected in 1988 were reported as the third survey result made in 1988. In the present paper, summarized data on habitat and the record of the morphological characters of unhusked grains of wild rice collected both in 1985 and 1988 were presented.
The author is most grateful to the Government Officials in REPOBLIKA
DEMOK-RATIKA MALAGASY. Thanks are also due to Mon. Zafera Abtoine Rabesa, Mon. Rakotonjanahary Xavier Roland.
Abstract of distribution and habitat of wild Oryza species
The localities concerned in these trips were not surveyed all over the country but re
latively limited in northern part of the Madagascar. Geographical distributions where wild rice was found were briefly illustrated in Fig. 1 of the previous paper 3) in 1985 and
18° ft 50 100 ± 46° Mahajanga 2008
Marovoay^K^^
5 x 2001 • 2002 0 2003 • 4 8°E T 2004 2005 2006 MALAGASY REPUBLIC • 2010 Antananarivo 150 200 km ± 4 8° 2039 2041 2.315 Aff2042 fall312 • 2040 Ambatondrazaka/ Moramanga 50 E 5 0" Fig. 1. Map showing several locality relations where the wild rice in Madagascar were collected in 1985 and 1988, only in overlapped areas in both years. Solid line; route of collection, filled circle [•]; collection site in 1985, triangle mark [A]; collection site in 1988, cross mark; growing area where the samples were observed but not collected, open circle; main town. Code numbers used in fig ure are corresponding to the accession numbers. Italic and roman letters show the strains col lected in 1985 and 1988, respectively. 16US 18 s >Wild Rice of Madagascar 175
also in Fig. 1 of another previous paper 4) in 1988. In these figures, route of the trips
and the growing areas of the wild rice are given. A numeral in these figures shows the
collection numbers used in the respective Tables 1. There stride were three Faritany,
i.e., Antananarivo, Mahajanga and Toamasina.
In 1988, survey was also in areas between Antananarivo and Ambositra and its sub urbs but no wild rice was found.
Surveyed area only overlapped district in 1985 and 1988 is shown in Fig. 1. In this figure, route of trip and growing areas of wild rice are given. Code numbers used in the figure are corresponding to the accession numbers used in the Table 2 of the previous
paper 4) and in Tables 2 and 3 of another pervious paper 5).
Italic and roman letters
show strains collected in 1985 and 1988, respectively.
The figure may be useful for future analyses on ecological differentiation. They
were collected in seasons from August to September and in June in 1985 and 1988, re
spectively, then flowering times of the respective populations are differing from each other even they are growing sympatrically. It maybe expected to find "temporal isola
tion".
In other viewpoint, some one is allopatrically growing and another one is sympatri cally growing with the cultivated species. It maybe expected to find genetic introgression
in some case.
Most of seed samples collected were divided into two groups, one of which was de
posited in FOFIFA, Madagascar, and another one was carried back to Japan and their
plant- and grain-characters are now being analysed at Kagoshima University.
Oryza longistaminata Chev. et Roehr. (60 strains)
Populations of the species were found in several localities, i.e., Mahajanga, Maro voay, Ambondramamy, Mampikony, Port Berge, Anstohihy, Bealanana, Befandrianana, Maevatanana, Antananarivo, Antsapanimahazo, Anororo, Ambatondrazaka, Imeriman droso, Antanifutsy, Alaotra, Tamatave, Fenerive.
Distributions of wild rice collected and only observed were listed up in Tables 1 of
the respective papers 3' 4) . In these tables, collection number, species name, date of col
lection or observation, detailed locality, and some information of habitat were described
in order of date.
In brief, they has a creeping growth in a the pond, swamp, embankment, small pool, irrigation canal, and under the shade. They were sometimes adjacent to the rice field, being separated by an embankment or not.
Some morphological characters of unhusked grains
(Accession Nos.301~313 and Nos.2001-2047)
176 Tadao C. Katayama
and they were used for morphological investigations of unhusked grains. Twenty grains
were used for the measurements of each strain. Measurements were done at length,
width and thickness of the respective grains, centering at the most eminent section of the respective characters. Calculations were done for the ratios of length to width, of length
to thickness, and of width to thickness. The whole data referring to the six characters were illustrated by the average values in the whole grains, which were shown in the re
spective Tables 2 3' 4).
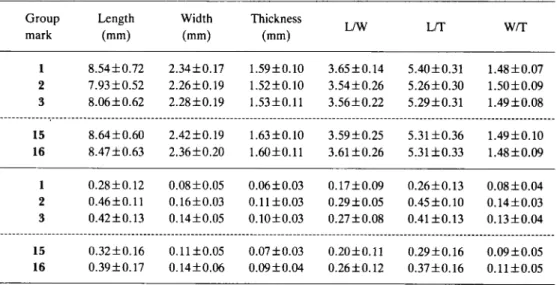
The results are given in Table 1. In this table, 6 morphological characters of the un husked grains were illustrated by average values of the respective 5 groups, i.e., 1;
strains collected in 1985, 2; strains collected in 1988, 3; strains collected in both years,
15; the summed-up data of strains collected in 1984 and 1985 in the 6 countries of Afri ca, 16; the same of 1984, 1985 and 1988, upper column; practical values, lower column;
standard deviations.
Lengths for the individual grain level ranged from 9.95 mm (Collection No.W45 in 1988, Accession No.2045) to 5.80 mm (No.2027) . Both of them were collected in 1988. In the strain level, the longest (9.28 mm) was obtained in No.308, followed by No.305 (9.15 mm) and No.306 (9.14 mm) . The shortest (6.67 mm) was noted in No. 303, fol lowed by No.2009 (6.72 mm) and No.2011 (6.85 mm). Average and its standard devia tions in the whole strains were found to be 8.06 + 0.62 (Table 1).
Table 1. Six morphological characters of unhusked grains collected in Madagascar, illus trated by average values of the respective groups, O. longistaminata, 1; strains collected in 1985 [13 strains], 2; strains collected in 1988 [47 strains], 3; strains collected in both years [60 strains], 15; the summed-up data of strains collected in 1984 and 1985 in the 6 countries of Africa, i.e., Madagascar, Tanzania, Kenya, Nigeria, Ivory Coast and Senegal [107 strains], 16; the same of in 1984, 1985 and 1988 [190 strains], upper column; practical values, lower column;
standard deviations Group mark Length (mm) Width (mm) Thickness (mm) L/W L/T W/T 1 8.54 + 0.72 2.34±0.17 1.59±0.10 3.65±0.14 5.40±0.31 1.48±0.07 2 7.93±0.52 2.26±0.19 1.52±0.10 3.54±0.26 5.26±0.30 1.50 ±0.09 3 8.06±0.62 2.28±0.19 1.53±0.11 3.56±0.22 5.29±0.31 1.49 ±0.08 15 8.64±0.60 2.42±0.19 1.63±0.10 3.59±0.25 5.31 ±0.36 1.49 ±0.10 16 8.47 ±0.63 2.36±0.20 1.60±0.11 3.61 ±0.26 5.31 ±0.33 1.48 ±0.09 1 0.28±0.12 0.08±0.05 0.06 ±0.03 0.17±0.09 0.26±0.13 0.08±0.04 2 0.46±0.11 0.16±0.03 0.11 ±0.03 0.29 ±0.05 0.45±0.10 0.14±0.03 3 0.42±0.13 0.14±0.05 0.10±0.03 0.27 ±0.08 0.41±0.13 0.13 ±0.04 15 0.32±0.16 0.11±0.05 0.07±0.03 0.20±0.11 0.29±0.16 0.09 ±0.05 16 0.39±0.17 0.14±0.06 0.09±0.04 0.26±0.12 0.37±0.16 0.11 ±0.05
Wild Rice of Madagascar 177
In the standard deviations of each strain, i.e., those showing the intra-population's
variations, the largest (0.69) was obtained in Nos.2005 and 2030, followed by No.2027 (0.66). The smallest (0.17) was noted in Nos.308 and 310, followed by No.304 (0.18). Average and its standard deviations in the whole strains were found to be 0.42 + 0.13
(Table 1 of the present paper and Table 11 of the previous paper S)).
Widths for the individual grain level ranged from 3.05 mm (No.2046) to 1.70 mm (Nos.2001 and 2027), in which the last one was the same as in case of the length. In the
strain level, the widest (2.69 mm) was obtained in No.2023, followed by No.2022 (2.67 mm), and Nos.2045 and 2046 (2.66 mm). The narrowest (1.98 mm) was noted in No.2002, followed by No.2005 (1.99 mm) and Nos.2001 and 2027 (2.00 mm). Average and its standard deviations in the whole strains were found to be 2.28 + 0.19.
In the standard deviations of each strain, the largest (0.25) was obtained in
No.2020, followed by No.2045 (0.23) and No.2017 (0.22). The smallest (0.02) was noted
in Nos.301 and 313, followed by No.304 (0.03), which was the same as in case of the
length. Average and its standard deviations in the whole strains were found to be 0.14+
0.05 .
Thicknesses for the individual grain level ranged from 2.10 mm (No.2045), which
was the same as in case of the length, to 1.05 mm (No.2025). In the strain level, the
thickest (1.85 mm) was obtained in No.307, followed by No.2045 (1.83 mm) and No.2046 (1.82 mm), both of which were the same as in case of the width. The thinnest (1.36 mm) was noted in No.2026, followed by No.2027 (1.37 mm), which was the same as in case of the width, and No.2024 (1.40 mm). Average and its standard deviations in
the whole strains were found to be 1.53 + 0.11.
In the standard deviations of each strain, the largest (0.18) was obtained in No.
2043, followed by No.2007 (0.17) and No.2021 (0.16). The smallest (0.02) was obtained
in No.301, which was the same as case of the width, and No.311, followed by No.304
(0.03), which was also the same as in cases of the length and width. Average and its
standard deviations in the whole strains were found to be 0.10 + 0.03.
Ratios of length to width (abbreviated as L/W in the table) for the individual grain level ranged from 4.86 (No.2003) to 2.59 (No.2019). In the strain level, the largest (4.02) was obtained in No.2001, followed by Nos.2002 and 2003 (3.99). The smallest (3.09) was noted in No.2046, followed by No.2019 (3.16) and No.2018 (3.22). Average and its stand
ard deviations in the whole strains were found to be 3.56 + 0.22.
In the standard deviations of each strain, the largrst (0.43) was obtained in No.2001,
followed by No.2002 (0.42), and Nos.2029 and 2032 (0.37). The smallest (0.06) was noted in No.313, which was the same as in case of the width, followed by No.301 (0.07) and No.306 (0.09). Average and its standard deviations in the whole strains were found
to be 0.27 + 0.08.
Ratios of length to thickness (abbreviated as L/T in the table) for the individual grain level ranged from 7.54 (No.2022) to 3.87 (No.2021). In the strain level, the largest
178 Tadao C. Katayama
(5.80) was obtained in No.305, followed by No.2015 (5.77), and Nos.2023 and 2029
(5.71). The smallest (4.69) was noted in No.2019, followed by No.2009, which was the
same as in case of the length, and No.2045 (4.70). Average and its standard deviations in the whole strains were found to be 5.29±0.31.
In the standard deviations of each strain, the largest (0.71) was obtained in No.2021, followed by No.2022 (0.66) and No.2030 (0.63). The smallest (0.08) was noted in No.301, which was the same as in cases of the width and thickness, followed by No.310 (0.10), which was the same as in case of the length, and No.328 (0.11). Average
and its standard deviations in the whole strains were found to be 0.41 ±0.13.
Ratios of the width to thickness (abbreviated as W/T in the table) for the grain level ranged from 2.21 (No.2022), which was the same as in case of the ratio of length to
thickness (L/T), to 1.05 (No.2021), which was also the same as in case of the ratio of
length to thickness (L/T). In the strain level, the largest (1.74) was obtained in No.2023, which was the same as in case of the width, followed by No.2022 (1.72), which was also the same as in case of the width, and No.2021 (1.69). The smallest (1.33) was noted in No.2001, followed by Nos.307, 2002 and 2003 (1.36). Average and its standard devia
tions in the whole strains were found to be 1.49 ±0.08.
In the standard deviations of each strain, the largest (0.52) was obtained in No.2034, which was noticeable to be particularly large value, followed by Nos.2021 and
2022 (0.22). The smallest (0.02) was noted in No.301, which was the same as in cases of
the width, thickness and ratio of length to thickness (L/T), followed by No.313 (0.03) and No.304 (0.04), which was the same as in cases of the length, width and thickness.
Average and its standard deviations in the whole strains were found to be 0.13±0.04.
Group comparison in view of the practical values
(Upper colum of Table 1)They have different meanings in view of physiological, meteorological and phy-logenetical characters, and should be separately considered also in morphological
studies.
Grain level The largest and the smallest values in view of the grain level were
found in the strains collected in 1988 for the whole 6 characters.
Strain level The 3 largest values in length, thickness and L/T were found in the
strains collected in 1985, and the other 3 values in 1988. Only 1 smallest value in length
was found in the strain collected in 1985. The remaining 5 characters showed the largest values in the strains collected in 1988.In comparison of group averages with 1 (1985) and 2 (1988), the five characters, ex cept W/T, showed the larger values in strain average of strains collected in 1985 (1) than those of 1988 (2). The tendency was fixed to be the reversed results obtained in grain level. Group averages of 15 (1984 and 1985 of the whole African countries) showed
lar-Wild Rice of Madagascar 179
ger values than those of 2 and 3, but than those of only length, width, thickness and
W/T of 1.
Group averages of 16 (1984, 1985 and 1988 of the whole African countries) showed larger values than those of 2 and 3, except W/T, but than those of only width and thick
ness of 1.
Group comparison in view of the standard deviations
(Lower column of Table 1)
In the standard deviations, the whole characters showed the largest values in the strains collected in 1988. On the contrary, the whole characters showed the smallest
values in the strains collected in 1985.
In the group averages, the whole data concerning 6 characters showed the largest in 2, followed by 3. The data of 1 showed the smallest ones. It was interesting phe
nomena that the standard deviations obtained in strains collected in 1988 showed re
latively large values in whole characters.
In comparison with data of 15 and 16, the following facts were found. The data of 1 showed the smaller ones than those of 15 and 16. On the contrary, the whole data of 2 and 3 showed the larger ones than those of 15 and 16, except width of 3.
Summary
During the periods from August to September in 1985 and from May to June in
1988, the writer had trips in Madagascar for collection of the wild and cultivated rice
species. During the trips, 60 strains of wild rice, Oryza longistaminata Chev. et Roehr., were collected, and many populations of them were observed. Their localities
and habitats were reported briefly.
From the analyses of grain characters of the unhusked grains, average values and
the standard deviations in the whole strains were found to be 8.06 mm ±0.62, 2.28 mm
+ 0.19, 1.53 mm ±0.11, 3.56 + 0.22, 5.29±0.31 and 1.49±0.08 in length, width, thick ness, ratios of length to width, of length to thickness, and of width to thickness, respec tively. Most of the data showed the larger values in strains collected in 1985 than those
of strains collected in 1988.
In the standard deviations of each strain, i.e., those showing intra-population's
variations, average values and the standard deviations in the whole strains were found to
be 0.42 ±0.13, 0.14 ±0.05, 0.10 ±0.03, 0.27 ± 0.08, 0.41 ±0.13 and 0.13 ±0.04 in the
same order, respectively. It was noticeable that the whole characters showed the larger
values in 1988 than those of 1985 and of the whole of African countries.
180 Tadao C. Katayama
ecological characters, geographical, ecotypic and varietal differentiations could be discus sed and concluded in the future.
References
1) BlED-CHARRETON, M. et al.: Notice explicative des cartes des conditions geographi-ques de la mise en valeur Agricole de Madagascar. I. Potentiel des unites physigeographi-ques.
ORSTOM-Paris, Antananarivo, pp. 187 (1981)
2) Hamon, S.: Bilan des prospections: Cafe, gombo, mil, panicum, riz. TORSTOM et sa Contribution a l'Etude des Ressources Genetiques en Afrique. pp. 13 (1984). 3) Katayama, T. C, R. Xavier Roland, A. Nakagama and A. Sumi: Distribution
and some morphological characters of wild rice in Madagascar. Kagoshima Univ.
Res. Center S. Pac, Occasional Papers, 10: 24-29 (1987).
4) Katayama, T. C, R. Xavier Roland and H. Satoh: Distribution and grain mor phology of wild rice collected in Madagascar, 1988. Kagoshima Univ. Res. Center S.
Pac, Occasional Papers, 18: 18-37 (1990).
5) Katayama, T. C: Consideration on distribution and grain morphology of wild rice in African countries. Kagoshima Univ. Res. Center S. Pac, Occasional Papers, 18:
127-172 (1990).
6) KOCHKO, A. de: Rapport de mission: Prospection des riz traditionnelles et sauvages dans quelques regions des hautes terres de Madagascar. ORSTOM, pp. 15 (1984).