Food nitrogen footprint reductions related to
a balanced Japanese diet
著者
Azusa Oita, Ichiro Nagano, Hiroyuki Matsuda
journal or
publication title
Ambio : a journal of the human environment,
research and management
volume
47
number
3
page range
318-326
year
2017-09-14
URL
http://hdl.handle.net/10097/00125393
doi: 10.1007/s13280-017-0944-41
Title Page
1
Title: Food nitrogen footprint reductions related to a balanced Japanese diet
2 3
Author names and affiliations:
4
Azusa Oita, a, Ichiro Naganob, Hiroyuki Matsudaa
5
a Graduate School of Environment and Information Sciences, Yokohama National University, 79-7
6
Tokiwadai, Hodogaya, Yokohama 240-8501, Japan. 7
b Central Research Laboratory, Tokyo Innovation Center, Nippon Suisan Kaisha, Ltd., 1-32-3
8
Nanakuni, Hachioji, Tokyo 192-0991, Japan. 9
10
Corresponding author: Azusa Oita (Email: [email protected], Phone: +81 45 339 4362)
11 12
Acknowledgements
13
This work was supported in part by the Environment Research and Technology Development Fund 14
(S-14), Ministry of the Environment, Japan. 15
16 17
Accepted by Ambio : A Journal of the Human Environment on September 5, 2017. 18
The final publication is available at https://doi.org/10.1007/s13280-017-0944-4 19
2
Abstract
20
Dietary choices largely affect human-induced reactive nitrogen accumulation in the environment and 21
resultant environmental problems. A nitrogen footprint (NF) is an indicator of how an individual’s 22
consumption patterns impact nitrogen pollution. Here, we examined the impact of changes in the 23
Japanese diet from 1961 to 2011 and the effect of alternative diets (the recommended protein diet, a 24
pescetarian diet, a low-NF food diet, and a balanced Japanese diet) on the food NF. The annual per-25
capita Japanese food NF has increased by 55% as a result of dietary changes since 1961. The 1975 26
Japanese diet, a balanced omnivorous diet that reportedly delays senescence, with a protein content 27
similar to the current level, reduced the current food NF (15.2 kg-N) to 12.6 kg-N, which is 28
comparable to the level in the recommended protein diet (12.3 kg-N). These findings will help 29
consumers make dietary choices to reduce their impacts on nitrogen pollution. 30
31
Keywords: dietary choice; food consumption; healthy traditional diet; nitrogen footprint; sustainable
32
diet; washoku 33
34 35
3
1. Introduction
36
Humans are responsible for more than half of global nitrogen (N) fixation, mainly through fertilizer 37
production and agricultural biological N fixation (Fowler et al., 2013). However, the majority of 38
intentionally fixed N to produce food and feed is lost to the environment as reactive N (Nr; all 39
species of N except N2), with only 17% consumed by humans in food (UNEP & WHRC, 2007). The
40
global population growth with stable per-capita Nr loss is, in turn, causing continuous Nr 41
accumulation in the environment (Galloway et al., 2014). Nr accumulation above the planetary 42
boundary (Steffen et al., 2015) contributes to various environmental problems (Sutton et al., 2011; 43
Erisman et al., 2013). 44
The N footprint (NF) is an indicator of the impact of human activities in terms of the total 45
amount of Nr released to the environment as a result of resource consumption (Leach et al., 2012). 46
Stevens et al. (2014) reported that food has a larger impact than energy in terms of the NF, and 47
suggested that, of all scenarios tested, a reduction in protein intake to that recommended by the 48
World Health Organization (WHO) and United States Department of Agriculture could significantly 49
reduce the UK NF. Taking fish and seafood as an example (in this study, the term “fish and seafood” 50
is used collectively to include inland and marine, finfish, mollusks, crustaceans, and derived 51
products), Oita et al. (2016b) suggested actions to reduce NF by eating food items in lower NF 52
subcategories, while reducing animal protein intake. Alternative diets suggested to date have been 53
limited to reducing protein intake or giving up meat and other categories with a high NF (e.g. 54
Galloway et al., 2014; Stevens et al., 2014; Westhoek et al., 2015; Shibata et al., 2017). 55
Diets tightly link human health to environmental problems (Tilman and Clark, 2014; 56
Nesheim et al., 2015), including N pollution. The traditional Japanese diet, washoku, which was 57
added to UNESCO’s Intangible Cultural Heritage list in 2013, is characterized by high consumption 58
of soybean products, fish, seaweed, vegetables, fruit, and green tea (Shimazu et al., 2007). Although 59
washoku includes its cultural aspects notably seen in annual events, it also refers to typical daily
60
meals, which are commonly characterized by the ichiju-sansai style (consisting of a soup, rice, and 61
three side dishes, or more broadly defined as “food using fresh fish and vegetables, cooked to use the 62
4
potential of its ingredients and containers, and deeply related to seasonality and annual rituals”; 63
Kohsaka, 2017). Studies have shown that this traditional daily diet provides health benefits, such as 64
reduced risk of cardiovascular disease and diabetes (Shimazu et al., 2007; Guo et al., 2012), while 65
increasing life expectancy (Yamamoto et al., 2016). In 1960, the typical Japanese diet was largely in 66
accordance with traditional dietary patterns (Lands et al., 1990); however, significant changes have 67
occurred over the past 50 years (see Table 1 in Yamamoto et al., 2016). The traditional Japanese diet 68
currently has a share of roughly 60% of meals served at Japanese home (Kohsaka, 2017). The 1975 69
diet, which incorporated Japanese Western cuisine (yoshoku, in which Western ingredients, such as 70
pork and beef, are cooked using Japanese techniques) with traditional Japanese cuisine, has been 71
reported as a balanced diet that delays senescence more effectively than the 1960 diet and the current 72
Japanese diet (Yamamoto et al., 2016). However, it remains unclear how changes in food 73
consumption patterns could reduce food NF without cutting out certain food categories, while 74
improving health and overall enjoyment of food. 75
In this study, we assessed the impact of dietary changes on the food NF in Japan in terms 76
of both the environment and health. We determined the changes in per-capita protein intake in Japan 77
and calculated the resulting changes in food NF with corresponding changes in food consumption 78
patterns. We then performed analyses of four alternative dietary scenarios (1) the recommended 79
protein diet, (2) pescetarian diet, (3) low-NF food diet, and (4) balanced Japanese diet. 80
81
2. Materials and methods
82
The per-capita “food NF” is defined as the total amount of Nr released to the environment as a result 83
of an average individual’s food consumption, excluding fuel-combustion-related Nr (Leach et al., 84
2012). Food NF can be divided into two parts: food production and food consumption. Food 85
production NF is determined by food N intake multiplied by virtual N factors (VNFs; the amount of 86
Nr released to the environment during production per unit of N intake), while food consumption NF 87
5
represents N intake minus denitrification N removal in sewage treatment. Nr in food waste after the 88
final purchase by consumers is incorporated to VNFs so that accounted for in food production NF. 89
We determined food NFs for Japan using food protein supply data from the Food and 90
Agriculture Organization of the United Nations (FAO) for 1961–2011 (FAO, 2015), VNFs, average 91
food waste rates and fed-aquacultured rates for Japan (Table 1; Shibata et al., 2014; Oita et al., 2016b; 92
see detailed food categories corresponding to FAO categories in Table 2), and an average rate of 93
denitrification in sewage treatment of 32% (Oda and Matsumoto, 2006). In this study, the term “meat” 94
includes edible offal as per the FAO categories. A common bottom-up approach, called the N-95
Calculator method (Leach et al., 2012), was employed using N intake as a starting point as determined 96
by Eq. 1: 97
Nint_i = Psupplied_i × (1 - Rwasted_i) × 0.16, (1)
98
where Nint_i is N intake represented by the protein content of food item i, Psupplied_i is supplied food
99
protein (g capita-1 year-1), and R
wasted_i is the average food waste rate for food item i. We then calculated
100
food production NFs using Eq. 2 and food consumption NFs using Eq. 3: 101
NFprod_i = Nint_i × VNFi, (2)
102
NFcons_i = Nint_i × (1 - Rdinit),
103
(3) 104
where NFprod_i is the food production NF of food item i, VNFi is the VNF of food item i, and Rdinit is
105
the average rate of denitrification during sewage treatment (32%). 106
Japanese NFs in the case of four alternative dietary scenarios were compared to that of the 107
current average Japanese diet (the 2011 diet). 108
(1) Recommended protein diet: protein intake reduced to the level recommended by the 109
Ministry of Health, Labour and Welfare, Japan (JMHLW) (53 g cap-1 day-1 for an average adult), with
110
the current dietary composition (Kido et al., 2012). 111
6
Table 1 Virtual nitrogen factors (VNFs), food waste rates, and fed-aquacultured rates for Japan.
112
Food category VNFa Food waste rateb (%) Fed-aquaculture ratec (%)
Cereals 1.5 10 –
Legumes 1.3 9 –
Vegetables 5.5 20 –
Starchy roots 4.9 20 –
Tree nuts and other oil crops 1.3 9 –
Plant products not included
elsewhered 5.5 20 –
Fish and seafood – 16 –
Freshwater fish – – 58 Fed aquacultured 4.3 – – Captured and non-fed aquacultured 0.2 – – Marine fishe – – 5–6 Fed aquacultured 3.4 – – Captured and non-fed aquacultured 0.2 – – Crustaceans – – 50 Fed aquacultured 7.6 – – Captured and non-fed aquacultured 0.2 – – Molluscsf 0.2 – 0
Dairy products and milk 2.7 3 –
Eggsg 6.7 39 –
Poultry meat 6.0 31 –
Pig meat 6.7 39 –
Bovine meat 12.4 39 –
Other meat including offalh 8.4 36 –
a VNFs for categories other than fish and seafood represent VNFs for “Japan with trade” in Shibata et al. (2014), while
113
VNFs for fish and seafood represent VNFs for parameter set J in Oita et al. (2016b).
114
b Shibata et al. (2014), except fish and seafood. Values reported by Leach et al. (2012) for fish and seafood were used
115
by Shibata et al. (2014).
116
c Parameter set J in Oita et al. (2016b).
117
d Applied values for vegetables.
118
e Marine fish includes FAO categories of demersal fish, pelagic fish, and “marine fish, other”.
119
f Molluscs includes FAO categories of cephalopods and “molluscs, other”, both of which are considered not to be fed
120
aquacultured.
121
g Applied values for pig meat.
122
h Calculated average of poultry meat, pig meat, and bovine meat.
123 124
7
Table 2 Food categories and included FAO categories.
125
Food category FAO category in the Food Balance Sheeta
Cereals "Cereals - Excluding Beer," Alcoholic Beverages
Legumes Pulses, Soybeans
Vegetables Vegetables
Starchy roots Starchy Roots
Tree nuts and other oil
crops Tree nuts, Oil crops (excluding soybeans)
Plant products not
included elsewhere Sugar & Sweeteners, Vegetable Oils, "Fruits - Excluding Wine," Stimulants, Spices
Freshwater fish Freshwater fish
Marine fish Demersal fish, Pelagic fish, “Marine Fish, Other”
Crustaceans Crustaceans
Molluscs Cephalopods, “Molluscs, Other”
Dairy products "Milk - Excluding Butter," Animal fats
Eggs Eggs
Poultry meat Poultry meat
Pig meat Pig meat
Bovine meat Bovine meat
Other meats, including
offal Mutton & Goat Meat, "Meat, Other," “Offals, Edible” a FAO (2015)
126 127
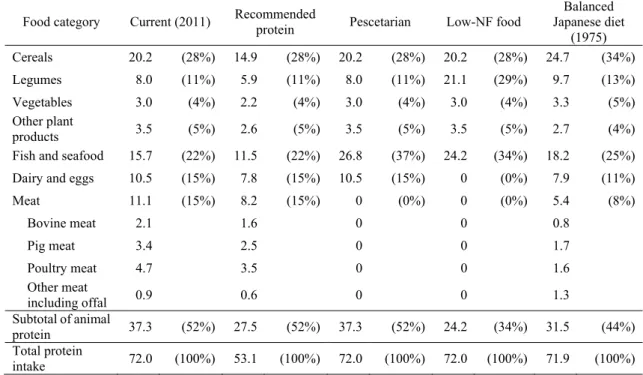
(2) Pescetarian diet: meat protein intake substituted for fish and seafood protein. Total protein 128
intake equivalent to the current level. 129
(3) Low-NF food diet: protein intake of meat, dairy, egg, and fed-aquacultured fish and seafood 130
substituted by legume protein and captured/non-fed-aquacultured fish and seafood protein. Total 131
protein intake equivalent to the current level. 132
(4) Balanced Japanese diet: protein intake equivalent to the 1975 level, with the dietary 133
composition at that time. Corresponds to a traditional Japanese-based diet incorporating Japanese 134 Western cuisine. 135 136 3. Results 137 3.1 Protein intake 138
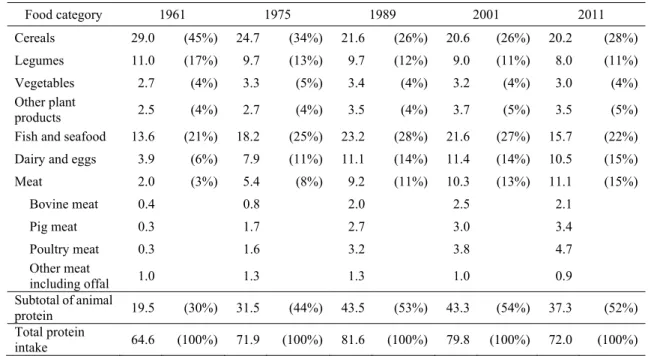
Between 1961 and 2011, the per-capita protein intake in Japan showed three trends: a steady increase 139
from 1961 (64.6 g day-1) to 1989 (81.6 g day-1) followed by a slight decrease from 1989 to 2001 (79.8
140
g day-1) and a moderate decrease from 2001 to 2011 (72.0 g day-1; Figure 1). The first period (1961–
8
1989) represents a period of growth in food consumption, particularly meat (+ 360%), dairy and eggs 142
(+ 183%), and fish and seafood (+ 71%), with the exception of a reduction in cereals (- 25%) and 143
legumes (- 11%). In the second period (1989–2001), meat consumption continued to rise by 12%, 144
while fish and seafood consumption started to decrease by 7%. Consumption of dairy and eggs levelled 145
off, while that of cereals and legumes continued to decline. During the third period (2001–2011), 146
although meat consumption continued to increase by 8%, fish and seafood consumption further 147
decreased by 27%, and all other categories decreased slightly. 148
The relative proportion of each category in terms of total protein intake changed drastically 149
across the 50-year period (Figure 1 and Table 3). In 1961, cereals and legumes represented more than 150
60% of the total protein intake, while fish and seafood were the main source of animal protein. In 151
contrast, by 1975, the percentage of cereals and legumes dropped to about 50% of the total protein 152
intake, while dairy, eggs, and meat increased to 42% of the animal protein intake, complemented by 153
the consumption of fish and seafood. In 1989 and 2001, cereals and legumes represented only about 154
40% of the total protein intake, while meat, dairy and eggs increased to about 25% of the total, 155
increasing the share of animal protein to more than 50% of the total. In 2011, while contributions of 156
vegetable products remained stable, those of meat, dairy, and eggs increased to nearly 60% of the 157
animal protein intake. 158
159
Figure 1 Protein intake (g cap-1 day-1) in Japan according to major food groups between 1961 160
and 2011 (FAO, 2015).
9
Table 3 Changes in the composition of protein intake in Japan between 1961 and 2011 (g cap-1 162 day-1). 163 Food category 1961 1975 1989 2001 2011 Cereals 29.0 (45%) 24.7 (34%) 21.6 (26%) 20.6 (26%) 20.2 (28%) Legumes 11.0 (17%) 9.7 (13%) 9.7 (12%) 9.0 (11%) 8.0 (11%) Vegetables 2.7 (4%) 3.3 (5%) 3.4 (4%) 3.2 (4%) 3.0 (4%) Other plant products 2.5 (4%) 2.7 (4%) 3.5 (4%) 3.7 (5%) 3.5 (5%)
Fish and seafood 13.6 (21%) 18.2 (25%) 23.2 (28%) 21.6 (27%) 15.7 (22%)
Dairy and eggs 3.9 (6%) 7.9 (11%) 11.1 (14%) 11.4 (14%) 10.5 (15%)
Meat 2.0 (3%) 5.4 (8%) 9.2 (11%) 10.3 (13%) 11.1 (15%) Bovine meat 0.4 0.8 2.0 2.5 2.1 Pig meat 0.3 1.7 2.7 3.0 3.4 Poultry meat 0.3 1.6 3.2 3.8 4.7 Other meat including offal 1.0 1.3 1.3 1.0 0.9 Subtotal of animal protein 19.5 (30%) 31.5 (44%) 43.5 (53%) 43.3 (54%) 37.3 (52%) Total protein intake 64.6 (100%) 71.9 (100%) 81.6 (100%) 79.8 (100%) 72.0 (100%)
Note: Values for each meat item were rounded up to obtain the total meat. 164
165
3.2 Per-capita food nitrogen footprints
166
In 2011, the per-capita food NF in Japan was calculated as 15.2 kg-N yr-1 using VNFs for Japan (Figure
167
2, Table S1), as the sum of food production NF (12.3 kg-N yr-1) and food consumption NF (2.9 kg-N
168
yr-1). Meat represented 35% of the total food NF, followed by dairy and eggs (19%), cereals (17%),
169
and fish and seafood (9%). Calculated using constant VNFs for Japan, the per-capita food NF 170
increased from 1961 (9.8 kg-N yr-1) to 1989 (15.7 kg-N yr-1) with the increase in protein intake, and
171
continued to increase with the continuous rise in meat consumption, reaching a peak in 1995 (16.4 kg-172
N yr-1). The NF then levelled off until 2000, after which there was a slight decrease to the current level.
173
Thus, although protein intake and resultant food N intake in 2011 was only 11% greater than that of 174
the 1961 diet, the total food NF increased by 55%. 175
10 177
Figure 2 Impact of dietary changes between 1961 and 2011 on the food nitrogen footprint in
178
Japan, calculated using constant virtual nitrogen factors (VNFs in Table 1) (kg-N cap-1 yr-1). 179
180
3.3 Scenario Analysis
181
How changes in food choices affect the food NF was subsequently determined using four dietary 182
scenarios (Figure 3, Table 4). The amount of Nr released to the environment can be reduced by 183
lowering our protein intake and consuming food with a lower VNF. On a per-capita basis, lowering 184
food protein intake to the JMHLW recommended level in line with the current dietary pattern 185
decreased the food NF to 12.3 kg-N yr-1, while maintaining an equivalent level of protein intake with
186
a pescetarian diet (a diet without meat) reduced the food NF to 10.8 kg-N yr-1. Consuming only
low-187
NF food, while maintaining an equivalent level of protein intake was the most effective choice of all 188
scenarios tested, reducing the per-capita food NF to 8.3 kg-N yr-1. The 1975 balanced Japanese diet,
189
with an almost equivalent amount of protein, also reduced the food NF to 12.6 kg-N yr-1.
190 191
11 192
Figure 3 Food nitrogen footprints and total protein intake under four dietary scenarios
193
according to each food category. Current condition: Japanese food consumption patterns in 2011;
194
Scenario 1: protein intake reduced to the level recommended by the Ministry of Health, Labour and 195
Welfare, Japan (Kido et al., 2012); Scenario 2: meat protein intake replaced by fish and seafood; 196
Scenario 3: protein intake from meat, dairy, eggs, fed-aquacultured fish and seafood replaced by 197
legumes, fish and seafood (non-fed-aquacultured or captured); Scenario 4: a balanced Japanese diet as 198
in 1975 (traditional Japanese-based diet incorporating Japanese Western cuisine). The percentages 199
shown above each plot indicate the degree of nitrogen footprint reduction compared to the current 200
condition. 201
202 203
12
Table 4 Comparison of the composition of protein intake for alternative diets (g cap-1 day-1). 204
Food category Current (2011) Recommended protein Pescetarian Low-NF food
Balanced Japanese diet (1975) Cereals 20.2 (28%) 14.9 (28%) 20.2 (28%) 20.2 (28%) 24.7 (34%) Legumes 8.0 (11%) 5.9 (11%) 8.0 (11%) 21.1 (29%) 9.7 (13%) Vegetables 3.0 (4%) 2.2 (4%) 3.0 (4%) 3.0 (4%) 3.3 (5%) Other plant products 3.5 (5%) 2.6 (5%) 3.5 (5%) 3.5 (5%) 2.7 (4%)
Fish and seafood 15.7 (22%) 11.5 (22%) 26.8 (37%) 24.2 (34%) 18.2 (25%)
Dairy and eggs 10.5 (15%) 7.8 (15%) 10.5 (15%) 0 (0%) 7.9 (11%)
Meat 11.1 (15%) 8.2 (15%) 0 (0%) 0 (0%) 5.4 (8%) Bovine meat 2.1 1.6 0 0 0.8 Pig meat 3.4 2.5 0 0 1.7 Poultry meat 4.7 3.5 0 0 1.6 Other meat including offal 0.9 0.6 0 0 1.3 Subtotal of animal protein 37.3 (52%) 27.5 (52%) 37.3 (52%) 24.2 (34%) 31.5 (44%) Total protein intake 72.0 (100%) 53.1 (100%) 72.0 (100%) 72.0 (100%) 71.9 (100%)
Note: Values for each meat item were rounded up to obtain the total meat. 205
206
4. Discussion
207
4.1 Dietary changes and food nitrogen footprints over the past 50 years
208
Overall, the per-capita food NF in Japan has largely increased in the past five decades due to the 209
growth in food consumption, especially animal protein, followed by a shift to a more meat-based diet. 210
Our findings are in line with those of Shibata et al. (2014) who revealed that younger generations 211
prefer diets with more meat and less vegetables. Similar trends in the environmental impact associated 212
with increasing meat consumption have also been seen in other developed and developing countries 213
(Alexandratos, 2006; Kearney, 2010). Increased consumption, especially of animal protein, is 214
supported via imported food and feed, thereby increasing N levels in water bodies and air in food- and 215
feed-exporting countries (Burke et al., 2009; Oita et al., 2016a) and in importing countries (Shindo et 216
al., 2009; Lassaletta et al., 2014b). As Lassaletta et al. (2014a) suggested, the global disconnection 217
between crop and livestock farming has further increased N pollution in both feed-exporting countries 218
(e.g., Brazil) and feed-importing countries (e.g., China). In addition, given the increasing trend in 219
fertilizer use (Nishina et al., 2017) and consumption of plant-protein-fed fish and seafood (Hardy, 220
13
2010), it is suggested that VNFs of crops, meat, fish, and seafood have all increased and will continue 221
to do so in the future. As in previous studies on NF, our calculations do not include the protein supply 222
of whale meat, which peaked in the 1960s (a per-capita daily supply of 1.0 g in 1960, 0.6 g in 1975, 223
and 0 g in 1989; Ministry of Agriculture, Forestry and Fisheries of Japan, 1970, 1977, 1991), or game 224
meat. Since the per-capita NF of whale meat was calculated as 0.04 kg N yr-1 in 1960 using similar
225
assumptions to those for wild-caught fish, the effect of whale meat and game meat is thought to be 226
marginal. Although the food NF in Japan has experienced a slight decline in the past decade when 227
calculated using constant VNFs, further reductions are required to shift to a sustainable diet within the 228
planetary boundary (de Vries et al., 2013; Steffen et al., 2015), thereby keeping surface water below 229
the threshold level for eutrophication or acidification of aquatic ecosystems. 230
Our estimate of per-capita Japanese food NF of 15.2 kg-N yr-1 in 2011 is similar to the
231
estimate of 16.5–18.1 kg-N yr-1 obtained by a top-down approach (Shindo and Yanagawa, 2017) that
232
includes 1.3 kg-N yr-1 Nr denitrified in sewage treatment. These two estimates for 2011 are much less
233
than 25.6 kg-N yr-1 in 2009 reported by Shibata et al. (2014). We applied the VNFs reported by Shibata
234
et al. (2014), except for fish and seafood (taken from Oita et al., 2016b); accordingly, Shibata et al. 235
(2014) may have overestimated the N intake in their calculation from the food protein supply in the 236
FAO food balance sheet. In addition, the smaller VNFs for fish and seafood (Table 1; weighted average 237
of 0.8) used in this study (Oita et al., 2016b; calculated for Japan accounting for trade) compared to 238
the VNF of 2.9 in Shibata et al. (2014), calculated from the US values reported by Leach et al. (2012), 239
partially explain the difference (Tables S1–S2). 240
241
4.2 Alternative diets
242
Dietary scenario analysis demonstrated that changes in food consumption patterns could result in 243
further reductions compared to lowering protein intake to the JMHLW recommended level (53 g cap
-244
1 day-1). Most Japanese consume less than the upper limit of protein intake (118 g day-1; Kido et al.,
245
2012), while some have insufficient protein intake (Mean ± SD, 69.8 ± 23.2 g day-1; JMHLW, 2013).
246
In addition, studies suggest that elderly people require more than the recommended levels of protein 247
14
(Kobayashi et al., 2013; Levine et al., 2014). Therefore, changes in dietary patterns seem more 248
favorable for many Japanese in terms of decreasing their food NF. 249
Comparing the pescetarian diet with the low-NF food diet, a shift to a plant and seafood-250
based diet was 1.5 times more effective in reducing the food NF in Japan. From a dietary and supply 251
perspective, the pescetarian diet scenario consumes 1.7 times more seafood than the current level, 252
while the low-NF food diet scenario consumes 1.5 times more. This represents 16% (pescetarian) and 253
5% (low-NF food) more than that of the 1989 diet. Understanding consumption at the country level 254
would also be practical in terms of supply, if wild catch were to be recovered to that of the 1980s 255
through appropriate and effective fisheries management (Ministry of Agriculture, Forestry and 256
Fisheries, Japan, 2015a). That is, to put the pescetarian and low-NF diets into practice, only fish and 257
seafood captured within biologically sustainable levels should be consumed. In the low-NF food diet 258
scenario, legume consumption is 2.6 times greater than the current level and 92% more than the 1961 259
diet. Nevertheless, Japan has the potential to produce 2.4 times more soybeans than present levels 260
(Ministry of Agriculture, Forestry and Fisheries of Japan, 2015b). This level of legume consumption 261
is roughly the same as that of Niger in 2011 (FAO, 2015). Both scenarios represent an affordable diet, 262
assuming consumption increases are mainly the result of wild-caught small pelagic fish and legumes. 263
Considering the above three scenarios, the pescetarian diet is the most feasible option in Japan, while 264
the low-NF diet has potential. In practice, both diets could be adopted once a week as a starting point, 265
e.g., as a day without meat or a day without meat, dairy, eggs, or fed-aquacultured fish and seafood. 266
The food NF decreases in proportion to the number of days an alternative diet is followed. 267
From a human health perspective, the balanced Japanese diet is more attractive than the 268
other scenarios, since it delays senescence effectively (Yamamoto et al., 2016). This diet requires 269
reduced consumption of meat, dairy and eggs, and an increase in rice and soybeans compared to the 270
current diet. This was the typical diet of most Japanese in the 1970s, not requiring consumers, mostly 271
omnivorous, to cut out any food categories. In addition, its loose restriction on ingredients leaves room 272
for consumers to enjoy any kind of cuisine. The balanced Japanese diet therefore seems more feasible 273
15
than other diet scenarios, such as the pescetarian and low-NF diets, especially in countries where 274
Japanese cuisine or other similar plant-based food compositions have already gained popularity. 275
276
4.3 Towards a sustainable and healthy diet
277
We make food choices not only in terms of how environmentally friendly or healthy they are, but also 278
based on culture, nutritional knowledge, price, availability, taste, and convenience (Tilman and Clark, 279
2014). The biggest obstacle to maintaining a balanced Japanese diet is time constraints (Melby and 280
Takeda, 2014). To make it more practical for the consumer, the introduction of simple recipes and 281
simple cooking methods could therefore be implemented, while at a more fundamental level, policies 282
aimed at society are perhaps required. Overall, by combining the balanced Japanese diet with one day 283
a week without meat, dairy, eggs, or fed-aquacultured fish and seafood could reduce our NF by more 284
than 20%, or 386 Gg N year-1, when scaled up to the Japan population.
285
Similar shifts away from a traditional diet based mainly on locally-grown cereals, pulses, 286
fish and seafood, and olive oil to a more meat-based diet have also been seen in Mediterranean 287
countries (e.g., Garcia-Closas et al., 2006) and are associated with greater environmental impacts 288
(Sáez-Almendros et al., 2013). Lassaletta et al. (2014b) have reported that per-capita protein 289
consumption in Spain had increased from 4.6 kg-N yr-1 (78.8 g-protein day-1 with 37% animal protein)
290
in 1961–1965 to 6.4 kg-N yr-1 (109.6 g-protein day-1 with 64% animal protein) in 2005–2009.
291
Compared to the balanced Japanese diet with 4.2 kg-N yr-1 (71.9 g-protein day-1), the 1960s’
292
Mediterranean diet has a similar animal protein ratio of roughly 40%, whereas they consume higher 293
protein amount. These diets with relatively low animal protein ratios in line with the estimated highest 294
sustainable protein consumption of per-capita protein consumption of 4–5 kg-N yr-1 with 40% animal
295
protein by Billen et al. (2015). In response to the dietary shifts, movements such as the “slow food” 296
movement, which originated in Turin, Italy (Medina, 2011), and the “real food challenge,” a student 297
network in the U.S. (Allen, 2010), are aiming to create more sustainable food systems through changes 298
in consumption patterns. Encouraging feasible, healthy diets with relatively low NFs and other 299
16
environmental impacts (e.g., greenhouse gas emissions and water use) could substantially reduce Nr 300
emissions, while improving overall enjoyment of food and health. 301
Sustainable diets would ultimately need to incorporate socio-economic dimensions as well 302
as environmental and nutritional health factors (Garnett, 2016). Further investigations are therefore 303
needed to assess the impact of existing healthy diets in different regions and various sustainable food 304
movements on the environment and on social and economic factors. The present findings are a step 305
towards such transdisciplinary research. 306
307
Conclusions
308
Assessing a range of alternative diets can help consumers make healthier and more environmentally 309
friendly dietary choices depending on their preferences. Our assessment of the effect of dietary 310
changes on the food NF in Japan suggests that following the balanced healthy Japanese diet could 311
reduce our food NF, addressing both environmental and health problems while improving overall 312
enjoyment of food. The analysis of various scenarios provides omnivorous consumers a range of 313
feasible food consumption patterns that could help reduce their NFs. Using this information as a guide, 314
consumers can arrange recipes with a lower NF, while movements aimed at sustainable food systems 315
can quantify the effects on N pollution. Thus, consumer actions associated with efforts to increase N 316
use efficiency at the production level could substantially reduce human-induced Nr emissions. 317
318
References
319
Alexandratos, N. 2006. The Mediterranean diet in a world context. Public Health Nutrition 9: 111– 320
117. doi:10.1079/PHN2005932 321
Allen, P. 2010. Realizing justice in local food systems. Cambridge Journal of Regions, Economy 322
and Society 3: 295–308. doi:10.1093/cjres/rsq015
323
Billen, G., L. Lassaletta, and J. Garnier. 2015. A vast range of opportunities for feeding the world in 324
2050: trade-off between diet, N contamination and international trade. Environmental 325
Research Letters 10: 25001. doi:10.1088/1748-9326/10/2/025001
17
Burke, M., K. Oleson, E. McCullough, and J. Gaskell. 2009. A Global Model Tracking Water, 327
Nitrogen, and Land Inputs and Virtual Transfers from Industrialized Meat Production and 328
Trade. Environmental Modeling & Assessment 14: 179–193. doi:10.1007/s10666-008-9149-3 329
de Vries, W., J. Kros, C. Kroeze, and S. P. Seitzinger. 2013. Assessing planetary and regional 330
nitrogen boundaries related to food security and adverse environmental impacts. Current 331
Opinion in Environmental Sustainability 5: 392–402. doi:10.1016/j.cosust.2013.07.004
332
Erisman, J. W., J. N. Galloway, S. Seitzinger, A. Bleeker, N. B. Dise, A. M. R. Petrescu, A. M. 333
Leach, and W. de Vries. 2013. Consequences of human modification of the global nitrogen 334
cycle. Philosophical transactions of the Royal Society of London. Series B, Biological sciences 335
368: 20130116. doi:10.1098/rstb.2013.0116 336
Food and Agriculture Organization of the United Nations (FAO), 2015. FAOSTAT database on food 337
and agriculture. Retrieved 27 October, 2015, from www.fao.org/faostat/en/ 338
Fowler, D., M. Coyle, U. Skiba, M. A. Sutton, J. N. Cape, S. Reis, L. J. Sheppard, A. Jenkins, et al. 339
2013. The global nitrogen cycle in the twenty-first century. Philosophical transactions of the 340
Royal Society of London. Series B, Biological sciences 368: 20130164.
341
doi:10.1098/rstb.2013.0164 342
Galloway, J. N., W. Winiwarter, A. Leip, A. M. Leach, A. Bleeker, and J. W. Erisman. 2014. 343
Nitrogen footprints: past, present and future. Environmental Research Letters 9: 115003. 344
doi:10.1088/1748-9326/9/11/115003 345
Garcia-Closas, R., A. Berenguer, and C. A. González. 2006. Changes in food supply in 346
Mediterranean countries from 1961 to 2001. Public Health Nutrition 9: 53–60. 347
doi:10.1079/PHN2005757 348
Garnett, T. 2016. Plating up solutions. Science 353: 1202–1204. doi:10.1126/science.aah4765 349
Guo, H., K. Niu, H. Monma, Y. Kobayashi, L. Guan, M. Sato, D. Minamishima, and R. Nagatomi. 350
2012. Association of Japanese dietary pattern with serum adiponectin concentration in 351
Japanese adult men. Nutrition, Metabolism and Cardiovascular Diseases 22: 277–284. 352
doi:10.1016/j.numecd.2010.06.006 353
18
Hardy, R. W. 2010. Utilization of plant proteins in fish diets: effects of global demand and supplies 354
of fishmeal. Aquaculture Research 41: 770–776. doi:10.1111/j.1365-2109.2009.02349.x 355
Kearney, J. 2010. Food consumption trends and drivers. Philosophical Transactions of the Royal 356
Society B: Biological Sciences 365: 2793–2807. doi:10.1098/rstb.2010.0149
357
Kido, Y., F. Shizuka, Y. Shimomura, and T. Sugiyama. 2012. Dietary Reference Intakes for 358
Japanese 2010: Protein. Journal of Nutritional Science and Vitaminology 59: S36–S43. 359
doi:10.3177/jnsv.59.S36 360
Kobayashi, S., K. Asakura, H. Suga, and S. Sasaki. 2013. High protein intake is associated with low 361
prevalence of frailty among old Japanese women: a multicenter cross-sectional study. Nutrition 362
Journal 12: 164. doi:10.1186/1475-2891-12-164
363
Kohsaka, R. 2017. The myth of washoku: a twisted discourse on the “uniqueness” of national food 364
heritages. Journal of Ethnic Foods 4. Elsevier Ltd: 66–71. doi:10.1016/j.jef.2017.05.004 365
Lands, W. E., T. Hamazaki, K. Yamazaki, H. Okuyama, K. Sakai, Y. Goto, and V. S. Hubbard. 366
1990. Changing dietary patterns. The American journal of clinical nutrition 51: 991–3 367
Lassaletta, L., G. Billen, B. Grizzetti, J. Garnier, A. M. Leach, and J. N. Galloway. 2014a. Food and 368
feed trade as a driver in the global nitrogen cycle: 50-year trends. Biogeochemistry 118: 225– 369
241. doi:10.1007/s10533-013-9923-4 370
Lassaletta, L., G. Billen, E. Romero, J. Garnier, and E. Aguilera. 2014b. How changes in diet and 371
trade patterns have shaped the N cycle at the national scale: Spain (1961–2009). Regional 372
Environmental Change 14: 785–797. doi:10.1007/s10113-013-0536-1
373
Leach, A. M., J. N. Galloway, A. Bleeker, J. W. Erisman, R. Kohn, and J. Kitzes. 2012. A nitrogen 374
footprint model to help consumers understand their role in nitrogen losses to the environment. 375
Environmental Development 1: 40–66. doi:10.1016/j.envdev.2011.12.005
376
Levine, M. E., J. A. Suarez, S. Brandhorst, P. Balasubramanian, C.-W. Cheng, F. Madia, L. Fontana, 377
M. G. Mirisola, et al. 2014. Low Protein Intake Is Associated with a Major Reduction in IGF-378
1, Cancer, and Overall Mortality in the 65 and Younger but Not Older Population. Cell 379
Metabolism 19: 407–417. doi:10.1016/j.cmet.2014.02.006
19
Medina, F. X. 2011. Food consumption and civil society: Mediterranean diet as a sustainable 381
resource for the Mediterranean area. Public Health Nutrition 14: 2346–2349. 382
doi:10.1017/S1368980011002618 383
Melby, M. K., and W. Takeda. 2014. Lifestyle constraints, not inadequate nutrition education, cause 384
gap between breakfast ideals and realities among Japanese in Tokyo. Appetite 72: 37–49. 385
doi:10.1016/j.appet.2013.09.013 386
Ministry of Agriculture, Forestry and Fisheries of Japan. 1970. Showa 43 Nendo Shokuryo Jukyu 387
Hyo—Ruibetsu Shuyo Komoku no Ruinenhyo Hitori Ichinichi atari Tanpakushitsu (Food
388
balance sheets for April 1968–March 1969—Annual statistics table for per-capita daily protein 389
supply) p80 (in Japanese). Retrieved 20 March, 2017, from 390
http://www.library.maff.go.jp/archive/Index/400199642_0001?p=1&m=0&fop=0&top=0&aop 391
=0&lop=0&s=0&lpp=0&cId=86&st=0&ist=False 392
Ministry of Agriculture, Forestry and Fisheries of Japan. 1977. Showa 50 Nendo Shokuryo Jukyu 393
Hyo—Ruibetsu Shuyo Komoku no Ruinenhyo Hitori Ichinichi atari Tanpakushitsu (Food
394
balance sheets for April 1975–March 1976—Annual statistics table for per-capita daily protein 395
supply) p46 (in Japanese). Retrieved 20 March, 2017, from 396
http://www.library.maff.go.jp/archive/Index/400296448_0001?p=1&m=0&fop=0&top=0&aop 397
=0&lop=0&s=0&lpp=0&cId=86&st=0&ist=False 398
Ministry of Agriculture, Forestry and Fisheries of Japan. 1991. Heisei Gannendo Shokuryo Jukyu 399
Hyo—Ruibetsu Shuyo Komoku no Ruinenhyo Hitori Ichinichi atari Tanpakushitsu (Food
400
balance sheets for April 1991–March 1992—Annual statistics table for per-capita daily protein 401
supply) p 64 (in Japanese). Retrieved 20 March, 2017, from 402
http://www.library.maff.go.jp/archive/Index/001345206_0001?p=2&m=0&fop=0&top=0&aop 403
=0&lop=0&s=0&lpp=0&cId=86&st=0&ist=False 404
Ministry of Agriculture, Forestry and Fisheries of Japan. 2015a. Trends in fisheries/fishery policy: 405
white paper on fisheries: summary. Ministry of Agriculture, Forestry and Fisheries of Japan. 406
Retrieved 17 March, 2017, from http://dl.ndl.go.jp/info:ndljp/pid/10223852 407
20
Ministry of Agriculture, Forestry and Fisheries of Japan. 2015b. Time series data of soybean 408
production record (in Japanese). Ministry of Agriculture, Forestry and Fisheries of Japan. 409
Retrieved 7 March, 2017, from http://www.maff.go.jp/j/seisan/ryutu/daizu/d_data/pdf/001.pdf 410
Ministry of Health, Labour and Welfare of Japan (JMHLW). 2013. The National Health and 411
Nutrition Survey. Ministry of Health, Labour and Welfare of Japan. Retrieved 7 March, 2017, 412 from 413 http://www.mhlw.go.jp/seisakunitsuite/bunya/kenkou_iryou/kenkou/kenkounippon21/en/eiyou 414 chousa/ 415
Nesheim, M., P. J. Stover, and M. Oria. 2015. Food systems: Healthy diet sustains the environment 416
too. Nature 522: 287–287. doi:10.1038/522287b 417
Nishina, K., A. Ito, N. Hanasaki, and S. Hayashi. 2017. Reconstruction of spatially detailed global 418
map of NH4+ and NO3- application in synthetic nitrogen. Earth System Science Data 9: 149– 419
162. doi:10.5194/essd-9-149-2017 420
Oda, K., and N. Matsumoto. 2006. Nitrogen cycle model at country level. In Design and Evaluation 421
of Biomass Utilization System, 219–235. Tsukuba: Systematization sub-team of study on
422
biorecycling of wastes from agriculture, forestry and fisheries researching sector (in Japanese). 423
Oita, A., A. Malik, K. Kanemoto, A. Geschke, S. Nishijima, and M. Lenzen. 2016a. Substantial 424
nitrogen pollution embedded in international trade. Nature Geoscience 9: 111–115. 425
doi:10.1038/ngeo2635 426
Oita, A., I. Nagano, and H. Matsuda. 2016b. An improved methodology for calculating the nitrogen 427
footprint of seafood. Ecological Indicators 60: 1091–1103. doi:10.1016/j.ecolind.2015.08.039 428
Sáez-Almendros, S., B. Obrador, A. Bach-Faig, and L. Serra-Majem. 2013. Environmental 429
footprints of Mediterranean versus Western dietary patterns: beyond the health benefits of the 430
Mediterranean diet. Environmental Health 12: 118. doi:10.1186/1476-069X-12-118 431
Shibata, H., L. R. Cattaneo, A. M. Leach, and J. N. Galloway. 2014. First approach to the Japanese 432
nitrogen footprint model to predict the loss of nitrogen to the environment. Environmental 433
Research Letters 9: 115013. doi:10.1088/1748-9326/9/11/115013
21
Shibata, H., J. N. Galloway, A. M. Leach, L. R. Cattaneo, L. Cattell Noll, J. W. Erisman, B. Gu, X. 435
Liang, et al. 2017. Nitrogen footprints: Regional realities and options to reduce nitrogen loss to 436
the environment. Ambio 46: 129–142. doi:10.1007/s13280-016-0815-4 437
Shimazu, T., S. Kuriyama, A. Hozawa, K. Ohmori, Y. Sato, N. Nakaya, Y. Nishino, Y. Tsubono, et 438
al. 2007. Dietary patterns and cardiovascular disease mortality in Japan: a prospective cohort 439
study. International Journal of Epidemiology 36: 600–609. doi:10.1093/ije/dym005 440
Shindo, J., and A. Yanagawa. 2017. Top-down approach to estimating the nitrogen footprint of food 441
in Japan. Ecological Indicators 78: 502–511. doi:10.1016/j.ecolind.2017.03.020 442
Shindo, J., K. Okamoto, H. Kawashima, and E. Konohira. 2009. Nitrogen flow associated with food 443
production and consumption and its effect on water quality in Japan from 1961 to 2005. Soil 444
Science and Plant Nutrition 55: 532–545. doi:10.1111/j.1747-0765.2009.00382.x
445
Steffen, W., K. Richardson, J. Rockström, S. Cornell, I. Fetzer, E. Bennett, R. Biggs, S. R. 446
Carpenter, et al. 2015. Planetary boundaries: Guiding human development on a changing 447
planet. Science 347: 1259855. doi:10.1126/science.1259855 448
Stevens, C. J., A. M. Leach, S. Dale, and J. N. Galloway. 2014. Personal nitrogen footprint tool for 449
the United Kingdom. Environmental science. Processes & Impacts 16: 1563–1569. 450
doi:10.1039/c3em00690e 451
Sutton, M. A., C. M. Howard, J. W. Erisman, G. Billen, A. Bleeker, P. Grennfelt, H. van Grinsven, 452
and B. Grizzetti, ed. 2011. The European Nitrogen Assessment: Sources, Effects and Policy 453
Perspectives. New York: Cambridge University Press.
454
United Nations Environment Program (UNEP) and Woods Hole Research Center (WHRC). 2007. 455
Reactive Nitrogen in the Environment: Too much or too little of a good thing. Paris: UNEP.
456
Tilman, D., and M. Clark. 2014. Global diets link environmental sustainability and human health. 457
Nature 515: 518–522. doi:10.1038/nature13959.
458
Westhoek, H., J. P. Lesschen, A. Leip, T. Rood, S. Wagner, A. De Marco, D. Murphy-Bokern, C. 459
Pallière, et al. 2015. Nitrogen on the Table: The influence of food choices on nitrogen 460
22
emissions and the European environment. European Nitrogen Assessment Special Report on
461
Nitrogen and Food. Edinburgh, UK: Centre for Ecology & Hydrology.
462
Yamamoto, K., S. E, Y. Hatakeyama, Y. Sakamoto, T. Honma, Y. Jibu, Y. Kawakami, and T. 463
Tsuduki. 2016. The Japanese diet from 1975 delays senescence and prolongs life span in 464
SAMP8 mice. Nutrition 32: 122–128. doi:10.1016/j.nut.2015.07.002 465