Influences of Regional Inequality in Education
in Indonesia
著者
Azzizah Nurul Yuni
学位授与機関
Tohoku University
学位授与番号
11301甲第17781号
1
平成29年度(2017年)
博士論文
Influences of Regional Inequality in Education in Indonesia
(インドネシアの教育における地域格差に関する研究)
国際資源政策論講座
国際資源政策論講座(ヒューマン・セキュリティ連携国際教育プログラム)
2 TABLE OF CONTENTS Table of Contents ... 2 List of Figures ... 5 List of Tables ... 7 Abbreviations ... 8 Chapter 1. Introduction ... 9
1.1. Education and Human Security ... 13
1.2. Indonesia Education Policy ... 15
1.2.1 Education Decentralization ... 20
1.2.2 School - Based Management ... 24
1.3. Previous Studies and Problem Statement ... 25
1.4 Outline ... 27
Chapter 2. Educational conditions in comparison across Indonesia region ... 28
2.1. Regional authorities and their influence on Indonesian education ... 30
2.2 Importance of Education for Indonesian Regional Development ... 39
2.3. Relation between Regional Education and Socio - Economy Condition40 2.3.1. Poverty rate ... 42
2.3.2. GDP growth ... 43
2.3.3. Gini index ... 43
Chapter 3. Gender gap in education in Indonesia ... 45
3
3.2. Poverty and Female Education in Indonesia ... 53
3.3 Summary of the relation between uneducated rate and related factors. . 55
Chapter 4. Quantifying Regional Disparity: Regional Education Index ... 59
4.1. Quantifying a quality... 59
4.1.1. Social indicator ... 59
4.1.2. HDI: Quantifying Human Development ... 60
4.1.3. HDI with Arithmetic Mean ... 61
4.1.4. HDI with Geometry Mean ... 64
4.2. Components of Regional Education Quality ... 66
4.2.1. Education participation ... 66
4.2.2. Facility quality ... 71
4.2.3 Socio-economy quality ... 76
4.3 Regional Education Index ... 78
Chapter 5. Case studies of regional education: The case of Java ... 81
5.1 Education and Culture through the history ... 85
5.1.1 Education in Hindu - Buddhist Period ... 85
5.1.2 Education in Islam Period ... 87
5.1.3 Education in Dutch Colonial Period ... 89
5.1.4 Education in Japanese Occupation ... 90
5.1.5 Education in Independence Period ... 92
4
5.2 Education Development in Major Ethnics ... 104
5.2.1 Javanese ... 106
5.2.2 Sundanese ... 108
5.3 Survey Result ... 110
5.2.1 Understanding of the Importance of Education ... 111
5.3.2 Knowledge about government policy ... 114
5.3.3 Gender preference ... 117
5.4 Summary of case study ... 120
Chapter 6. Conclusion ... 122
Acknowledgement ... 126
References ... 126
5
LIST OF FIGURES
Figure 1.1 Indonesia Population Distribution ... 12
Figure 2.1. The Government Expenditure on Education in recent years. ... 34
Figure 2.2. Human Development Index (HDI) across Indonesia provinces. ... 35
Figure 2.3. Disparities in enrollment rates increase with the level of education ... 37
Figure 2.4. Relation of HDI and uneducation rate in western and eastern Indonesia. ... 38
Figure 3.1. Indonesia rank in 2013 GGG (Global Gender Gap) index. ... 45
Figure 3.2. Monetary budget on education of Indonesia increase from 2004 to 2014. ... 50
Figure 3.3. Female uneducated rate vs Provinces Expenditure on Education per population. ... 51
Figure 3.4. Female uneducated rate vs Human Development Index. ... 53
Figure 3.5. Female uneducated rate vs. education cost.. ... 54
Figure 4.1. The arithmetic mean of two index. ... 63
Figure 4.2. The arithmetic mean of two index. ... 65
Figure 4.3 Indonesia elementary school students’ density map per province ... 67
Figure 4.4 Indonesia junior secondary school students’ density map per province ... 68
Figure 4.5 Indonesia senior secondary school students’ density map per province ... 69
Figure 4.6. Dynamic of Net Enrollment Rate (NER) across region. ... 70
Figure 4.7. Dynamic of children uneducation rate across region. ... 70
Figure 4.8. Graph of number of primary education teachers versus population of Indonesian provinces, from 2011 to 2013. ... 71
6 Figure 4.10. Graph of number of teacher versus population (thousand): Primary school in eastern
Indonesia accommodates less population than its western counterparts. ... 73
Figure 4.11. Number of teacher vs population. Teachers in eastern Indonesia serve less people than in western Indonesia. ... 75
Figure 4.12. Poverty and Education correlation of Indonesia provinces. ... 76
Figure 4.13. Poverty across Indonesia region.. ... 77
Figure 4.14. Regional Education Index across Indonesia provinces. ... 79
Figure 4.15. Strong correlation of REI and HDI.. ... 80
Figure 5.1. Hinduism and Buddhism spreads in Indonesia. ... 86
Figure 5.2. The spreads of Islam to Indonesia. ... 88
Figure 5.3. Ethnic groups in Java - Bali. ... 104
Figure 5.4. Age distribution of Interviewee ... 111
Figure 5.5. Answer to “do you know the merit of going to school?” ... 112
Figure 5.6. Answer to “do you want to go back to school?” ... 113
Figure 5.7. Answer to “do you know about government education policy?” ... 115
Figure 5.8. Answer to question about the knowledge of particular government education program ... 116
Figure 5.9. Answer to “which gender do you prefer to send to school?” ... 119
7
LIST OF TABLES
Table 1-1. Structure of Indonesia Education System ... 18
Table 2-1. HDI vs Uneducated Rate Regression Coefficient ... 40
Table 3-1. Provinces with large illiteracy rate and illiteracy rate gap in Indonesia ... 46
Table 3-2. Indonesia percentage of uneducated children 2009-2011 ... 48
Table 3-3. Government Expenditures for Primary Education by Country (World Bank). ... 49
Table 3-4. Values of linearity coefficients representing gender gap ... 56
Table 4-1. Result of regression SCHOOL = (b0 + b1 × EW) × POPULATION ... 73
Table 4-2. Result of regression TEACHER = (C0 + C1 × EW + C2 × YEAR) × POPULATION 74 Table 5-1. Population PersentageAged 7-17 years old that has never been go to school/do not go to school ( BPS) ... 84
Table 5-2. Ethnic Composition of Indonesia in 2010 ... 105
8
ABBREVIATIONS
BPS Biro Pusat Statistik (Central Bureau of Statistics of Indonesia)
EFA Education for All
GDP Gross Domestic Product
GER Gross Enrolment Ratio
MA Madrasah Aliyah (Islamic Upper Secondary School)
MI Madrasah Ibtidaiyah (Islamic Primary School)
MTs Madrasah Tsanawiyah (Islamic Lower Secondary School)
NER Net Enrolment Ratio
PPP Purchasing Power Parity
SD Sekolah Dasar (General Primary School)
SMA Sekolah Menengah Atas (General Upper Secondary School)
SMP Sekolah Menengah Pertama (General Lower Secondary School)
SMK Sekolah Menengah Kejuruan (Technical and Vocational Education)
UAN Ujian Akhir Nasional (National Examination)
UIS UNESCO Institute for Statistics
UN Ujian Nasional (National Examination)
UNDP United Nations Development Programme
UNESCO United Nations Educational, Scientific, and Cultural Organization
UNICEF United Nations Children’s Fund
UNPD United Nations Population Division
USAID United States Agency for International Development
9
CHAPTER 1. INTRODUCTION
Basic education has been the objective of generations of teachers, parents and government leaders. It is a fundamental human right, both in international convention on economic, cultural, and social rights of the child. In 1872, Japan’s educational code promised that there would be “no community with an illiterate family, nor a family with an illiterate person”1. Similar campaigns of education for self-reliance were advanced by Ghana’s Kwame Nkrumah, Tanzanian’s Julius Nyerere, Kenyas’s Jomo Kenyatta and others in post-independence Africa2.
United Nations also emphasizes the importance of primary education. One of its Sustainable Development Goals, the successor of Millennium Development Goals, specifically mentions the education targets: By 2030, ensure that all girls and boys complete free, equitable and quality primary and secondary education leading to relevant and effective learning outcomes; ensure that all girls and boys have access to quality early childhood development, care and pre-primary education so that they are ready for primary education; ensure equal access for all women and men to affordable and quality technical, vocational, and tertiary education, including university; substantially increase the number of youth and adults who have relevant skill, including technical and vocational skill, for employment, decent jobs and entrepreneurship; eliminate gender disparities in education and ensure equal access to all levels of education and vocational training for the vulnerable, including persons with disabilities, indigenous peoples and children in vulnerable situation; ensure that all youth and a substantial proportional of adults both men and women, achieve literacy and numeracy; ensure that all learners acquire the knowledge and skill
1 Ogata and Sen, 2003, p. 115. 2 Assensoh, 1998, p. 147.
10 needed to promote sustainable development, including, among others, through education for sustainable development and sustainable lifestyles, human right, gender equality, promotion of a culture of peace and non-violence, global citizenship and appreciation of cultural diversity and of culture’s contribution to sustainable development3.
Besides the target that mention under each goals, the following key for realizing the agenda are of equal importance: build and upgrade education facilities that are child, disability and gender sensitive and provide safe, non-violent, inclusive and effective learning environments for all; By 2020, substantially expand globally the number of scholarship available to developing countries, in particular least developed countries, small island developed states and African countries, for enrollment in higher education, including vocational training and information and communications technology, technical, engineering and scientific programs, in developed countries and other developing countries; By 2030, substantially increase the supply of qualified teachers, including through International cooperation for teacher training in developing countries, especially least developed countries and small island developing states4.
Unfortunately, Indonesia as the largest economy in Southeast Asia is among the developing countries that still faces the problem of uneducated children. Although the bar of compulsory education has been raised in 2013 to include the upper secondary years (equivalent to secondary school, up to 18 years old), the high illiteracy and children uneducated rate in eastern Indonesia, in comparison to western Indonesia, is still a central concern of government policies and NGO’s activities across its region.
Western Indonesia consists of Java, Bali, Sumatra and Kalimantan, while Eastern Indonesia is made up of Sulawesi, Nusa Tenggara Archipelago, Maluku Archipelago, and Papua. Western
3 United Nations, 2015, p. 19. 4 United Nations, 2015, p. 20.
11 Indonesia, especially Java and Bali, is significantly more developed than Eastern Indonesia in terms of economic activity, infrastructure, and population. Besides western Indonesia versus eastern Indonesia, in term of education level, Suryadarma explained that Indonesia can be segregated into Java and Bali versus outside Java and Bali; and urban versus rural areas5.
This dissertation categorizes the provinces into western and eastern Indonesia according to its geographical position (see Figure 1.1 Indonesia Population Distribution (Socioeconomic Data and Applications Center, Columbia University). Indonesia is a vast archipelago comprising 13,446 islands populated by 252 million people from 360 ethnic groups.). Provinces in Sumatra, Java, Kalimantan and Bali are categorized as western Indonesia. In this research categorization, the line separating the regions is the Wallace line. Wallace line marked the end of Asia continental plate on which western Indonesia is based upon. Conventionally, the Wallace line is used to zoogeographically categorized Indonesia biodiversity6.
5 Suryadarma, Widyanti, and Sumarto, 2006, May, p. 106. 6 Oosterzee, 1997, p. 234.
12
Figure 1.1 Indonesia Population Distribution (Socioeconomic Data and Applications Center, Columbia University). Indonesia is a vast archipelago comprising 13,446 islands populated by 252 million people from 360 ethnic groups.
13
1.1. Education and Human Security
Human security is the protection and preservation of human “survival” and “daily life” against premature death, avoidable ill-health, the massive handicap of illiteracy. etc. and also the avoidance of various indignities that can shower injury, insult and contempt on our live, for example, to destitution, penury, incarceration, exclusion, or - again - illiteracy and innumeracy7. Pursuing this line of analysis, it can be argued that the “underpinning” of the concept of human security must include at least the following distinct elements:
1. A clear focus on individual human lives. This would contrast, for example, with the aggregated technocratic notion of “national security” - the favored interpretation of “security” in the military context;
2. An appreciation of the role of society and of social arrangements in lives more secure in a constructive way. By avoiding a socially detached view of individual human predicament and redemption, emphasized in some - but not all making human - religious contexts. 3. A reasoned concentration on the downside risks of human lives, rather than on the overall
expansion of effective freedom in general. By contrasting with the broader objective of the promotion of “human development”.
4. A chosen focus, again, on the “downside” in emphasizing the more elementary human rights, rather than the entire range of human rights8.
Human security is closely related to “human development” and “human rights,” and even to “national security” and to “individual dedication,” but it is not the same as any of them. It is as important to be clear about the distinctions involved as it is to see the interdependence and
7 Sen, 2002, January, (para 2). 8 Sen, 2002, January, (para 3).
14 inter linkages of human security with other important concerns pursued in contemporary global discussion. Contrasted with a GNP-centered understanding of the process of development, the concept of human development has drawn on the need to focus on enhancing human freedom and capability in general. Not surprising, it has given a central place to basic education as a critically important component of human development9.
In additions to the human security benefits stemming from education, school can acts as delivery points for other human security interventions, such as school feeding, immunization, landmine awareness and cholera prevention programs. Free school meal or rations increase parent’s incentive to send children to school. Better nourishment improves a child’s ability to concentrate and thus to learn. Studies in Benin, Burkina Faso and Togo, among others, found that when school meal provided, children’s test scores improved. It is through schooling that student may be enabled to address direct threats to their survival, livelihood and dignity now and in the future10.
Education can also give people freedom through knowledge, public expression and democratic debate to promote their human security and that of others. Free, independent and pluralistic information media are an integral part such freedom, as in an education that opens the mind. This was emphasized in the Universal Declaration on Human Rights, which articulates the right to an education that supports “human rights and fundamental freedoms” and promotes “Understanding, tolerance and friendship among all nations, racial or religious groups”. Without such freedom, when people’s ability to communicate with one another and to speak out is
9 Sen, 2002, January, (para 4). 10 Ogata and Sen, 2003, p. 115.
15 suppressed, lives are improvised11. That is why a further set of relationships between education and human security focuses on empowerment.
Education has a strong relation with many aspects of human’s security. In the rapid growth of human population, the understanding of human security should be increased. To be able to achieve that, every part of society should understand the importance of human security. Promotion is a necessary part in increasing this understanding of human security.
If the education level of a country increases, the concept of human security should be easier to be accepted by the citizen. The promotion process can be done efficiently, so that every people can achieve their security. Education is one way to promote this human security. The question of transparent curriculum and the reach of reason can be quite central to the role or education in promoting human security.
If the school fail to do that by “trusting smallness“ on young children, not only reduce their basic human right to learn widely, but also make the world much more incendiary than it should be. The connections between basic education and human security include these issues as well.
1.2. Indonesia Education Policy
The Ministry of Education and Culture (now the Ministry of National Education) is responsible to the government for the planning and execution of education. At the central level, the organizational structure of the Ministry of National Education consists of the following units: The Secretariat General; the National Institute for Educational Research and Development; the Inspectorate General; the Directorate General of Basic and Secondary Education; the Directorate General of Higher Education; the Directorate General of Out-of-School Education, Youth and
16 Sports; and the Directorate General of Culture.
The Centre for Curriculum and Educational Facilities Development—or Curriculum
Development Centre (CDC)—established in 1969, comes under the authority of the Office of
Educational and Cultural Research and Development in the Ministry of National Education. It is composed of four divisions:
(a) Pre-school, primary and special education; (b) Secondary schools;
(c) Higher Education; (d) Educational facilities12.
The Centre’s main functions are: (a) to formulate technical policies on curriculum development and educational facilities; (b) to conduct, co-ordinate and guide the development of curriculum and educational facilities covering institutional objectives, programme structure and basic course outline, teaching learning models and methods, learning materials, etc.; and (c) to formulate suggestions on government policy. At the lower level, the the Ministry of National Education is represented by a Provincial Office of Education in each of the twenty-seven provinces, and by a District Office in each of the 305 districts. The major task of the provincial and district offices is to operationalize, manage, adapt and implement ministerial policies on education and culture with respect to each of their distinctive features and local and environmental needs13.
Since Soeharto era, Indonesian education system is based on the American school system. The compulsory education consists of six years of Elementary School (Sekolah Dasar, SD) and three years of Junior Secondary School (Sekolah Menengah Pertama, SMP). After this, students can choose a vocational school (Sekolah Menengah Kejuruan. SMK) or Senior
12 United Nations Educational, Scientific and Cultural Organization IBE, n.d. (para 21). 13 United Nations Educational, Scientific and Cultural Organization IBE, n.d. (para 19).
17 Secondary School (Sekolah Menengah Atas, SMA), followed by university. These schools are fall under the responsibility of Ministry of Education and Culture.
Indonesia also has schools that underline the importance of religious knowledge. These religious schools fall under the responsibility of Ministry of Religious Affairs. Islamic Schools:
Raudhatul Atfal (RA), Madrasah Ibtidaiyah (MI), Madrasah Tsanawiyah (MTs), and Madrasah Aliyah (MA) are corresponding to Kindergarten (Taman Kanak-kanak, TK), Elementary School,
Junior Secondary School, and Senior Secondary School, respectively. In religious schools, secular knowledge isalso taught. Provision of higher education is managed by the Ministry of National Education through the Directorate General of Higher Education, as well as by the Military Academy and the College for Civil Servants14.
18
Table 1.1. Structure of Indonesia Education System (The National Education System Law No 20/2003) Islamic school and its equivalent grade. While the general curriculum follow the normal school, a set of religion focused curriculum and rules are regulated by Ministry of Religious affairs.
School Age
Ministry of Religious Affairs
Ministry of Education and Culture
5 Raudhatul Atfal (RA) Kindergartens (Taman Kanak-kanak, TK) 6 7 Madrasah Ibtidaiyah (MI) Elementary School (Sekolah Dasar, SD) 8 9 10 11 12 13 Madrasah Tsanawiyah (MTs)
Junior Secondary School (Sekolah Menengah Pertama, SMP)
14 15
16 Madrasah Aliyah
(MA)
Senior Secondary School (Sekolah Menengah Atas,
SMA) Vocational School (Sekolah Menengah Kejuruan, SMK) 17 18
19 The main Education for All objectives of Indonesia’s basic education system includes decreasing the percentage of worn-out school buildings to 1%. For literacy, the goal is to reduce the current number of illiterates (5,579,000 people) by 50% among the population age 15 and above by 2015. In order to increase the education of children, government also provide Early Childhood Education and Development. Early childhood education and development (ECED) services in Indonesia are provided in a variety of formats by several different Ministries. The majority of project centers do not charge fees. However, significant coordination was not found15.
As mandated by the Indonesian Constitution and as part of its global commitments to the Convention on the Rights of the Child (CRC), the Convention on the Elimination of All Forms of Discrimination Against Women (CEDAW), the Education For All (EFA), and the Millennium Development Goals (MDGs), the government has been implementing general policies to promote basic education by improving access and expanding learning opportunities for all school-aged children. The government has also issued specific policies to promote gender equality in education by providing equal access for all boys and girls to quality and gender-sensitive education; and implementation strategies by creating a national movement on gender-sensitive education involving related stakeholders such as parents, community leaders, NGOs, as well as private and industrial sectors.
A policy, if not been promoted is meaningless. It is very important to make effort to promote a government policy to their citizen. The principal law of Indonesia, the 1945 Constitution’s preamble, it is clearly stated that the country’s aim is to promote the social welfare and to increase the education of the citizen. Education is a process to increase the intelligent of the citizen. To achieve the target, human development is an important factor that should be
20 prioritized. The main factor to the success of the development of a country is the availability of the qualified human resources. Education is one of the ways to increase the quality of the human resources. The flaw in education promotion in Indonesia is a responsibility of the government of Indonesia to make more effort in promoting education, especially to rural areas. In the majority of Indonesia rural area there is still a difficulty to access the information to understand the quick development of the modern world.
1.2.1 Education Decentralization
Since Indonesia became independent in 1945 until the end of the twentieth century, it was among the most highly centralized nations in the world. Government is a primary actor on the educational matters in Indonesia. Ministry of Education holds the power to regulate curriculum education system of public schools and some of the private school, while the curriculum of Islamic school is regulated by Ministry of Religious Affairs. The centralization of authority in Indonesia could enforce the dependence of regional leaders on Jakarta (the capital of Indonesia) and even cause them to orient themselves away from their local constituents and toward the central authorities. In its early periods, the Indonesian regional governments had little autonomy, which was one of the precipitating causes of Indonesia’s financial crisis in the late 1990s16.
Although the term “decentralization” was already used in Law No 5/1974, the real transformation began in May 1998, when a radical political movement towards decentralization resulted in the enactment of Law No 22/1999 on Regional Government, Law No 25/1999 on
21 Balanced Provisions of Finance between the Central and Regional Governments, Government Regulation No 25/2000 on the Authority of the Central and Provincial Governments, as well as Law No 25/2000 on National Development Programs. These laws and regulations were formulated due to increasing recognition of the importance of democracy, community participation, equitable distribution of wealth, and justice, as well as out of consideration for regional diversity. The decision to redistribute power and decision making to local government bodies as representing a significant departure from the previous centralized, top-down nature of government in Indonesia17.
Decentralization can be defined as transfer of planning, decision making, or administrative authority from the central government to its field organizations, local administrative units, semi-autonomous and parastatal organizations, local government or non-governmental organization. Decentralization can be categorized into three forms:
1. Deconcentration, which is a distribution of tasks from central ministries to their field offices. Although the field offices are located far away from the headquarter, they are formally the institution of central government. In deconcentration, the central ministries retain decision making while the field offices are only implementer agents;
2. Delegation, which is a transfer of tasks from central government to organizations, public enterprises or specific chambers outside of government bureaucracy;
17 Ibid.
22 3. Devolution, which is a transfer of decision making from central to local government. In devolution, local government is autonomous and not a part of central bureaucracy18.
However, clear categorization of decentralization rarely takes place since there is clearly an overlap in its typology. Decentralization is always a combination of various types ranging from deconcentration to devolution. In any countries, decentralization at least consists of an arrangement in policy, finance or administration.
Decentralization design ranges from political, administrative, fiscal and economic decentralization. Political decentralization, includes establishment of procedures to improve people participation in local political process. Devolution of power to local government is equal to political decentralization. Administrative decentralization includes deconcentration of central bureaucracy and delegation of government tasks. Fiscal decentralization includes transfer of revenue sharing and expenditure discretion to local government. Economic decentralization, which includes liberalization, deregulation and privatization19.
Many countries are now applying decentralization, in any forms, to develop areas. Decentralization is the latest fashion in development administration. By the early 1990s, 84% of the countries having population more than 5 million had adopted it. While decentralization gains vast attention from academicians, development practitioners, international donors and
18 Sutiyo and Maharjan, 2017, p. 15. 19 Sutiyo and Maharjan, 2017, p. 16.
23 governments, there is no universally single design of decentralization. The design varies across the countries depending upon their political and administrative arrangements20.
Among successful movements towards decentralization, Indonesian devolution program was one of the fastest and most comprehensive decentralization initiatives ever attempted by any country in the region. The decentralization of government led to the implementation of educational decentralization, widely considered as a milestone in developing a better quality of national education. Moreover, the decentralization has resulted in local assemblies operating in a more accountable and democratic fashion than ever before21.
The increasing popularity of decentralization leads to a misunderstanding where it is deemed automatically to result in successful development. Whereas, there have been increasing evidences that decentralization does not automatically create successful rural development. Among the implementation of decentralization in nine regionally dispersed countries, only in West Bengal and Kerala of India and Bolivia where decentralization has a positive impact on poverty alleviation. The rest is a somewhat positive impact in South Africa, Philippines, Ghana, a mixed impact in Uganda and a negative impact in Guinea and Madya Pradesh of India. Their review finds lack of evidences that decentralization directly increases efficiency and improves governance for more demand-oriented social service provision22.
20 Sutiyo and Maharjan, 2017, p. 16. 21 Bandur, 2012, p. 35.
24
1.2.2 School - Based Management
Public education worldwide has experienced periodic trends where the school management emphasis shifts along a continuum of centralization and decentralization. In this context, many researchers affirm that one of the most significant reforms in the current restructuring of school systems has been the devolution of decision-making authority to school level through a move towards School-Based Management (SBM).
After the declaration of Laws 22 and 25/1999 and Government Regulation 25/2000, the large portions of education managements are delegated to the regional governments. In the end, Indonesia adopted new scheme in handling education administration issues that is School Based Management (SBM). These laws and regulations are created with the objectives to empower the regional governments in managing national education in their area, especially from preschool to secondary school educations. Even then, the power to formulate, implement, monitor and evaluate the national education policies is still in the hand of central government. That’s why it is hard to separate the role of the government from its citizen education issues. The regional government is making efforts to resolve the education issues.
With the turn of 21st century, SBM has become a model for the decentralization of the education system in Indonesian by shifting authority and responsibility to school-level decision-makers known as dewan (komite) sekolah (school councils). In fact, persatuan orang
tua dan guru/POMG (parent-teacher association) were established in the 1950s, but their main
responsibility was limited to non-instructional matters such as school buildings and school finances, while authority over the curriculum remained vested in school staff (Education Act 4/1950, Chapter 78, article 4). The POMG was later replaced by the badan pembantu
25 only responsible for providing additional school finances. Authority with regard to curriculum, textbooks, school facilities, and deployment and development of staff remained the responsibility of the central government, while responsibility for building maintenance and renovations was devolved to the district government (Law No 2/1989 on the National Education System; Government Regulation No 28/1990, article 9). On the basis of this regulation, the principal was given responsibility in terms of academics, school administration, staff training, and the maintenance of school facilities.23
1.3. Previous Studies and Problem Statement
The study of disparities has studies has been conducted variously regarding Indonesia regions. In Resosudarmo and Viddyattama (2006), it was found that disparities are still severe and there was also evidence that the disparities were between regions and within regions (Akira and Alisyahbana; 2002)24. In addition, studies of other countries show that industrial types (Fan, 2003), and main economy sector and political order (Shankar and Shah; 2003), effects the level of disparities between and within countries. Consequently, theories and econometric analysis on regional inequality and convergence also has been developed in the last two decades such as Quah (1992), Martin and Sunley (1998), and Barro and Sala-I-Martin (2004). Mejia and St-Pierre (2008) developing a general equilibrium model that explores the relationship between inequality in education opportunity, inequality in education outcomes, and human capital formation. They find that higher inequality in opportunity leads to lower average human capital in society, higher inequality in distribution of human capital, and higher wage inequality. Jones in 2003 stated that there are three reasons why children face unequal opportunity for schooling in Indonesia: first,
23 Bandur, 2012, p. 36. 24 Aritenang, 2008, p. 5.
26 economic reason, second, low recognition of the importance of education and the third cultural factors across the region25. The regional government is making efforts to resolve the education issues through their regional policy. That is why it is hard to separate the role of the government from its citizen education issues.
The research aim is to quantify the inequality in the regions in Indonesia and its influence on education level of the respective area, to identify and evaluate the human security development in Indonesia education. While previous studies have discussed the disparity qualitatively and quantitatively, no one unified education index that can quantify the disparity. Here, the existed disparities are analyzed and an index to quantify it is proposed. By figuring out the most prominent factors that affect the inequality in the formulation and the execution of the policies, government’s policies that concerns education can be evaluated, revisited and reviewed.
Data sets used in quantitative analysis of disparities in Indonesia education are provided by Badan Pusat Statistik (BPS). BPS is non-ministerial governmental body that directly under President of Indonesia. It was created under as Biro Pusat Statistik in 1960 for census and statistic purposes according to Law No 6 and 7/1960. In 1997, the bureau was renamed Badan Pusat
Statistik by Law No 16/1997. The law stated the purpose of BPS:
• Statistical results obtained by BPS is to be published in Berita Resmi Statistik (BRS, Statistic Official News) periodically and transparently so that public can easily access the data.
• A reliable, effective and efficient national statistic system.
A statistic society forum is created to receive people’s aspiration of the society member, to control and to give suggestions to BPS. According the law, BPS job covers
25 Jones, 2003, p. 27.
27 • To provide data according to society and governmental need. The data is obtained by
conducting census or from secondary data provided by other governmental body. • To help other institution, government department to build a national statistic system. • To provide service in the education and training concerning statistical science, develop and
promote statistical method and technical standards.
• To build a collaboration with international institution and other country government for the sake of development of Indonesia statistic.
1.4 Outline
Chapter 2 discusses the condition of education across its region and how government policies influence the regional education. The regional disparity in education can be evaluated by comparing of conditions of regional education across Indonesia provinces. The relation between regional social, economy, and education condition are compared quantitatively. Chapter 3 shows another dimension of disparity, that is gender gap. A further discussion shows that there is also a regional disparity on the gender gap. In these chapters, quantitative description of education disparities in Indonesia are given.
In chapter 4, a regional education index that can be used to quantitatively compare education quality in Indonesia regional education is proposed. A focused discussion about cultural aspect of Indonesia education is given in chapter 5. In this chapter, survey result is also discussed to show a case study of Java’s regional education. Last but not least, the findings is concluded in chapter 6.
28
CHAPTER 2. EDUCATIONAL CONDITIONS IN COMPARISON ACROSS INDONESIA REGION
Indonesia is a country located in South East Asian region. It is the fourth most populated country after China, India and United States of America, see Table 1. It is an archipelago consists of 17,508 islands with 5 main islands of Sumatra, Java, Borneo, Sulawesi, and Papua. Indonesia consists of 34 provinces and 40% of its population concentrated in Java Island26. With 85 % of the population are Muslims, Indonesia is a Muslim majority country, it has the largest Muslim population in the world. There are almost as many Muslims living in Indonesia as in entire Arab-speaking countries combined27.
One of the most prominent goals in Indonesia’s education is to achieve enrollment for all students at the basic educations which is primary and Junior Secondary Schooling. It is obvious that the government will put more effort and funds to achieve this objective. The nine-year compulsory education (Wajib Belajar Sembilan tahun) program is the part of the new education policy (Law No 23/2003). This nine years consist of six years in Primary School level (starting from 7-12 years old) and continued to Secondary level (13-16 years old). Therefore, the education expenditure is mostly directed to the primary and Junior Secondary level since the policy stresses the objective towards the basic schooling for all the students. This national objective is also related to International commitment to provide basic education for all and to reach the universal primary education as a part of the Millennium Development Goals. Hence, it is in the interest of the government to fulfill the International commitment. The target of the government is to reach the
26 BPS, 2012 (para 1). 27 Gade, 2004, p. 1.
29 100 percent enrollment for the primary schools and 96 percent at the junior secondary schools education in 2009. This target seems to have reached the intended goal through the enrollment rates achieved in these two education levels. The gross enrollment rates for the primary school were 105 percent and in net percentage decline to 91. This is a significant achievement as the net enrollment will be expected to be reached the 100 percent by 2009. The enrollment rates for junior secondary school were smaller than primary schooling; it was 81 percent and this number had quite a significant gap with the net enrollment rate that was fallen into 62 percent. The education expenditure allocated for these two levels can be argued as having a positive impact on the students since the enrollment rates are considered high. The senior secondary school enrollment rates were smaller, 41.6 percent on the net scale. This level has the smallest percentage compare to the two basic education levels. The low share of the education budget for this level seems to be the major reason for this. It might be too early to assume that more spending in certain level of education will likely to produce a higher enrollment rates on the specific level. It means that there would be a change in the policy, and it would likely to affect the whole system28.
Changing the financing mechanism in the education system will require the alteration of the policy objective and targets. As Demery (2000) points out, changes in expenditure will have complex effects. Having the change in the education spending mechanism at present seems to be quite difficult for the government. Given the fact that the enrollment rate for primary schools is almost reaching the target, the government needs to shift the focus on the junior secondary level. To reach this focus, a progressive step has been undertaken by the government in the last two years by
28 Samosir, 2008, p.28.
30 increasing the budget share for secondary school in order to boost the enrollment rates at this education level29.
2.1. Regional authorities and their influence on Indonesian education
Indonesian Principal Constitution, the 1945 Constitution, stipulates that every Indonesian citizen should have the right to obtain a quality basic education. Compulsory primary education for children aged 7 to 12 years of age was made a national policy in 1985. In 1994, Indonesia extended basic education by including 13 to 15 years old, that is, the lower secondary years. After the declaration of Law No 22/1999, Law No 25/1999 and Government Regulation No 25/2000, a large portion of education managements are delegated to the regional governments. In the end, Indonesia replaces the scheme of handling education administration issues, with a management scheme called that is School Based Management (SBM). These laws and regulations are created to envoy some power to the regional governments for managing national education in their area, especially from preschool to secondary school educations. Even then, it is still the responsibility of the central government to formulate, implement, monitor and evaluate the national education policies. That is why it is hard to separate the role of the central government from its citizen education issues. The regional government is expected to make efforts to resolve the education issues30.
The decentralization of political and economic powers from central to local governments has also devolved the delivery of education. Consequently, it is the regional governments’ responsibility to maintain schools, pay teachers’ salaries and collect students’ fees. One of the
29 Samosir, 2008, p.29.
31 main objectives behind decentralization was to improve access to and the quality of education - yet it may actually increase regional differences in educational attainment31. Although local governments account for the bulk of spending on education, they have limited autonomy in the allocation of funds transferred to them by central government, as most investment programs are designed and financed by the central government through grants. In 2003, as a part of the decentralization process, the Education Law set out four major directions:
1. Basic education should be free of all charges;
2. Schools should be given the authority to manage their own programs; 3. Community participation in education should be encouraged;
4. The financing of education should be based on the number of students rather than on the number of schools32.
To solve education issues, especially the school dropouts, government has several main policies that are expected to solve education problems and reduce the number of uneducated children and dropouts. Among those policies are
1. Social assistance programs for education: Bantuan Siswa Miskin (BSM), which provides cash, transfers for poor students. It is first given the government in August 2013. This social assistance is given to reduce the student’s financial burden due to the increase of fuel price in June 22, 2013. Government provides more than 7 trillion to give the Social Scholarships to compensate the raise of fuel price. It was given to 13.5 million needy students.
2. School Operation Grants: Bantuan Operasi Sekolah (BOS) is school-based financial aid. The goals of BOS are to reduce the financial burden for the good-quality nine-year
31 Organisation for Economic Co-operation and Development, 2013, p. 10. 32 Ibid.
32 compulsory education; exempt the financial burden off all students that come from poor family in the public and private schools33; reduce the amount of School Operation Fee that otherwise will be burdened to the student in elementary schools (SD/MI) and junior secondary schools (SMP/MTs), the public and the private.
3. Community Learning Center: Pusat Kegiatan Belajar Masyarakat (PKBM) is a community based organization set up and managed by the community itself for a better community34.
In 2005, the government implemented the School Operational Assistance Program (BOS) in order to increase enrollment rates. This generally successful scheme has helped reduce school costs, so easing the burden on Indonesian households, particularly disadvantaged rural ones35. Moreover, as part of the 2010-14 Medium-Term Development Plan (RPJN) additional support from the regional government budget (APBD) has extended free education to more and more regions. In 2007 - and again as part of RPJN - the government started a conditional cash transfer scheme, the Family Hope program (PKH), to encourage poor households to send their children to school. The PKH was designed specifically to increase enrollment rates by making the nine-year duration of compulsory basic education a reality. In the same year, the government launched another conditional cash transfer program for rural communities, the PNPM Generasi. Under the terms of the program, community funds (BLM) are allotted to villages, with the amount depending on the number of beneficiaries in a village - namely, pregnant women and children under 5 years old or of primary school and junior secondary school age. How the funds are used
33 Ibid.
34 United Nations Educational, Scientific and Cultural Organization Bangkok, p. 2. 35 Organization for Economic Co-operation and Development, 2013, p. 10.
33 is decided by agreement among the villagers, but they must be spent on improving the provision and use of maternal and child health care and basic education services36.
Over half of all provincial and district authorities have attempted to bridge the gap between the School Operational Assistance (BOS) grant that schools receive and their actual operating costs by introducing local school grants (BOSDA). However, BOSDA allocation criteria reinforce patterns of inequality with bigger, better equipped urban schools receiving higher grants than smaller, less well equipped rural schools. Its per-student formula fails to account for differences in operating costs. A school in a remote part of Papua can purchase fewer textbooks and other supplies than a school in Jayapura, the provincial capital, even with the same amount of BOSDA. In addition, electricity usage varies only according to the physical size of the school and the number of classrooms, not the number of students. A per-student formula allocates more to large schools with higher levels of enrollment than smaller schools. Ensuring that smaller schools have enough resources to cover their overheads is a significant issue, because nearly half of all primary schools in Indonesia have fewer than 150 students. The BOS has recently been decentralized to improve it implementation37.
36 Organization for Economic Co-operation and Development, 2013, p. 11. 37 World Bank, 2012, May, p. 6.
34 Decentralization may seem to be beneficial. However, there is concern about the consistency with which national quality standards are being applied at local levels. Due to decentralization, fiscal imbalances are created and participatory budgeting is sometimes failed to improve public spending as well as fiscal imbalances. For example, a study in Purbalingga district of Indonesia, find that after about ten years of decentralization in the country, the district is still heavily dependent on revenue transfer from central government. Local revenue constitutes only about 10% of total budget, mostly from local taxes. Further, rural people are still not satisfied with the spending allocation since only less than 10% of their proposals were accepted by the district government. The portion of expenditure for agriculture, infrastructure, health, education is only about 29% of total budget. There is also concern that funds intended for schools are sometimes diverted to support other local priorities. Most of local budget is spent for salary and other operational cost to serve bureaucracy. Low willingness of the district government to
Figure 2.1. The Government Expenditure on Education in recent years (BPS). The value is represented in % of GDP
35 share information and low political commitment to prioritize community proposals have hindered the effectiveness of public participation38.
Regional governments now play an important role in managing the education system, and school principals exercise far more responsibility as managers than in the past. The government’s total public expenditure on education, and the percentages towards pre-primary, primary, secondary and tertiary education were 0.1%, 39.9%, 41.1% and 18.9% respectively, with the total percentage towards teachers’ salaries being 78.3%. The government of Papua province expends about 5 trillion rupiahs in 2011, while, in comparison, the largest Government expenditure is the capital, The Special Capital Region of Jakarta of over 27 trillion Rupiahs.
38 Sutiyo and Maharjan, 2017, p. 22.
36 The local government policy translates to the local development, which can be measured by human development index (HDI). HDI is a summary measure of average achievement in key dimensions of human development: a long and healthy life, being knowledgeable and have a decent standard of living. The HDI is the geometric mean of normalized indices for each of the three dimensions. The condition of human development, as represented by HDI from the western to the eastern region of Indonesia can be seen in Figure 2.2. The average value of the provinces’ HDI is 72.77. The lowest value of 65.36 corresponds to Papua, the eastern most region of Indonesia, while the highest value of 77.97 corresponds to the capital region, Jakarta. One can also notice that the western regions of Indonesia tend to have higher HDI than the eastern (provinces in Sulawesi, Maluku, Papua and Nusa Tenggara). Although the national quality of human resources is increasing in the recent decade, a clear disparity between eastern and western provinces can still be seen by examining the HDI growth of islands groups. The increase of national human development is also due to the increase of national education quality in recent years.
Although the access to basic education has been steadily improving in Indonesia, the enrollment rates show that disparities in education are still widespread. The urban-rural education gap is apparent from literacy, enrollment rates and attainment levels. For instance, while the illiteracy rate among 15-year-olds and over was just 0.9% in the Capital Region of Jakarta in 2010, the comparable rate in Papua was 31.7%39.
39 Azzizah, 2014, p. 114.
37 In this regard, the regional education quality can be measured by the Net Enrollment Rate (NER) of the respective province. As can be seen in Figure 2.3, there is an inequality in the distributions of NER across the western and eastern region. The attempt to improve education growth through education infrastructure can be seen from the number of teacher. The growth in teacher numbers during the past decade in Indonesia has been spectacular. It is estimated that, since 2004, the number of primary school teachers has increased by 30%, while the number of primary
Figure 2.3. Disparities in enrollment rates increase with the level of education (BPS. Nearly all provinces boast elementary school enrollment rates of over 90%, the only straggler being the predominantly rural province of Papua with an enrollment rate of 76%. Enrollment gaps are wider at junior and senior secondary school level.
38 school students has remained more or less constant. However, the increased student-to teacher ratios are not happening evenly across Indonesia. The major improvements were never beyond Java and Bali areas. Teachers employed in rural and remote regions continue to be the less qualified. Because of the decentralization, the capacity of MOEC to do much about these geographic disparities is limited. Whether the quality of education has improved as a consequence of the improvements in student-to-teacher ratios is now a matter of regional policy concern.
Figure 2.4. Relation of HDI and uneducation rate in western (blue) and eastern (red) Indonesia. Provinces with high HDI tend to have high education rate too. Changes in HDI influence in eastern Indonesia influence its education rate stronger than western region.
39
2.2 Importance of Education for Indonesian Regional Development
In the last two decades, the literature on measurement of disparities has been enormously published, both in Indonesia and international. Disparity between provinces in Indonesia is still severe especially in economic and education aspects. This condition has been the real problem particularly between the Western and the Eastern part of Indonesia. The picture of disparity in education, for example, is obviously seen on the facilities provided in some regions. According to Samosir (2008), it is common to see a primary school with a permanent building, good tables and chairs in Medan (capital city of North Sumatra), while in East Nusa Tenggara the students might have to be satisfied with a school building with old roofs with leakages and limited adequate tables and chairs40.
Looking at the Human Development Index (HDI) of Indonesia Provinces in Figure 2.2 it can be seen that the eastern Indonesia generally has low HDI compared to the western. The lowest value is held by Papua Province since 2005. In 2011, the value in 2011 is 65.36, while the highest HDI among Indonesia Province is the special capital city district of Jakarta at 77.97. The national average Human Development Index is 72.77. HDI of one region are affected by various factors. Here uneducated rate and HDI of the provinces are compared. It is assumed that the HDI of Indonesia provinces can be modeled by following equation,
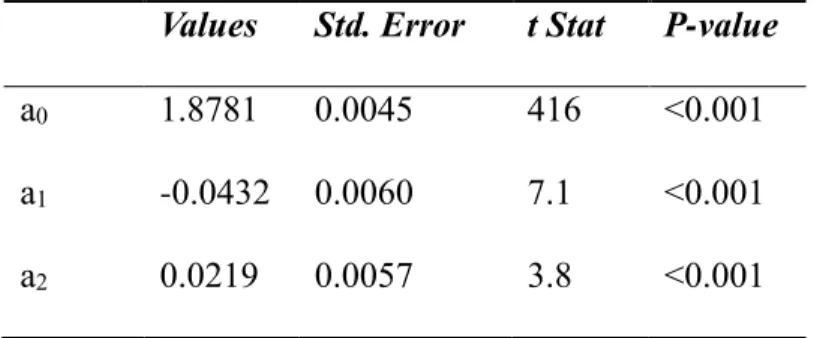
log(HDI) = a0 + (a1 + a2 × EW) × log(UNEDU), (2.1) where UNEDU is the uneducated rate, EW is a dummy variable which have value 1 for western provinces and 0 for the eastern, a0 is a constant, a1 is a coefficient that represent the dependency of HDI to UNEDU, and a2 is a coefficient that represent the east-west disparity. By utilizing regression analysis, those values can be estimated.
40 Samosir, 2008, p.5.
40
Table 2.1. HDI VS Uneducated Rate Regression Coefficient
Values Std. Error t Stat P-value
a0 1.8781 0.0045 416 <0.001 a1 -0.0432 0.0060 7.1 <0.001 a2 0.0219 0.0057 3.8 <0.001
The equation can be illustrated in the following Figure 2.4. The low value of P-value indicates that there is indeed a gap between western and eastern Indonesia. By reducing uneducated rate into half of its value the HDI of western provinces will increase by 2.8%, while it will increase the HDI of eastern provinces by 1.4%. Any change in uneducated rate will affect the development of eastern province more than it affects its western counterparts41.
2.3. Relation between Regional Education and Socio - Economy Condition
This section discusses the gap of socio economy condition relation to education between western and eastern Indonesia. In order to appropriately estimate the relations, a vast amount of time series data over a sufficiently long period is required. Since the data availability in a developing country is not in favor of that, some alternative means of analyzing the data is utilized here. Therefore, a panel data with provinces as unit of observations is employed. This approach is similar to the approach employed by Suryahadi (2009), which itself was inspired by the work of
41 Azzizah, 2015, p. 222.
41 Ravallion and Datt (1998)42. Moreover, by analyzing it in such way, the regional gap of education and socio-economy factors can be determined. The model can be written in the following equation43:
NER = d0 + (d1 + d2 × EW) × POOR (2.2)
NER = e0 + (e1 + e2 × EW) × log GDPG (2.3)
log(NER) = f0 + (f1 + f2 × EW) × GINI (2.4)
Where NER represents the net school enrollment ratio of the people in a province up to the SD/MI/Paket A level, which is equivalent to elementary school. POOR is the poverty rate in the province, GDPG is the regional GDP growth rate of the province; GINI is the gini index of the province. Beside these three variables, variable EW is included, which is a dummy variable that gives a value of 1 for western provinces and 0 for the eastern provinces. d0, e0, f0 are constants, d1, e1, and f1 are coefficients that represent the dependency of NER to, POOR, GDPG, and GINI respectively, and d2, e2, and f2 are coefficients that represent the east-west disparity. In this model, there are three independent variables: POOR, GDPG and GINI. Net enrollment ratio (NER) is set as a dependent variable.
As noticed in the model, each of the three variables (POOR, GDP growth, and GINI) are put in separate models for separate estimations to evaluate the effects of each the poverty rate (POOR), regional economic developments (measured by regional GDP growth) and the income inequality (measured by gini index) separately on the school enrollment ratio in the province. This is similar to the treatment of variables in Suryahadi, et. al. (2009), in which they put various measures of sectoral economic growth rates in separate models so that those can be evaluated
42 Suryahadi, 2009, p.110. 43 Azzizah, 2015, p. 226.
42 separately. The coefficients d0, d1, d2, e0, e1, e2, f0, f1, f2 are estimated using regression analysis. The result can be seen in the following table
Table 2.2. Result of regression of socio-economy variable's coefficients.
Values Std. Error t Stat P-value
d0 97.6 1.3 77 <0.001 d1 -0.420 0.084 -4.9 <0.001 d2 0.323 0.087 3.7 <0.001 e0 85.7 2.5 34 <0.001 e1 7.65 2.76 2.8 0.01 e2 5.7 1.6 3.6 <0.001 f0 2.026 0.039 52 <0.001 f1 -0.162 0.09 -1.7 0.11 f2 0.052 0.019 2.7 0.01 2.3.1. Poverty rate
Based on the above table, it can be seen that all p-values are small, leading us to conclude that significant differences in the model exist between provinces in the east group and west group. The school enrollment ratios in east group provinces are significantly lower than the ratios in the west group. For the variable POOR, the negative sign of a1 indicates that the change of poverty ratios will increase the NER. However, since |d1|>|d1+d2| the NEC of eastern province will increase significantly more than the eastern provinces. When POOR growth by 1 point, NER of east Indonesia will drop 0.420 point, on the other hand, NER of west Indonesia will drop only 0.097. This result implies that the poverty rate has a rather huge influence on the rate of school enrollment, particularly the eastern provinces. One thing that can be inferred from this relationship is the bigger the poverty rate in a province is, the harder it is for its families to afford
43 school, thus lowering the enrollment rate. Poverty should be seen as a situation filled with various deprivations due to a lack of empowerment and command over resources.
2.3.2. GDP growth
Next is the GDP growth. Although it is known that poorer provinces tend to have lower nominal regional GDP and higher growth rate on its regional GDP than its much wealthier neighbors, the positive sign of c1 suggest that the growth rate of regional GDP will increase NER. However, since |e1|<|e1+e2| GDP growth will influence the growth of NER in western provinces more than the eastern provinces. If GDPG become twice, NER of east Indonesia will increase by 2.3 point, on the other hand, NER of west Indonesia will increase 4.0 point. Overall, there are disparity issues in both the education and socio-economic conditions between the provinces in east group and west group. It means that observing equality through income alone is extremely inadequate. Income information does not inform of the dynamics of life expenses and the feeling of financial security.
2.3.3. Gini index
Lastly, the Gini index measures the degree of income inequality between the rich and the poor, in which a bigger amount means higher income inequality or wider gap between the rich and the poor. The negative sign of the f1 in variable GINI leads us to conclude that the growth of income inequality will reduce NER in the east group provinces are less that in the west group provinces. The relatively large value of b1’s P indicates that it is statistically less significance in influencing the rate of school enrollment ratio. Even though the relationship is not significant, it
44 is found that there is a gap between western and eastern provinces. Since |f1|>|f1+f2|, the change of income equality will affect NER of eastern province more than the western province. The increase of GINI by 1 point will decrease NER of eastern Indonesia by 31%, on the other hand NER of western Indonesia will be decreased by 22%. The fact that the growth of Gini has less significant influence on school enrollment than the others may also imply that having equality in economy, which in this case, can be represented by income equality i.e. low Gini index, does not necessarily mean the education level in that particular province will also be good. People may have equal income, but equally poor, in this case good education will be hard to achieve. Thus, the income equality has no affected whatsoever in the school enrollment ratio.
The regional disparity in education across Indonesia region is as apparent as its human development disparity. Western Indonesia has better education and human development than Eastern Indonesia. The regional education level is closely related to its socio -economic issues. Among the three socio-economic factors, poverty rate is the most relevant factor. In the following chapters, when discussing about the relation between education and socio-economy quality, the focus is on the poverty rate. While the poverty influences the education level on a region, the effect felt by female population is different to the male counterpart. Next chapter discusses this kind of gender gap on the Indonesia education.
45
CHAPTER 3. GENDER GAP IN EDUCATION IN INDONESIA
Indonesia ranked 95th on the list of 136 countries in 2013 Global Gender Gap (GGG) below the Philippines, Cuba, Lesotho, Mozambique, the poorest country Malawi, Sri Lanka, Laos, Vietnam and Armenia. Despite a slight improvement of two places since 2012 but eight places down since 2010, Indonesia received an overall score of 0.6613 in 2013. In ASEAN, Indonesia lags behind the Philippines (ranked fifth), Singapore (58), Laos (60), Thailand (65), Vietnam (73) and Brunei (88). Indonesia even lags behind at least 13 African countries in gender parity. “Indonesia moves up two places in the rankings. Decreases on the Educational Attainment sub index are offset by improvements on the Economic Participation and Opportunity sub index and the Political Empowerment sub index,” the report cited. The government claims it had good planning in place to narrow the gender gap but faced problems in its implementation44.
Figure 3.1.Indonesia rank in 2013 GGG (Global Gender Gap) index45.
44 Anjaiah, 2013, October (para 9). 45 Ibid.
46 The 1993 Guidelines of State Policy of Indonesia indicated that education, particularly formal education, in Indonesia has been the national government's priority for development since the implementation of the Second- Five Year Development Plan (Repelita II) from 1974/1975 to l978/l979. With the objectives of improving the standard of living and creating more employment opportunities, education has been strongly promoted for school-age children. As ascertained by the improved rates of literacy46. Indonesia implemented six years of compulsory education in 1984, which was then extended to nine years in 1994. As a result, primary school attendance from has increased from 55 percent in 1975 to 87 percent in 1985 47 and up to more than 90 percent in 201248. The development of female education has still lagged behind in percentage than the male education49. As shown in the table 3.1
Table 3.1. Provinces with large illiteracy rate and illiteracy rate gap in Indonesia (BPS)..
Male (%) Female (%) Province 2009 2010 2011 2009 2010 2011 Yogyakarta 4.33 3.80 3.38 13.42 12.77 11.81 East Jawa 6.31 6.51 6.06 15.35 14.39 14.41 B a l i 6.33 6.37 4.88 16.54 14.64 14.60 West NusaTenggara 10.99 12.06 9.87 22.49 20.60 18.69 P a p u a 23.07 25.70 28.12 32.76 33.85 40.19 46 Prasilowati, 2000, p.1 . 47 Ibid. 48 BPS, 2017 (para 1). 49 Hill and King. 1993, p. 9.