Clinical Impact of Undersized- versus Oversized-Stenting Approaches in ST-Elevation Myocardial Infarction
Sakura Nagumo, MD*, Kohei Wakabayashi, MD, PhD*, FACC, Miki Tsujiuchi, MD*, Chisato Sato, MD*, Takenori Yamauchi, DVM, PhD†, Toshio Nakadate, MD, PhD†, Hiroshi Suzuki, MD, PhD*
Department and institutions:
*Division of Cardiology, Showa University Fujigaoka Hospital, Yokohama, Kanagawa, Japan 1-30 Fujigaoka, Aoba district, Yokohama city, Kanagawa prefecture, Japan, Zip 227-8501
†Department of Hygiene and Preventive Medicine, School of Medicine, Showa University, Japan 1-5-8 Hatanodai, Shinagawa district, Tokyo, Japan, Zip 142-8666
Corresponding author: Kohei Wakabayashi
1-30 Fujigaoka, Aoba district, Yokohama city, Kanagawa prefecture, Japan, Zip 227-8501 Email address: [email protected]
Telephone: +81 45 971 1151; Fax: +81 45 974 4641
Acknowledgement of grant support: None Disclosure: None
Abstract
Background Primary percutaneous coronary intervention (PCI) is the standard treatment in patients with ST-elevation myocardial infarction (STEMI). However, some patients still develop ST re-elevation during PCI, resulting in further myocardial damage and a poor outcome. An undersized-stenting approach may prevent ST re-elevation. We aimed to determine the association between final stent area and ST re-elevation during primary PCI for STEMI.
Methods Overall, 102 consecutive STEMI patients who underwent primary PCI under integrated backscatter intravascular ultrasound guidance were enrolled. The stent–reference (SR) ratio was defined as the stent cross-sectional area (CSA) divided by the average CSA of the 5-mm proximal and distal reference lumens. The patients were divided into two groups according to the SR ratio:
undersize group (SR < 1.0, n = 62) and oversize group (SR ≥ 1.0, n = 40). The incidences of ST re-elevation and total ST resolution (STR) were compared.
Results The oversize group showed a higher incidence of ST re-elevation (32.5 vs. 9.7%, p = 0.004) and a lower total STR (22.4 ± 62.7 vs. 43.4 ± 38.6%, p = 0.04). After adjustment, the oversized-stenting approach was independently associated with ST re-elevation [odds ratio: 3.74, 95% confidence interval (CI) 1.27–12.1, p = 0.02]. The peak creatine kinase-MB level was higher in the oversize group (341 ± 259 vs. 242 ± 208 IU/l, p = 0.04). The incidences of stent thrombosis and restenosis were similar between the two groups.
Conclusions An oversized-stenting approach in patients with STEMI was associated with a higher incidence of ST re-elevation and a lower total STR, resulting in increased myocardial damage.
Key words: undersized-stenting approach; intravascular ultrasound; ST-elevation myocardial infarction; primary percutaneous coronary intervention
Introduction
Primary percutaneous coronary intervention (PCI) is the gold standard treatment in patients with ST-elevation myocardial infarction (STEMI) (1). However, STEMI patients sometimes show ST re-elevation after primary PCI, resulting in major myocardial damage and poor outcomes. Many studies have attempted to resolve this limitation of primary PCI; however, the problem still persists and the issue has attracted attention for decades. The mechanical effect of stent deployment causes distal embolization induced by liberated plaque debris (1). Inadequate stent size may play a role in distal embolization or adverse events in STEMI patients; however, previous studies have not addressed the clinical effect of final stent size. Thus, there is still no guidance with respect to the final stent size during primary PCI, and it is always left to the operator’s discretion. An undersized-stenting approach may reduce distal embolization but may also cause stent thrombosis or restenosis. In contrast, an oversized-stenting approach may increase distal embolization but may reduce the incidence of stent thrombosis or restenosis. ST re- elevation and ST resolution (STR) are reliable markers of subsequent myocardial damage in STEMI (2) and are strongly associated with clinical outcomes (3-6). We hypothesized that the final stent size, simply expressed as the ratio of stent area to reference lumen area (SR), would be associated with ST re-elevation and STR. The present study was conducted to assess the relationship between the SR ratio, ST re-elevation, and STR during primary PCI in STEMI patients.
Methods
Study protocol and patient enrollment
Our prospective acute coronary syndrome (ACS) registry was started in May 2011 and included all ACS patients who were admitted to Showa University Fujigaoka Hospital. Data in the present registry were collected from each case report and included complete details of the following: vital
status, physical examination, medical history, complications, biochemistry tests, echocardiography, drugs at admission, drugs at discharge, in-hospital treatment, outcomes, and other data. The registry included a total of 681 ACS patients registered between May 2011 and May 2015. Intravascular ultrasound (IVUS) was routinely used during this period. Of the total cases, 197 consecutive STEMI patients who underwent primary PCI were screened. The inclusion criteria for the present study were as follows: 1) primary PCI was attempted within 24 h of symptom onset; 2) ongoing chest pain; and 3) >0.1 mV ST-segment elevation from baseline in at least two contiguous leads on the 12-lead electrocardiogram (ECG). The exclusion criteria were as follows: 1) cardiopulmonary arrest; 2) a history of coronary artery bypass grafts; 3) left main trunk artery lesion; 4) restenosis lesion; 5) PCI without stenting; 6) more than 2 stents deployed;
7) no paired IVUS data with adequate quality before and after stent dilatation; and 8) ECG data inadequate to measure ST re-elevation.
All patients provided informed consent for the IVUS-guided primary PCI. The present study was reviewed and approved by the local institutional review board, and the study complied with the Declaration of Helsinki. All definitions, including coronary risk factors and cardiovascular events, conformed to the 2008 Key Data Elements and Definitions for Cardiac Imaging and Clinical End Points in Coronary Stent Trials compiled by the ACC/AHA/ACR/ASE/ASNC/HRS/NASCI/RSNA/SAIP/SCAI/SCCT/SCMR/SIR (7,8).
Primary PCI and IVUS procedure
All patients were given 200 mg of aspirin and 300 mg of clopidogrel (or 20 mg of prasugrel) immediately after the diagnosis of STEMI. These doses followed the guidelines of the Japanese Circulation Society (9). In the catheterization laboratory, an intravenous injection of 10 IU/kg heparin was given to maintain an activated clotting time of ≥300 s during the PCI procedure.
Glycoprotein IIb/IIIa inhibitors were not used because they have not been approved in Japan. All patients underwent an IVUS examination using a 43-MHz integrated backscatter IVUS (IB-
IVUS) catheter (View It, Terumo Co., Japan) immediately after wire crossing or thrombectomy.
After administration of 2–3 mg of isosorbide dinitrate, continuous ultrasound images were acquired from the distal to the proximal segment of the lesion at an automated constant pullback rate of 0.5 mm/s. Decisions on thrombectomy, type of stent, stent diameter and length, pressure during deployment, and pre- and/or post-dilatation were left to the operators. The incidences of reperfusion injury defined as no-reflow phenomenon or arrhythmia during PCI (10) were assessed. A final IVUS study was routinely performed at the end of the procedure. The incidence of no-flow, slow-flow, and side branch loss were assessed by angiography during PCI. When the patients showed no-flow or slow-flow phenomena, standard treatment such as additional aspiration and vasodilation were performed at the operator's discretion.
IVUS measurement and data analysis
All IVUS imaging data were stored in the console (VISIWAVE; Terumo Co., Japan). For offline analysis, digital copies of the IVUS images were saved on hard disk drives. The tissue characteristics of plaque were analyzed with an offline computer-based software system (VISIATLAS; Terumo Co., Japan). A quantitative analysis of the IVUS data was performed according to the American College of Cardiology’s clinical expert consensus document (11).
The external elastic membrane and lumen cross-sectional area (CSA) were measured every 1 mm to assess the culprit lesion. Plaque area was calculated as external elastic membrane CSA minus lumen CSA. The volumes of the external elastic membrane, lumen, and plaque were calculated using Simpson’s rule. The volume index of each tissue (mm3/mm) was calculated as each tissue volume divided by the lesion length.
The analysis of the stents was performed by experienced analysts who were unaware of the angiographic findings and lesion characteristics, using a computer-based system
(EchoPlaque 4.0; INDEC Systems, Inc., Santa Clara, California, USA). The CSAs of the external elastic membrane and lumen were measured in the proximal and distal reference segments, defined as 5 mm from the proximal and distal stent edges. When a significant side branch (with vessel diameter >2 mm) was observed, the reference segment was closer than 5 mm to the stent edge. The average of the CSA measurements in the 5-mm proximal and distal reference segments was recorded as the average reference CSA. The stent CSA was measured every 1 mm, and the stent volume was calculated using Simpson’s rule. The stent area used for the SR ratio was measured at the segment with plaque rupture or the minimum CSA of the culprit lesion because plaque debris from the culprit lesion can cause distal embolism (12). The SR ratio was defined as the stent CSA in the culprit lesion divided by the averaged reference CSA (Figure 1). SR ratios using the minimum and maximum stent CSA and the stent volume/reference ratio were also assessed in relation to ST re-elevation. The stent volume index (mm3/mm) was calculated as stent volume divided by stent length.
The patients were divided into two groups according to the mean SR ratio. Plaque protrusion was defined as tissue extrusion through the stent after deployment, and stent malposition was defined as stent struts clearly separated from the vessel wall, with the presence of blood speckles behind the struts.
ECG measurements and cardiac enzyme analyses
A 12-lead ECG was recorded continuously during the PCI procedure and stored on CD-ROMs for offline analysis. STR was assessed before the procedure and immediately after the final IVUS study, according to methods described previously (13). The ST-segment elevation in each lead at 40 ms after the end of the QRS wave was measured to the nearest 0.1 mm using digital calipers, with the TP segment as baseline. ST-segment elevation was measured in all leads except lead aVR, irrespective of the infarction area. Significant ST-segment re-elevation was defined as an
increase of >2 mm in the ST-segment score. Total STR was defined as the percentage reduction in the summed score between pre- and post-procedure.
Blood samples were obtained on admission, immediately after PCI, and at 4-h intervals until creatine kinase (CK)-MB reached a peak value.
Angiographic analysis
Coronary angiography was performed with a frame rate of 15/s. The thrombolysis in myocardial infarction (TIMI) flow grade was assessed as described previously (14). The corrected TIMI frame count in the infarct-associated artery was estimated during the final coronary angiography (15). When the TIMI flow grade was 0 or 1 on final angiography, the corrected TIMI frame count was deemed to be 100 (16). Collateral vessels were graded according to the Rentrop classification:
0 = no filling of collateral vessels; 1 = filling of collateral vessels without any epicardial filling of the artery to be dilated; 2 = partial epicardial filling of the artery to be dilated by collateral vessels; and 3 = complete epicardial filling of the artery to be dilated by collateral vessels (17).
Left ventricular ejection fraction measurement
The left ventricular ejection fraction on admission was measured by ultrasound echocardiography.
The strategy for measuring left ventricular ejection fraction, such as Teichholz, modified Simpson, or eyeball, was left to the physician’s discretion.
Outcomes
The primary endpoint was the presence of ST re-elevation after primary PCI (13). The secondary outcome was peak CK-MB and a composite endpoint of major adverse cardiovascular events, including cardiovascular death, non-fatal myocardial infarction, stent thrombosis, target lesion revascularization (TLR), and target vessel revascularization (TVR). Cardiovascular death was
defined as death caused by cardiovascular disease or documented as sudden cardiac death. Non- fatal myocardial infarction was defined as the presence of lasting chest pain, >0.1 mV ST-segment elevation from baseline in at least two contiguous leads on the 12-lead ECG, with no death before the follow-up day. Information on adverse events was acquired by interviewing the patients during the follow-up period. TLR was defined as repeat revascularization within the stent or within the 5-mm borders proximal and distal to the stent. TVR was defined as repeat revascularization within the treated coronary artery. Stent thrombosis was defined as “definite stent thrombosis,” according to the Academic Research Consortium criteria, as the presence of a thrombus originating in the stent or in the segments 5-mm proximal or distal to the stent, with chest pain or new ischemic ECG change (8).
Statistical analysis
Quantitative variables were presented as mean ± standard deviation, and categorical variables were presented as percentages. Continuous variables were compared with the Student t test, and Fisher’s exact or chi-square tests were used for categorical data, as appropriate. Receiver- operating characteristic (ROC) analysis was used to determine the optimal cutoff value of the final stent size for the prediction of ST re-elevation after stent deployment. The cutoff point was defined as the greatest sum of the sensitivity and specificity estimates. To identify independent factors of ST re-elevation after PCI, the following variables were subjected to univariate analysis:
age, gender, body mass index, diabetes mellitus, dyslipidemia, smoking, systolic blood pressure, symptom-to-balloon time, left ventricular ejection fraction on admission, left anterior descending artery lesion, right coronary artery lesion, baseline TIMI flow grade, total plaque volume, calcification volume, dense fibrosis volume, fibrosis volume, lipid pool volume, thrombectomy, stent length and diameter, post-dilatation, maximum inflation pressure during stent implantation and post-dilatation, averaged reference CSA, and SR ratio ≥1.0. The variables with a p-value <0.1 on the univariate analysis were entered into the multivariate analysis. When factors correlated
with each other, one was deleted. All p-values <0.05 were considered statistically significant.
Statistical analyses were performed using JMP Pro 11 (SAS Institute Inc., Cary, North Carolina, USA).
Results
Of the 197 consecutive STEMI patients, the following were excluded from the present study: 12 patients suffered cardiopulmonary arrest, 1 patient had a history of coronary artery bypass grafts, 2 patients had left main trunk artery lesions, 7 patients had restenosis lesions, 3 patients underwent revascularization without stenting, and 30 patients received more than two stents. Paired IVUS studies with adequate quality before dilatation and post-stent implantation were not available for 39 patients. In one patient, it was impossible to measure the total STR because of recording issues.
Thus, 102 patients were included in this analysis. The mean SR ratio was 0.99, and the median was 0.93. The patients were divided into two groups: the oversize group, SR ratio ≥1.0 (n = 40) and the undersize group, SR ratio <1.0 (n = 62).
Baseline characteristics were similar between the two groups (Table 1), except for systolic blood pressure on admission. Angiographic characteristics and IB-IVUS measurements of the culprit lesion are shown in Table 2. Right coronary artery disease was more common in the undersize group. There were no differences in total plaque volume and tissue characteristics between the two groups. The percentages and volume index of each tissue were similar (Supplemental data). The PCI procedure was similar between the undersize and oversize groups (Table 3). The incidence of reperfusion injury was similar between the two groups (undersize group vs. oversize group, 4.8% vs. 5.0%, p = 0.97). The average reference CSA was larger in the undersize group and did not depend on the target vessel. A comparison of the ECG analysis and other markers is presented in Table 4. The incidence of ST re-elevation was significantly higher and total STR was lower in the oversize group. In the evaluation of each vessel, the incidence of ST re-elevation tended to be higher in the oversize group in left anterior descending artery (LAD)
lesions (undersize group vs. oversize group 17.9% vs. 42.3%, p = 0.07), whereas there was no difference in right coronary artery (RCA) (undersize group vs. oversize group 3.5% vs. 12.5%, p
= 0.39) or left circumflex artery lesions (undersize group vs. oversize group 0% vs. 14.3%, p = 0.99). The oversize group had a higher peak CK-MB level. There were no differences between the two groups in the incidence of death (undersize vs. oversize group, 9.7% vs. 2.5%, p = 0.24), non-fatal myocardial infarction (3.2% vs. 2.5%, p = 0.99), TLR (6.5% vs. 15.0%, p = 0.18), TVR (6.5% vs. 17.5%, p = 0.10), and stent thrombosis (3.2% vs. 2.5%, p = 0.99). Of 10 patients who underwent TLR, 5 received drug-eluting stents (DES) and 5 were treated with bare-metal stents (BMS).
The ROC curve showed that 1.01 was the optimal threshold of the SR ratio for predicting ST re-elevation, with a sensitivity of 68.4% and a specificity of 67.5% (Figure 2). The area under the curve was 0.64.
In univariate analysis, the following variables were associated with ST re-elevation with p value of <0.1, SR ratio ≥1.0 [odds ratio: 4.49, 95% confidence interval (CI) 1.60–14.0, p
= 0.006], age (odds ratio: 0.96, 95% CI 0.92–1.00, p = 0.08), LAD (odds ratio: 6.32, 95% CI 1.93–28.6, p = 0.006), and calcification volume (odds ratio: 0.83, 95% CI 1.65–1.04, p = 0.09).
Diabetes mellitus, dyslipidemia, total plaque volume, lipid pool volume, and maximum inflation pressure during stent implantation and post-dilatation were not associated with ST re-elevation in univariate analysis. An SR ratio of ≥1.0 (odds ratio: 3.74, 95% CI 1.27–12.1, p = 0.02) and LAD (odds ratio: 5.34, 95% CI 1.57–24.7, p = 0.006) were associated with ST re-elevation in the final multivariate analysis.
Discussion
In this study, we assessed the effect of stent size, represented by SR ratio, on ST re-elevation and total STR in patients undergoing primary PCI for STEMI.
The major novel findings of this study were as follows: 1) an oversized-stenting approach (SR ratio ≥1.0) was strongly associated with ST re-elevation and lower total STR; 2) ROC analysis showed that the best cutoff value of the SR ratio for predicting ST re-elevation was 1.01; 3) the peak CK-MB level was also higher in the oversize group; and 4) the safety endpoint, assessed as the incidence of stent thrombus, TVR, and TLR, was similar between the two groups.
Factors associated with ST re-elevation and poor STR
The few studies that have assessed the predictors of ST re-elevation or STR using IVUS did not evaluate the effect of final stent size. Those studies suggested that certain factors, such as total plaque (18), necrotic core (13, 18), and dense calcium volume (19), were associated with ST re- elevation (13) or poor STR (18, 19); however, the results were not consistent among the studies.
They were also not consistent with the results of the present study. The use of different techniques, such as virtual histology and IB-IVUS, may affect the results of investigations of the influence of tissue characteristics on ST re-elevation. Even after undergoing thrombectomy, some patients still have a large thrombus. The analysis of thrombus by either virtual histology or IB-IVUS has not yet been validated. Thus, any analysis that includes thrombus is inaccurate. These are plausible explanations for the inconsistent results of studies with respect to tissue characteristics. After adjustment for confounding variables, tissue characteristics were not associated with ST re- elevation and total STR in the present study. Only one study suggested that total plaque volume was associated with STR (18). Differences in PCI strategy, aspiration devices, and methods of analysis—for example measurement of STR after 60 min—could explain the inconsistent results.
The present study found that final stent area was associated with ST re-elevation and total STR. Our results suggest that mechanical stimulation by stent deployment is more important than total plaque volume and tissue characteristics. A not-oversized-stenting approach could be a novel strategy for avoiding ST re-elevation and poor STR, which can result in further myocardial damage.
After adjustment, LAD was still associated with ST re-elevation. LAD generally has a large blood perfusion region. This characteristic may account for ST re-elevation in common in LAD rather than RCA by distal embolization.
Previous literature on stent size
Distal embolization is mostly caused by the mechanical liberation of plaque debris after stent deployment; however, little information about the influence of final stent size on myocardial damage in STEMI is available.
Hong et al. (20) reported that undersized-stent deployment resulted in a lower incidence of distal embolization and prevented CK-MB elevation in patients who underwent PCI for saphenous vein graft lesions. The native coronary lesions in STEMI are different from those in a saphenous vein graft; however, both lesions have similar issues, i.e., soft plaque, including rich thrombus and a lipid core, causing distal embolism (21). Thus, undersized-stent deployment may prevent distal embolism not only in saphenous vein graft lesions but also in cases of ruptured plaque in STEMI.
Post-dilatation after stent implantation or high-pressure inflation may be harmful in STEMI patients (22, 23). It is possible that the stent size is larger after post-dilatation or high- pressure inflation, with the oversized stent resulting in distal embolism in some STEMI patients.
These reports support our findings that final stent size may exert a clinical effect in STEMI patients. In the present study, neither the maximum inflation pressure nor post-dilatation was significant in univariate analysis. Post-dilatation or high-pressure inflation may be safe under adequate IVUS guidance. Accordingly, the final stent size appears to be a more important factor in relation to ST re-elevation than post-dilatation or high-pressure inflation.
Undersized- vs. oversized-stenting approach in STEMI
The results of the present study indicate that an oversized-stent (SR ratio ≥1.0) causes ST re- elevation. The area under the curve in ROC analysis was not large, suggesting patient-to-patient variability. The amount of thrombus, calcification, lipid pool, and total ischemic time and the timing or effect of medication may be strongly associated with ST re-elevation in some patients.
However, the results showed that a not-oversized-stenting approach prevented ST re-elevation in general.
The average reference CSA was larger in the undersize group (Table 3). A similar tendency was observed in a previous study of saphenous vein grafts (20). Some patients have the culprit lesion in a very large vessel, and it is generally easy to achieve a sufficient gain of lumen CSA, even using a small stent compared with the vessel diameter, which is probably the main reason why the average reference CSA was larger in the undersize group. Although the average reference CSA differed between the groups, it was not associated with ST re-elevation in univariate analysis.
We evaluated the SR ratio in volume analysis also. A similar tendency was observed, but the difference was less than that in the SR ratio at the culprit lesion. Liberation of plaque debris may occur mostly from the culprit lesion segment, and this may be the reason why analysis using the SR ratio at the culprit lesion predicts ST re-elevation more accurately than the analysis of the volume index over the entire stent segment. Volume analysis takes time and cannot be performed during a primary PCI procedure. Accordingly, simple measurements and calculation of the SR ratio at the culprit lesion are more accurate and useful for deciding final stent area size.
The undersized-stenting approach group also showed superior results with respect to the secondary endpoint, peak CK-MB level. The large total STR following the undersized- stenting approach resulted in less myocardial damage. The long-term outcomes were similar
between the undersize and oversize groups in the present study, possibly because of the small sample size; however, a not-oversized-stenting approach may increase myocardial salvage.
Safety concerns with the undersized-stenting approach
It should be noted that the undersized-stenting approach is entirely different from so called “stent under-expansion,” defined as minimum stent area <5 mm2 (24), or failure to achieve a minimum in-stent dimension greater than 80% of the average reference segment diameter (25). In the present study, routine IVUS-guided PCI avoided extreme stent under-expansion resulting in stent thrombosis. Furthermore, the incidence of TLR was similar between the undersize and oversize groups. An undersized-stenting approach may confer benefits without safety concerns when performed under optimal IVUS guidance.
Study limitations
This study had several limitations. First, it was of a single-center prospective registry and the sample size was relatively small. The number of events was also small, leading to limitations for multivariable analysis. Further multi-center, randomized trials will be needed to confirm the results. Second, although the difference between BMS vs. DES was assessed, specific stent types, such as sirolimus, paclitaxel, zotarolimus, and everolimus, were not evaluated. Differences in stent design may be associated with the incidence of TLR and TVR and an increase in serum CK- MB level after PCI (26-28). Third, the treatment strategy was left to the physicians’ discretion.
This practice may have introduced a bias that was not completely eliminated, even after adjustment for confounding variables. Fourth, glycoprotein IIb/IIIa inhibitors were not used in this study, because they are unavailable in Japan.
Conclusions
An oversized-stenting approach in patients with STEMI was associated with a higher incidence
References
1. Grines, C.L., Cox, D.A., Stone, G.W., Garcia, E., Mattos, L.A., Giambartolomei, A. et al, Coronary angioplasty with or without stent implantation for acute myocardial infarction. Stent Primary Angioplasty in Myocardial Infarction Study Group. N Engl J Med. 1999;341:1949-1956.
2. Santoro, G.M., Valenti, R., Buonamici, P., Bolognese, L., Cerisano, G., Moschi, G. et al, Relation between ST-segment changes and myocardial perfusion evaluated by myocardial contrast echocardiography in patients with acute myocardial infarction treated with direct angioplasty. Am J Cardiol. 1998;82:932-937.
3. McLaughlin, M.G., Stone, G.W., Aymong, E., Gardner, G., Mehran, R., Lansky, A.J. et al, Prognostic utility of comparative methods for assessment of ST-segment resolution after primary angioplasty for acute myocardial infarction: the Controlled Abciximab and Device Investigation to Lower Late Angioplasty Complications (CADILLAC) trial. J Am Coll Cardiol.
2004;44:1215-1223.
4. Dizon, J.M., Brener, S.J., Maehara, A., Witzenbichler, B., Biviano, A., Godlewski, J. et al, Relationship between ST-segment resolution and anterior infarct size after primary percutaneous coronary intervention: analysis from the INFUSE-AMI trial. Eur Heart J Acute Cardiovasc Care. 2014;3:78-83.
5. van 't Hof, AW., Liem, A., de Boer, M.J., Zijlstra, F. Clinical value of 12-lead electrocardiogram after successful reperfusion therapy for acute myocardial infarction. Zwolle Myocardial infarction Study Group. Lancet. 1997;350:615-619.
6. Schroder, R., Dissmann, R., Bruggemann,T., Wegscheider, K., Linderer, T., Tebbe, U.
et al, Extent of early ST segment elevation resolution: a simple but strong predictor of outcome in patients with acute myocardial infarction. J Am Coll Cardiol. 1994;24:384-391.
7. Hendel, R.C., Budoff, M.J., Cardella, J.F., Chambers, C.E., Dent, J.M., Fitzgerald, D.M.
et al, ACC/AHA/ACR/ASE/ASNC/HRS/NASCI/RSNA/SAIP/SCAI/ SCCT/SCMR/SIR 2008 Key Data Elements and Definitions for Cardiac Imaging: A Report of the American College of Cardiology/American Heart Association Task Force on Clinical Data Standards (Writing Committee to Develop Clinical Data Standards for Cardiac Imaging). Circulation. 2009;119:154- 186.
8. Cutlip, D.E., Windecker, S., Mehran, R., Boam, A., Cohen, D.J., van Es, G.A. et al, Clinical end points in coronary stent trials: a case for standardized definitions. Circulation.
2007;115:2344-2351.
9. Guidelines for the management of patients with ST-elevation myocardial infarction (JCS 2008). Circ J 2008; 72 Suppl IV: 1444-64.
10. Yellon, D.M., Hausenloy, D.J. Myocardial Reperfusion Injury. N Engl J Med 2007; 357:
1121-35.
11. Mintz, G.S., Nissen, S.E., Anderson, W.D., Bailey, S.R., Erbel, R., Fitzgerald, P.J. et al, American College of Cardiology Clinical Expert Consensus Document on Standards for Acquisition, Measurement and Reporting of Intravascular Ultrasound Studies (IVUS). A report of the American College of Cardiology Task Force on Clinical Expert Consensus Documents. J Am Coll Cardiol. 2001;37:1478-1492.
12. Tanaka, A., Kawarabayashi, T., Nishibori, Y., Sano, T., Nishida, Y., Fukuda, D. et al, No-reflow phenomenon and lesion morphology in patients with acute myocardial infarction.
Circulation. 2002;105:2148-2152.
13. Kawaguchi, R., Oshima, S., Jingu, M., Tsurugaya, H., Toyama, T., Hoshizaki, H. et al, Usefulness of virtual histology intravascular ultrasound to predict distal embolization for ST- segment elevation myocardial infarction. J Am Coll Cardiol. 2007;50:1641-1646.
14. The Thrombolysis in Myocardial Infarction (TIMI) trial. Phase I findings. TIMI Study
15. Gibson, C.M., Cannon, C.P., Daley, W.L., Dodge, J.T.Jr., Alexander, B.Jr., Marble, S.J.
et al, TIMI frame count: a quantitative method of assessing coronary artery flow. Circulation.
1996;93:879-888.
16. Endo, M., Hibi, K., Shimizu, T., Komura, N., Kusama, I., Otsuka, F. et al, Impact of ultrasound attenuation and plaque rupture as detected by intravascular ultrasound on the incidence of no-reflow phenomenon after percutaneous coronary intervention in ST-segment elevation myocardial infarction. JACC Cardiovasc interv. 2010;3:540-549.
17. Rentrop, K.P., Cohen, M., Blanke, H., Phillips, R.A. Changes in collateral channel filling immediately after controlled coronary artery occlusion by an angioplasty balloon in human subjects. J Am Coll Cardiol. 1985;5:587-592.
18. Ohshima, K., Ikeda, S., Kadota, H., Yamane, K., Izumi, N., Ohshima, K. et al, Impact of culprit plaque volume and composition on myocardial microcirculation following primary angioplasty in patients with ST-segment elevation myocardial infarction: virtual histology intravascular ultrasound analysis. Int J Cardiol. 2013;167:1000-1005.
19. Nakata, T., Fujii, K., Fukunaga, M., Kawasaki, D., Kawabata-Lee, M., Masutani, M. et al, The impact of plaque characterization assessed by intravascular ultrasound on myocardial perfusion after primary angioplasty in patients With ST-segment elevation myocardial infarction.
Circ J. 2011;75:2642-2647.
20. Hong, Y.J., Pichard, A.D., Mintz, G.S., Kim, S.W., Lee, S.Y., Kim, S.Y. et al, Outcome of undersized drug-eluting stents for percutaneous coronary intervention of saphenous vein graft lesions. Am J Cardiol. 2010;105:179-185.
21. Wood, F.O., Badhey, N., Garcia, B., Abdel-karim, A.R., Maini, B., Banerjee, S. et al, Analysis of saphenous vein graft lesion composition using near-infrared spectroscopy and intravascular ultrasonography with virtual histology. Atherosclerosis. 2010;212:528-533.
22. Biswas, S., Soon, K., Lim, Y.L. Adjunctive balloon dilatation after stent deployment:
beneficial or deleterious? Int J Cardiol. 2012;157:3-7.
23. Zhang, Z.J., Marroquin, O.C., Stone, R.A., Weissfeld, J.L., Mulukutla, S.R., Selzer, F.
et al, Differential effects of post-dilation after stent deployment in patients presenting with and without acute myocardial infarction. Am Heart J. 2010;160:979-986.e971.
24. Sonoda, S., Morino, Y., Ako, J., Terashima, M., Hassan, A.H., Bonneau, H.N. et al, Impact of final stent dimensions on long-term results following sirolimus-eluting stent implantation: serial intravascular ultrasound analysis from the sirius trial. J Am Coll Cardiol.
2004;43:1959-1963.
25. Honda, Y., Fitzgerald, P., Yock, P. Intravascular ultrasound. In: Topol E, editor. Textbook of Interventional Cardiology. 4th edition. Philadelphia: Elsevier Science; 2003: 893-917.
26. Palmerini, T., Biondi-Zoccai, G., Della, R.D., Mariani, A., Sabate, M., Valgimigli, M.
et al, Clinical outcomes with drug-eluting and bare-metal stents in patients with ST-segment elevation myocardial infarction: evidence from a comprehensive network meta-analysis. J Am Coll Cardiol. 2013;62:496-504.
27. Giglioli, C., Cecchi, E., Vladi, L., Stolcova, M., Valente, S., Meucci, F. et al, Comparison between drug-eluting and bare metal stent on ST-elevation myocardial infarction outcome: should second-generation drug-eluting stent be preferred? J Cardiol. 2014;63:296-301.
28. Wakabayashi, K., Delhaye, C., Mahmoudi, M., Belle, L., Ben-Dor, I., Gaglia, M.A. et al, Impact of drug-eluting stent type on periprocedural myocardial necrosis. EuroIntervention.
2011;7:136-142.
Figure legends
Figure 1: Definition of stent–reference ratio
The stent–reference (SR) ratio was defined as the cross-sectional area (CSA) of the stent divided by the average CSA of the 5-mm proximal and distal reference segments. The stent CSA was
measured at the segment with plaque rupture or the minimum CSA of the culprit lesion. In the example shown here, the 5-mm proximal reference CSA was 10.99 mm3 (A), and the 5-mm distal reference CSA was 8.71 mm3 (C). Thus, the average reference CSA was 9.85 mm3. The stent CSA was 8.21 mm3 (B). The SR ratio was calculated as 8.21 / 9.85 = 0.83; hence, this case was assigned to the undersize group.
Figure 2: Receiver operating characteristic curve to determine the optimal cutoff value for the stent–reference ratio to predict ST re-elevation after stent deployment
The optimal cutoff point for the stent–reference ratio to predict ST re-elevation was 1.01, with a sensitivity of 68.4% and a specificity of 67.5%. The area under the curve was 0.64.
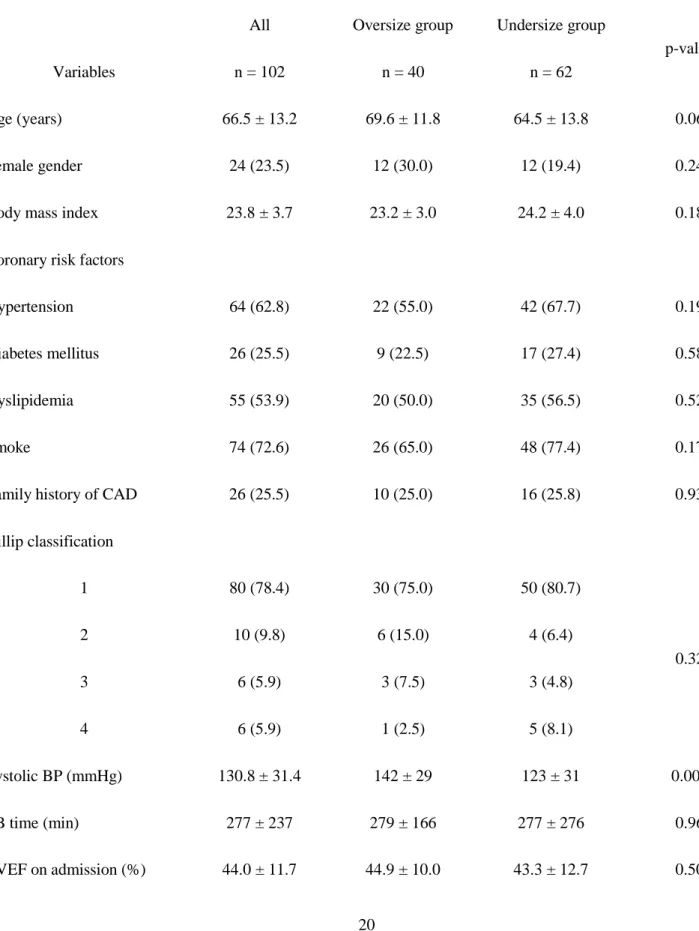
Table 1. Baseline characteristics
Variables
All n = 102
Oversize group n = 40
Undersize group n = 62
p-value
Age (years) 66.5 ± 13.2 69.6 ± 11.8 64.5 ± 13.8 0.06
Female gender 24 (23.5) 12 (30.0) 12 (19.4) 0.24
Body mass index 23.8 ± 3.7 23.2 ± 3.0 24.2 ± 4.0 0.18
Coronary risk factors
Hypertension 64 (62.8) 22 (55.0) 42 (67.7) 0.19
Diabetes mellitus 26 (25.5) 9 (22.5) 17 (27.4) 0.58
Dyslipidemia 55 (53.9) 20 (50.0) 35 (56.5) 0.52
Smoke 74 (72.6) 26 (65.0) 48 (77.4) 0.17
Family history of CAD 26 (25.5) 10 (25.0) 16 (25.8) 0.93
Killip classification
1 80 (78.4) 30 (75.0) 50 (80.7)
2 3
10 (9.8) 6 (5.9)
6 (15.0) 3 (7.5)
4 (6.4) 3 (4.8)
0.32
4 6 (5.9) 1 (2.5) 5 (8.1)
Systolic BP (mmHg) 130.8 ± 31.4 142 ± 29 123 ± 31 0.002
SB time (min) 277 ± 237 279 ± 166 277 ± 276 0.96
LVEF on admission (%) 44.0 ± 11.7 44.9 ± 10.0 43.3 ± 12.7 0.50
Medication on admission
Aspirin (%) 8 (7.8) 2 (5.0) 6 (9.7) 0.39
Clopidogrel (%) 2 (2.0) 1 (2.5) 1 (1.6) 0.75
β- blocker (%) 8 (7.8) 3 (7.5) 5 (8.1) 0.92
Calcium blocker (%) 23 (22.5) 11 (27.5) 12 (19.4) 0.34
ACE-I (%) 4 (3.9) 2 (5.0) 2 (3.2) 0.64
ARB (%) 26 (25.5) 11 (27.5) 15 (24.2) 0.71
Statin (%) 13 (12.7) 6 (15.0) 7 (11.3) 0.58
Diuretics (%) 7 (6.9) 2 (5.0) 5 (8.1) 0.70
Continuous data are presented as mean ± standard deviation. Categorical variables are shown as percentages.
ACE-I, angiotensin converting enzyme inhibitor; ARB, angiotensin Ⅱ receptor blocker; BP, blood pressure; CAD, coronary artery disease; LVEF, left ventricular ejection fraction; SB time, symptom-to-balloon time.
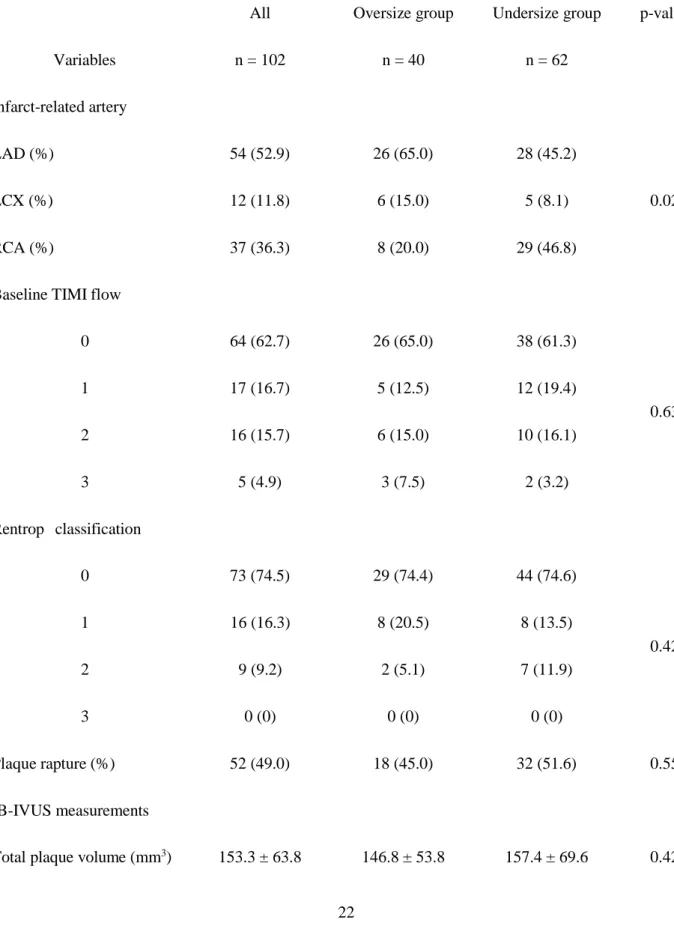
Table 2. Culprit lesion characteristics
Variables
All n = 102
Oversize group n = 40
Undersize group n = 62
p-value
Infarct-related artery
LAD (%) 54 (52.9) 26 (65.0) 28 (45.2)
LCX (%) 12 (11.8) 6 (15.0) 5 (8.1) 0.02
RCA (%) 37 (36.3) 8 (20.0) 29 (46.8)
Baseline TIMI flow
0 64 (62.7) 26 (65.0) 38 (61.3)
1 2
17 (16.7) 16 (15.7)
5 (12.5) 6 (15.0)
12 (19.4) 10 (16.1)
0.63
3 5 (4.9) 3 (7.5) 2 (3.2)
Rentrop classification
0 73 (74.5) 29 (74.4) 44 (74.6)
1 2
16 (16.3) 9 (9.2)
8 (20.5) 2 (5.1)
8 (13.5) 7 (11.9)
0.42
3 0 (0) 0 (0) 0 (0)
Plaque rapture (%) 52 (49.0) 18 (45.0) 32 (51.6) 0.55
IB-IVUS measurements
Total plaque volume (mm3) 153.3 ± 63.8 146.8 ± 53.8 157.4 ± 69.6 0.42
Calcification (mm3) 1.7 ± 1.9 1.7 ± 2.1 1.8 ± 1.8 0.75
Dense fibrosis (mm3) 6.7 ± 4.9 6.5 ± 5.0 6.7 ± 4.8 0.84
Fibrosis (mm3) 59.8 ± 27.7 57.3 ± 23.4 61.4 ± 30.2 0.47
Lipid pool (mm3) 76.3 ± 34.8 73.7 ± 30.8 78.0 ± 37.3 0.54
Continuous data are presented as mean ± standard deviation. Categorical variables are shown as percentages.
IB-IVUS, integrated backscatter intravascular ultrasound; LAD, left anterior descending artery;
LCX, left circumflex artery; RCA, right coronary artery; TIMI, thrombolysis in myocardial infarction.
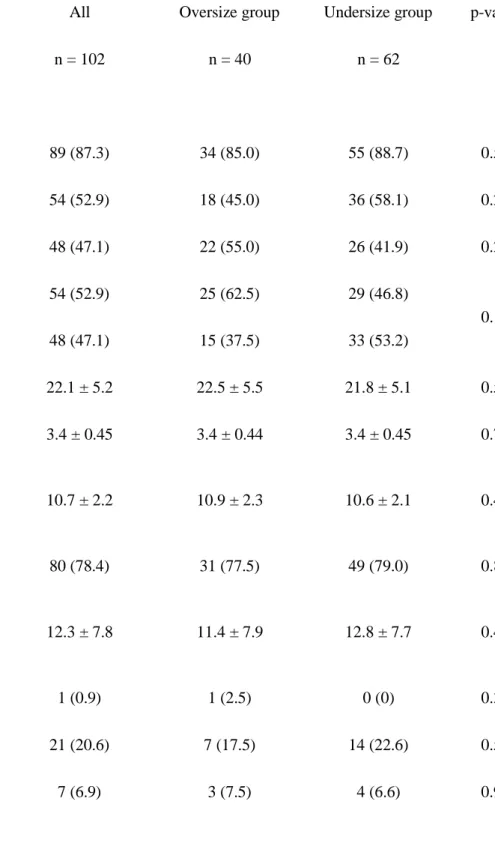
Table 3. PCI procedure and IVUS finding
All Oversize group Undersize group p-value
Variables n = 102 n = 40 n = 62
PCI procedure
Thrombectomy (%) 89 (87.3) 34 (85.0) 55 (88.7) 0.58
Direct stenting (%) 54 (52.9) 18 (45.0) 36 (58.1) 0.20
Pre-dilatation (%) 48 (47.1) 22 (55.0) 26 (41.9) 0.20
BMS (%) 54 (52.9) 25 (62.5) 29 (46.8)
0.12
DES (%) 48 (47.1) 15 (37.5) 33 (53.2)
Stent length (mm) 22.1 ± 5.2 22.5 ± 5.5 21.8 ± 5.1 0.52
Stent diameter (mm) 3.4 ± 0.45 3.4 ± 0.44 3.4 ± 0.45 0.71
Maximum inflation pressure during stent implantation (atm)
10.7 ± 2.2 10.9 ± 2.3 10.6 ± 2.1 0.44
Post-dilatation (%) 80 (78.4) 31 (77.5) 49 (79.0) 0.85
Maximum inflation pressure during post dilatation (atm)
12.3 ± 7.8 11.4 ± 7.9 12.8 ± 7.7 0.41
No-flow (%) 1 (0.9) 1 (2.5) 0 (0) 0.39
Slow-flow (%) 21 (20.6) 7 (17.5) 14 (22.6) 0.54
Side branch loss (%) 7 (6.9) 3 (7.5) 4 (6.6) 0.99
Final TIMI flow
0 0 (0) 0 (0) 0 (0)
0.86 1
2
6 (5.9) 15 (14.7)
3 (7.5) 6 (15.0)
3 (4.8) 9 (14.5)
3 81 (79.4) 31 (77.5) 50 (80.7)
CTCF after PCI procedure 24.0 ± 21.9 25.2 ± 23.4 23.2 ± 21.1 0.66
IVUS findings
Stent area (mm2) 7.9 ± 2.1 8.1 ± 1.9 7.8 ± 2.2 0.48
Stent volume (mm3) 177.0 ± 59.1 179.4 ± 56.9 175.4 ± 60.9 0.74
Stent volume index (mm3/mm) 7.9 ± 2.3 7.9 ± 2.2 8.0 ± 2.3 0.86
Proximal reference CSA (mm2) 10.0 ± 3.9 7.9 ± 1.8 11.3 ± 4.3 <0.0001
Distal reference CSA (mm2) 7.2 ± 3.1 5.7 ± 2.1 8.1 ± 3.4 0.0001
Averaged reference CSA (mm2) 8.5 ± 3.2 6.6 ± 1.7 9.7 ± 3.4 <0.0001
SR ratio (%) 0.99 ± 0.24 1.24 ± 0.16 0.83 ± 0.11 <0.0001
Stent malposition (%) 9 (8.8) 1 (2.5) 8 (12.9) 0.09
Plaque protrusion (%) 12 (11.8) 7 (17.5) 5 (8.1) 0.21
Continuous data are presented as mean ± standard deviation. Categorical variables are shown as percentages.
BMS, bare metal stent; CSA, cross sectional area; CTCF, corrected TIMI frame count; DES, drug eluting stent; IVUS, intravascular ultrasound; PCI, percutaneous coronary intervention; SR ratio, stent CSA/ averaged reference CSA; TIMI, thrombolysis in myocardial infarction.
Table 4. Comparison of ST re-elevation and myocardial damage
All Oversize group Undersize group p-value
Variables n = 102 n = 40 n = 62
Total ST elevation; baseline (mV) 174.1 ± 126.3 177.2 ± 96.0 172.1 ± 143.2 0.85 Total ST elevation; post PCI (mV) 108.0 ± 110.6 122.3 ± 111.6 98.8 ± 110.0 0.30
Total STR (%) 35.1 ± 50.2 22.4 ± 62.7 43.4 ± 38.6 0.04
ST re-elevation (%) 19 (18.6) 13 (32.5) 6 (9.7) 0.004
Peak CK (IU/l) 3879 ± 3083 3949 ± 2767 3833 ± 3292 0.85
Peak CK-MB (IU/l) 281 ± 234 341 ± 259 242 ± 208 0.04
Continuous data are presented as mean ± standard deviation. Categorical variables are shown as percentages.
CK, creatine kinase; PCI, percutaneous coronary intervention; STR, ST resolution.
Supplemental data. Culprit lesion characteristics
All Oversize group Undersize group p-value
Variables n = 102 n = 40 n = 62
IB-IVUS measurements
Calcification (%) 1.2 ± 1.1 1.1 ± 1.0 1.3 ± 1.1 0.44
Dense fibrosis (%) 4.7 ± 2.8 4.5 ± 2.6 4.8 ± 3.0 0.69
Fibrosis (%) 41.4 ± 9.0 41.4 ± 10.2 41.4 ± 8.2 0.99
Lipid pool (%) 52.7 ± 11.8 52.9 ± 12.6 52.5 ± 11.3 0.86
Plaque volume index
Calcification (mm3/mm) 0.07 ± 0.07 0.07 ± 0.07 0.08 ± 0.08 0.44
Dense fibrosis (mm3/mm) 0.3 ± 0.2 0.3 ± 0.2 0.3 ± 0.2 0.52
Fibrosis (mm3/mm) 2.7 ± 1.0 2.6 ± 1.0 2.8 ± 1.1 0.33
Lipid pool (mm3/mm) 3.5 ± 1.5 3.3 ± 1.4 3.6 ± 1.5 0.40
Continuous data are presented as mean ± standard deviation.
IB-IVUS, integrated backscatter intravascular ultrasound; SR, stent cross sectional area (CSA)/
averaged reference CSA.