How Do Advisor Assessments of Diverse Undergraduate Researchers Compare with the Students’ Self-Assessments? And What Does This
Imply for How We Train and Assess Students?
By Barbara C. Bruno, Cherryle Heu, and Grady Weyenberg
REGULAR ISSUE FEATURE
INTRODUCTION
The SOEST Scholars program is an undergraduate research program at the School of Ocean and Earth Science and Technology (SOEST) at the University of Hawai‘i (UH) that runs throughout the academic year. Like many under- graduate research programs, it includes closely mentored research experiences, professional development training, and cohort-building activities. Originally developed by the Center for Microbial Oceanography: Research and Education (C-MORE) to train students in biological oceanography, the program later evolved into the SOEST Scholars Program in 2016 and now spans a wider variety of disci- plines, including chemical and physical oceanography, Earth science, and envi- ronmental science.
in the field of oceanography. Although the number of PhDs awarded in ocean- ography has risen sharply in the last decade, those awarded to ethnic and racial minorities have remained stag- nant (Bernard and Cooperdock, 2018).
Thus, one of our key program goals is to broaden participation among students from groups that have been traditionally underrepresented in STEM, including women, indigenous students, and other ethnic and racial minorities. Toward this goal, we established recruiting partner- ships with various Native Hawaiian and minority-serving organizations, includ- ing community colleges, and this has led to a diverse cohort of undergraduate SOEST Scholars. However, for these stu- dents to persist on a STEM pathway and ultimately diversify the field of ocean-
technical skills is not enough: they also need to develop self-efficacy.
Self-efficacy (a person’s belief that they can accomplish a given task or achieve a desired outcome) has been shown to be a key factor in successful academic perfor- mance that can help motivate students to persist in the face of adversity (Bandura, 1977; Multon et al., 1991; Zimmerman, 2000), including in the ocean and Earth sciences (Kortz et al., 2019) and across STEM fields (Andrew, 1998; Williams and George-Jackson, 2014). In some studies (Zusho et al., 2003), self-efficacy predicted student performance and per- sistence better than other cognitive vari- ables, even when controlling for prior achievement (Lent et al., 1986). Studies of indigenous students have similarly shown significant, positive relationships between self-efficacy and academic suc- cess (Bryan, 2004; Frawley et al., 2017) and between self-efficacy and persistence (Gloria and Robinson Kurpius, 2001).
The motivation of this study is to see how student self-evaluations of their own skills and performances compare with their advisors’ evaluations. This analysis could potentially shed light on student self-efficacy. Further, this paper explores any potential differences between stu- dent vs. advisor assessments through a demographic lens, as prior research stud- ies indicate that students from under- represented groups—such as women (Hackett, 1985; Falk et al., 2016), Native Americans (Brown and Lavish, 2016), and other underrepresented minorities (Carpi et al., 2017)—tend to report lower self- efficacy. Thus, these results can inform how we train diverse undergraduate researchers in oceanography.
ABSTRACT. This study involves survey data collected from 30 diverse undergraduates and their research advisors in oceanography and related fields who participated in the SOEST Scholars Program at the University of Hawai‘i in 2016–17 and 2017–18. At the end of the research experience, students and their advisors each complete online sur- veys to evaluate student performance and growth over the course of the program on a scale of 1 (low) to 5 (high). The results indicate that, on average, (1) the students (4.06) underrate their performance relative to their advisors’ assessments (4.24), a difference (D = 0.18) that is highly significant (p = 0.005), and (2) there is no statistically signifi- cant difference between student and advisor assessments of student growth (p = 0.25).
Further analysis by student demographics reveals distinct differences by gender and ethnicity. In particular, women of Native Hawaiian and Pacific Islander ancestry showed the greatest (D = 0.36) and most significant (p = 0.02) underrating of their own per- formances relative to their advisors’ assessments. In contrast, the mean student-advisor differences obtained for men and non-indigenous students were statistically insignifi- cant (p = 0.31 and 0.18, respectively). This paper explores various possible interpreta- tions of these results and their implications for how we train and assess students, and it includes recommendations for undergraduate research programs in oceanography.
Specifically, we recommend intentionally focusing on building student self-efficacy alongside technical training, designing evaluation instruments that avoid the use of self-promoting language, and scheduling—or at least revisiting—discussions on STEM pathways and careers toward the end of the undergraduate research experience.
DATA AND METHODS
Survey data were collected from 30 diverse undergraduates and their research advisors who participated in the SOEST Scholars Program in 2016–17 and 2017–18 (response rate of 83%). Figure 1 summarizes student demographics.
We collected two types of survey data, which we term “Absolute” and “Growth.”
In the Absolute set, students and advi- sors evaluate the students’ skills and per- formances at the end of the research experience in 10 areas (e.g., amount of work accomplished, quality of work performed) along a five-point Likert scale ranging from Unsatisfactory to Excellent. In the Growth set, stu- dents and advisors evaluate the extent to which the students changed or grew over the course of the research expe- rience in nine areas (e.g., works more
independently, takes more initiative to problem-solve) along a five-point Likert scale ranging from Strongly Disagree to Strongly Agree. (Table 1)
Our null hypothesis is that there is no statistically significant difference between student vs. advisor assessments of students’ skills and performances, as measured by Absolute and Growth sur- vey items. We test this hypothesis in two ways: (1) comparing the student vs. advi- sor responses to each individual sur- vey item, and (2) comparing the student vs. advisor responses to each data set (Absolute and Growth) as a whole. For the former analysis, we perform a paired, two-tailed t-test. For the latter, we apply a non- parametric permutation test.
We then examined any differences in student-advisor ratings by gender, eth- nicity, and the intersectionality of these
identities. This analysis was motivated by previous studies that found that women and certain minority groups—and par- ticularly students at the intersection of those identities—often report lower self-efficacy (see Introduction). For gender, we compared men vs. women, as none of the students reported a non- binary gender. For ethnicity, we com- pared Native Hawaiians and Pacific Islanders (NHPI) vs. non-indigenous students (non-NHPI); this choice was determined by the data set rather than a priori, as 50% of our students were NHPI. For the intersectionality analy- sis, we compared four categories: NHPI women, NHPI men, non-NHPI women, and non-NHPI men.
Further details on data and meth- ods are provided in the online supple- mentary materials.
Caucasian 5 Asian
5 Filipino
3 African American
2 Pacific Islander
1
Female Male 16
14
(a) Gender (b) Ethnicity
Native Hawaiian
14
FIGURE 1. Gender and ethnicity demographics of 30 SOEST Scholars involved in the study described here. Half (15) are Native Hawaiians and Pacific Islanders (NHPI); the other half represent a range of non-indigenous identities.
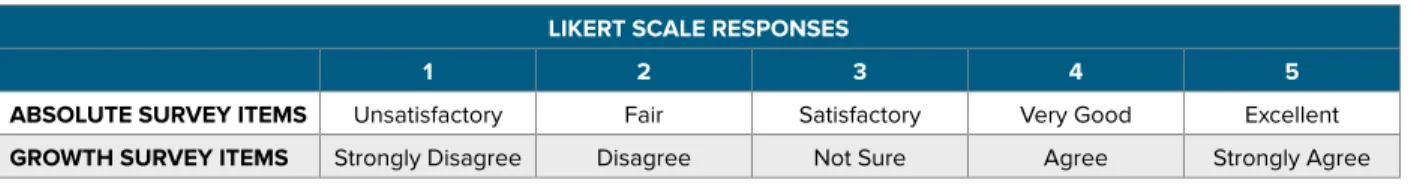
TABLE 1. Quantification of Likert responses to Absolute and Growth survey items on a scale of 1 to 5.
LIKERT SCALE RESPONSES
1 2 3 4 5
ABSOLUTE SURVEY ITEMS Unsatisfactory Fair Satisfactory Very Good Excellent GROWTH SURVEY ITEMS Strongly Disagree Disagree Not Sure Agree Strongly Agree
FIGURE 2. Histogram of student (orange) vs. advisor (blue) responses to
RESULTS
Absolute Results
(All Students and Advisors)
As a group, the 30 SOEST Scholars con- sistently underrated their Absolute skills and performances relative to their advi- sors’ ratings (Table 2 and Figure 2). For eight of 10 survey items, D values were positive, ranging from 0.03 to 0.40, indi- cating that the students’ mean self- ratings were lower than the advisors’ mean rat- ings. The remaining two items yielded D = 0 and D = –0.03, respectively indi-
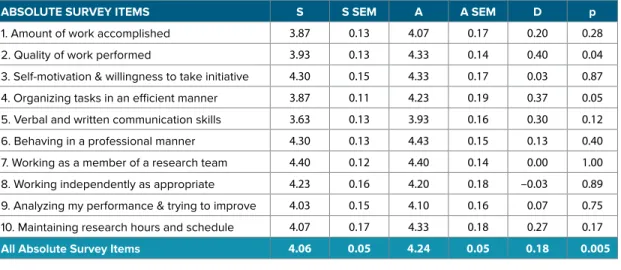
FIGURE 3. Distribution of permutation test results for the Absolute TABLE 2. Comparison of advisor vs. student responses to 10 Absolute survey items assessing student skills and perfor-
mances at the end of the undergraduate research experience.
ABSOLUTE SURVEY ITEMS S S SEM A A SEM D p
1. Amount of work accomplished 3.87 0.13 4.07 0.17 0.20 0.28
2. Quality of work performed 3.93 0.13 4.33 0.14 0.40 0.04
3. Self-motivation & willingness to take initiative 4.30 0.15 4.33 0.17 0.03 0.87 4. Organizing tasks in an efficient manner 3.87 0.11 4.23 0.19 0.37 0.05 5. Verbal and written communication skills 3.63 0.13 3.93 0.16 0.30 0.12
6. Behaving in a professional manner 4.30 0.13 4.43 0.15 0.13 0.40
7. Working as a member of a research team 4.40 0.12 4.40 0.14 0.00 1.00 8. Working independently as appropriate 4.23 0.16 4.20 0.18 –0.03 0.89 9. Analyzing my performance & trying to improve 4.03 0.15 4.10 0.16 0.07 0.75 10. Maintaining research hours and schedule 4.07 0.17 4.33 0.18 0.27 0.17
All Absolute Survey Items 4.06 0.05 4.24 0.05 0.18 0.005
S = Mean student self-assessment.
S SEM = Standard Error of S.
A = Mean advisor assessment.
A SEM = Standard Error of A.
D = A – S.
p = Probability value. For individual survey items, p is calculated from a two-tailed, paired t-test. For all Absolute survey items combined, p is calculated empirically from a permutation test.
cating that the mean student self- rating was identical or very slightly higher than the mean advisor rating. T-test results for each survey item indicate that most of these student-advisor differences were not statistically significant (defined as p < 0.05): the only survey items found to have significant student-advisor dif- ferences were Quality of work performed (Absolute Item 2) and Organizing tasks in an efficient manner (Absolute Item 4).
These data raise the question: Even though the advisor-student differences
(D) for individual Absolute survey items are generally not statistically significant, does the general pattern of positive D val- ues indicate that the students are statisti- cally significantly underrating themselves relative to their advisors’ assessments on Absolute survey items as a whole?
To answer this question, we performed a permutation test, and the answer is a resounding yes. We found p = 0.005, indicating that the advisor-student differ- ences are highly significant (Figure 3 and last row of Table 2).
3.5 3.7 3.9 4.1 4.3 4.5
1 2 3 4 5 6 7 8 9 10
Mean Responses
Absolute Survey Items Student
Advisor
–0.2 –0.1 0 0.1 0.2
Mean Difference 1,000
2,000 3,000 4,000 5,000
Frequency
0.18
Growth Results
(All Students and Advisors)
In contrast to the Absolute survey items, there is no systematic pattern of students’
underrating their Growth over the course of the research experience relative to their advisors’ ratings, let alone a statistically significant one (Table 3 and Figure 4).
In fact, for six of the nine Growth items, students self-ranked their Growth higher than did their advisors (D < 0). Applying a paired, two-tailed t-test to each Growth survey item, none of these differences were statistically significant at α = 0.05 and only
FIGURE 4. Histogram of student (orange) vs. advisor (blue) responses to Growth survey responses. Error bars represent ±1 one standard error of the mean. In contrast to the Absolute data, in six of nine Growth survey items, the advisors rate student growth lower than the students rate themselves, although these differences are generally not statistically significant.
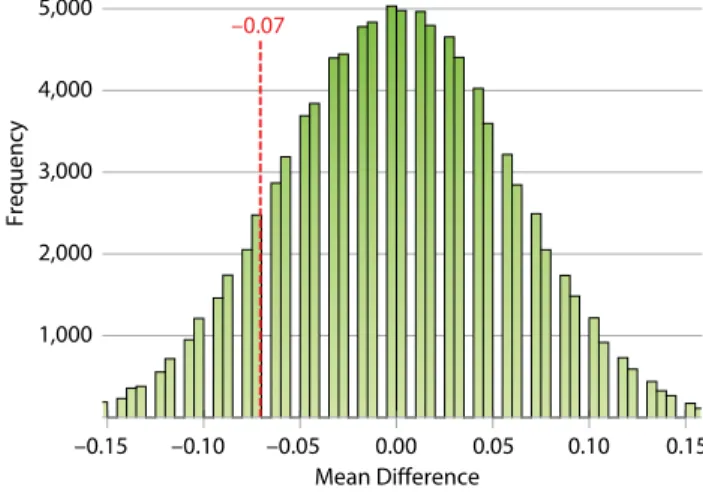
FIGURE 5. Distribution of permutation test results for the Growth data set (nine survey items combined), showing that the observed student-advisor differences are statistically insignificant (observed mean difference = –0.07; p = 0.25).
TABLE 3. Comparison of advisor vs. student responses to nine Growth survey items assessing growth during the undergraduate research experience. On the student survey, all Growth items begin with the phrase: “Compared to before I started the Scholars Program, I now…” On the advisor survey, the wording is “Compared to when s/he started the Scholars Program, the student now…”
GROWTH SURVEY ITEMS S S SEM A A SEM D p
1 Work more independently 3.93 0.17 4.07 0.15 0.13 0.51
2 Take more initiative to problem-solve 4.13 0.16 4.07 0.15 –0.07 0.75
3 Am more confident about my STEM abilities 4.17 0.10 4.30 0.15 0.13 0.38
4 Have a larger professional network 4.47 0.13 4.33 0.14 –0.13 0.35
5 Am more interested in attending graduate school 4.20 0.15 3.90 0.16 –0.30 0.06
6 Am more excited about STEM 4.13 0.12 4.03 0.14 –0.10 0.40
7 Have a better understanding of how to succeed in school 4.17 0.14 4.13 0.14 –0.03 0.87 8 Have a better understanding of how to conduct research 4.47 0.11 4.60 0.10 0.13 0.35 9 Am more interested in pursuing a STEM career 4.30 0.14 3.93 0.16 –0.37 0.08
All Growth Survey Items 4.22 0.05 4.15 0.05 –0.07 0.25
S = Mean student self-assessment.
S SEM = Standard Error of S.
A = Mean advisor assessment.
A SEM = Standard Error of A.
D = A – S.
p = Probability value. For individual survey items, p is calculated from a two-tailed, paired t-test. For all Growth survey items com- bined, p is calculated empirically from a permutation test.
two p < 0.10 (p ranged from 0.06 to 0.75).
The two greatest—and most statis- tically significant—disparities between student vs. advisor mean ratings (both D < 0) pertained to the two survey items that concerned students’ future plans:
Growth Item 5. Compared to before I started the program, I now am more interested in attending graduate school (D = –0.30; p = 0.06). Growth Item 9.
Compared to before I started the program, I now am more interested in pursuing a STEM career (D = –0.37; p = 0.08). For both survey items, the students, on aver-
age, self-reported greater Growth during the course of the undergraduate research experience than did their advisors, result- ing in D < 0.
Performing a permutation test on the complete Growth data set (all nine survey items combined) yielded p = 0.25. That is, 25% of the 100,000 permutations were tailward of the observed mean difference (–0.07; Figure 5). The low significance of this p-value is unsurprising, given the lack of systemic differences between the student vs. advisor responses to the Growth survey items (Figure 4).
Student Advisor
3.7 3.9 4.1 4.3 4.5 4.7
1 2 3 4 5 6 7 8 9
Mean Responses
Growth Survey Items
–0.07
–0.15 –0.10 –0.05 0.00 0.05 0.10 0.15
Mean Difference 1,000
2,000 3,000 4,000 5,000
Frequency
Demographic Analyses
Here, we present the results of our demo- graphic analyses by gender (men and women), ethnicity (NHPI and non- NHPI), and the intersection of gender and ethnicity (NHPI women, NHPI men, non-NHPI women, and non-NHPI men). For each analysis, we applied the permutation test methodology described above to the entire sets of Absolute and Growth survey items.
GENDER
We found that both male (3.97) and female (4.14) students’ mean responses to Absolute survey items were lower than the corresponding advisors’ assessments (4.06 and 4.39, respectively). However, only the female students’ self-assessments were significantly less than their advi- sors’ assessments. The difference between ratings given by male students and their advisors on Absolute survey items was smaller in magnitude (D = 0.09 male vs.
0.24 female) and much less significant (p = 0.31 male vs. 0.01 female) (Table 4a).
For Growth survey items, the male students’ mean self-assessments (4.01) were again slightly lower but statistically indistinguishable (p = 0.69) from their advisors’ assessments (4.05). However, for female students, a different pattern emerged. The female students, as a group, self-rated their Growth more highly (4.41) than did their advisors (4.24), and this difference was reasonably significant (p = 0.06) (Table 4b).
Together, the Growth and Absolute permutation analyses indicate that female SOEST Scholars, on average, significantly underrated their skills and performances at the end of a research experience rela- tive to their advisors’ assessments, but self-reported more Growth. In contrast, mean differences between male SOEST Scholars self-assessments vs. their advi- sors’ assessments were much smaller and within the range of error (not statisti- cally significant).
ETHNICITY
We found that both NHPI (3.91) and non-NHPI (4.21) students’ mean responses to Absolute survey items were lower than the corresponding advisors’
assessments (4.15 and 4.32, respectively).
However, only the NHPI students’ mean self- assessments were significantly less than their advisors’ mean assessments (p = 0.01). The difference between ratings
given by non-NHPI students and their advisors on Absolute survey items was much less significant (p = 0.18) (Table 5a).
For Growth survey items, both NHPI (4.24) and non-NHPI (4.21) students’
mean self-assessments were slighter higher but statistically indistinguishable (p = 0.31 and 0.60, respectively) from their advisors’ assessments (4.15 and 4.16, respectively) (Table 5b).
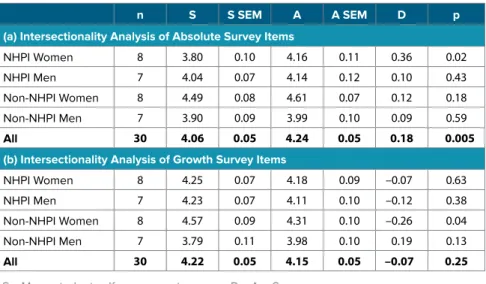
TABLE 5. Comparison of advisor vs. student responses to (a) Absolute and (b) Growth sur- vey items by gender (men and women) and ethnicity (NHPI and non-NHPI) through an inter- sectionality analysis.
n S S SEM A A SEM D p
(a) Intersectionality Analysis of Absolute Survey Items
NHPI Women 8 3.80 0.10 4.16 0.11 0.36 0.02
NHPI Men 7 4.04 0.07 4.14 0.12 0.10 0.43
Non-NHPI Women 8 4.49 0.08 4.61 0.07 0.12 0.18
Non-NHPI Men 7 3.90 0.09 3.99 0.10 0.09 0.59
All 30 4.06 0.05 4.24 0.05 0.18 0.005
(b) Intersectionality Analysis of Growth Survey Items
NHPI Women 8 4.25 0.07 4.18 0.09 –0.07 0.63
NHPI Men 7 4.23 0.07 4.11 0.10 –0.12 0.38
Non-NHPI Women 8 4.57 0.09 4.31 0.10 –0.26 0.04
Non-NHPI Men 7 3.79 0.11 3.98 0.10 0.19 0.13
All 30 4.22 0.05 4.15 0.05 –0.07 0.25
TABLE 4. Comparison of advisor vs. student responses to (a) Absolute and (b) Growth survey items by gender (men and women) and ethnicity (NHPI and non-NHPI). No students reported other genders.
CATEGORY VARIABLE n S S SEM A A SEM D p
(a) Demographic Analysis of Absolute Survey Items
Gender Men 14 3.97 0.06 4.06 0.08 0.09 0.31
Women 16 4.14 0.07 4.39 0.07 0.24 0.01
Ethnicity NHPI 15 3.91 0.06 4.15 0.08 0.24 0.01
Non-NHPI 15 4.21 0.06 4.32 0.06 0.11 0.18
All Data 30 4.06 0.05 4.24 0.05 0.18 0.005
(b) Demographic Analysis of Growth Survey Items
Gender Men 14 4.01 0.07 4.05 0.07 0.04 0.69
Women 16 4.41 0.06 4.24 0.07 –0.17 0.06
Ethnicity NHPI 15 4.24 0.05 4.15 0.07 –0.09 0.31
Non-NHPI 15 4.21 0.08 4.16 0.07 –0.05 0.60
All Data 30 4.22 0.05 4.15 0.05 –0.07 0.25
S = Mean student self-assessment.
S SEM = Standard Error of S.
A = Mean advisor assessment.
A SEM = Standard Error of A.
D = A – S.
p = Probability value calculated empirically from permutation test.
Together, these results indicate that NHPI SOEST Scholars, on average, significantly underrate their skills and performances at the end of a research experience relative to their advisors’ assessments and report slightly (but not significantly) more Growth.
Mean differences between non-NHPI SOEST Scholars vs. their advisors’ assessments for both Growth and Absolute survey items were small and not statistically significant.
INTERSECTIONALITY
We explored the interplay between gender and ethnicity through an intersectionality analysis of four subgroups of students: NHPI women, NHPI men, non-NHPI women, and non-NHPI men. Although all subgroups, on average, underrated their Absolute skills relative to their advisors’ ratings (all D > 0), the magnitude and significance of the mean advisor-student difference varied greatly (Table 5a). NHPI women had the greatest (D = 0.36) and most significant (p = 0.02) underreporting of their Absolute skills and performances. Conversely, non-NHPI men had the smallest, least signifi- cant student- advisor difference (D = 0.09, p = 0.59). Assessments of Growth during the research experience were mixed, with all students except non-NHPI men self- reporting greater Growth than did their advisors, at greatly varying significant levels (0.04 to 0.63). Non-NHPI women reported the highest Growth (S = 4.31), the greatest disparity with their advisors’ ratings (D = –0.26), and the most significant differences (p = 0.04).Non-NHPI men were the only group of students to self-assess their mean Growth during the research experience as lower than did their advisors (D = 0.19, p = 0.13) (Table 5b).
DISCUSSION AND RECOMMENDATIONS
As a group, the SOEST Scholars significantly underrated their Absolute skills and per- formances relative to their advisors’ assessments (D = 0.18; p = 0.005). The advisor- student difference was most pronounced among NHPI women (D = 0.36; p = 0.02).
As a group, the students were much more likely to rate themselves “very good” when their advisors rated them as “excellent” (Figure 6)—and this pattern was driven by the responses of NHPI women (Figure 7a) and NHPI men (Figure 7b). In this section, we explore possible interpretations of these results and their implications for training and assessing undergraduate researchers.
0 40 80 120 160
Unsatisfactory
(1) Fair
(2) Satisfactory
(3) Very Good
(4) Excellent (5)
Frequency
Absolute Survey Responses Student Advisor
FIGURE 6. Line graph of Absolute survey responses (all students and advisors) show- ing that students’ underrating of their own research performances relative to their advisors’ assessments was largely due to students rating themselves “very good” in cases where their advisors rated them “excellent.”
FIGURE 7. Line graphs of Absolute survey responses for (a) NHPI women, (b) NHPI men, (c) non-NHPI women, and (d) non-NHPI men. In many cases, NHPI students rated themselves
“very good” in cases where their advisors rated them “excellent.” This pattern was not seen among non-NHPI students.
Student Advisor
Frequency
0 10 20 30 40
Frequency
0 10 20 30 40 50
Frequency
0 10 20 30 40 50 60
Frequency
Absolute Survey Responses Unsatisfactory (1)
Fair (2)
Satisfactory (3)Very Good (4)Excellent (5) (a) NHPI Women
(b) NHPI Men
(c) Non-NHPI Women
(d) Non-NHPI Men
0 10 20 30 40
Recommendation 1.
Intentionally Focus on Building Student Self-Efficacy
One explanation for mean student Absolute survey responses being lower, on average, than mean advisor ratings could be low student self-efficacy. If true, this would suggest that the SOEST Scholars program, and perhaps under- graduate oceanography research pro- grams in general, could be improved by intentionally focusing on building stu- dent self-efficacy, which has been linked to academic and career success. Here are a few examples of how this could be in done in the context of undergraduate research training in oceanography (based on Bandura, 1977, and Kortz et al., 2019).
•
Design research projects (e.g., field and laboratory work) such that some degree of troubleshooting is required. Rather than handing students a perfected methodology, leave some issues for the students to encounter that are within their skill sets to solve. Developing mastery by overcoming progressively more difficult obstacles through perse- verance and hard work is a highly effec- tive way of building self-efficacy.•
Students also build self-efficacy through vicarious experiences: “If they can do it, I can too.” This is particularly effective when the person observed to be succeeding is of a similar back- ground (e.g., gender, racial, or socio- economic) to the student observer. For example, women mentoring women has been shown to significantly ben- efit women’s confidence, persistence, and performance in STEM (Bettinger and Long, 2005; Drury et al., 2011;Dawson et al., 2015; Thomas et al., 2015; Herrmann et al., 2016). It can sometimes be challenging, however, to find women, minority, and low- income role models and mentors in oceanography. Until the oceanography
dents) as well as professionals in other STEM fields (e.g., biology, engineer- ing) to contribute relevant expertise.
•
In addition to mastery and vicarious experiences, students build self-efficacy through social persuasion (e.g., being assured that success is possible) and reducing physical or emotional stress (e.g., through physical activity, positive environment; Bandura, 1977; Kortz et al., 2019). Service learning projects that address real-world needs (Astin et al., 2000; Eyler et al., 2001; Boyle et al., 2007; Celio et al., 2011), espe- cially when combined with structured reflections (Conway and Amel, 2009) and outdoor activities (Stokes et al., 2015), invoke many of these strategies.Thus, incorporating these approaches into undergraduate research programs is highly recommended.
Recommendation 2.
Design Evaluation Instruments to Avoid Use of Self-Promoting Language
A second, possibly related, interpretation for student Absolute survey responses being lower, on average, than the advi- sor ratings could be that students in general— and perhaps female and/or indigenous students in particular—may be less comfortable describing themselves or their research performances with self-promoting language. Lerchenmueller et al. (2019) found gender differences in how scientists present the importance of their research. Their textual analysis of over six million scientific research arti- cles revealed that male-led research teams were 12% more likely to use glowing terms (e.g., “novel,” “unique,” “excellent”) to describe their research than female-led teams, and that such self-promotion was associated with greater numbers of cita- tions. Kolev et al. (2019) similarly found gender differences in language use among scientists when communicating about
themselves “very good” when their advi- sors rate them as “excellent.”
In contrast to the Absolute data, stu- dents’ mean ratings of their Growth over the undergraduate research expe- rience exceeded their advisors’ ratings.
One explanation for this disparity is that a different Likert Scale was used, this time ranging from Strongly Disagree to Strongly Agree. Perhaps students, on average, felt more comfortable Strongly Agreeing with a statement that they improved considerably in a given skill set over the course of a research experience, compared with saying they were Excellent at the end of the research experience.
Thus, it could be valuable to reframe survey item language to enable use of a Likert Scale ranging from Strongly Disagree to Strongly Agree, rather than from Unsatisfactory to Excellent.
Recommendation 3.
Discuss STEM Pathways and Careers at the End of the Research Experience
Interestingly, the two greatest— and most statistically significant— disparities between student vs. advisor mean ratings on Growth survey items pertained to the two survey items that concerned students’ future plans: Growth Item 5.
Compared to before I started the pro- gram, I now am more interested in attend- ing graduate school (D = –0.30; p = 0.06).
Growth Item 9. Compared to before I started the program, I now am more interested in pursuing a STEM career (D = –0.37; p = 0.08). For both sur- vey items, the students, on average, self- reported considerably more Growth than did their advisors (hence D < 0). This sug- gests that discussions and professional development on these topics may be more impactful if they are scheduled—or at least revisited—toward the end of the undergraduate research experience.
Limitations of This Study
coming of this approach is the inherent assumption of equal spacing between successive responses—for example, that the distance between “Strongly Disagree”
and “Disagree” is the same as the distance between “Disagree” and “Not Sure.” For
the t-test, this quantification is required.
For the permutation test, it is possible to avoid this quantification by only con- sidering the sign (not the magnitude) of the advisor-student difference. This sign- only approach would entail assigning one of three sign values to each student- advisor pair, –1 (S > A), 0 (S = A), and +1 (A > S), computing the mean, and comparing this observed mean value to that obtained from (say, 100,000) permu- tations of the original data set. However, doing so loses key information, thereby drastically reducing the power of the test.
Therefore, we instead opted to quantify the Likert Scale and acknowledge this underlying assumption.
A second limitation of the study is rooted in the small size of our data set (30 student-advisor pairs) and the fact that SOEST Scholars represent numerous ethnicities. This combination precluded analysis of each individual ethnicity and limited our ethnicity analysis to compar- ing the responses of indigenous Native Hawaiian and Pacific Islander (NHPI) stu- dents with those of non-NHPI students.
The latter category includes students from
groups that have been traditionally under- represented (e.g., African- American, Hispanic, Filipino) and overrepresented (e.g., Caucasian, Asian) in STEM fields.
Therefore, caution is advised when inter- preting these combined results.
Finally, we recognize that students and advisors have access to different infor- mation. For some Growth survey items (e.g., Question 3. Compared to before I started the program, I now am more con- fident about my STEM abilities), advisors may have little or no knowledge. Thus, we do not interpret student-advisor dif- ferences in responses to Growth survey items in terms of self-efficacy.
CONCLUSIONS
As a group, the undergraduate research- ers consistently underrated their Absolute skills and performances rel- ative to their advisors’ ratings. For all 10 Absolute survey items combined, the mean student and advisor ratings were 4.06 and 4.24, respectively—a differ- ence that is highly significant (p = 0.005).
Much of this advisor- student difference was driven by the responses of NHPI women (D = 0.36; p = 0.02). While men and non-indigenous students also rated themselves lower than did their advi- sors, the differences were considerably less (D: 0.09–0.12) as well as less signifi- cant (p: 0.18–0.59). NHPI students (both
men and women) were much more likely to rate themselves “very good” when their advisors rated them as “excellent” than non-NHPI students. These differences in advisor-student ratings may be due to low student self-efficacy and/or discomfort in
describing oneself with self-promoting language. The former explanation would lead to a recommendation to intention- ally build student self-efficacy along- side technical training in undergraduate research programs, while the latter would suggest a need to reframe survey items to avoid the use of self-promoting lan- guage (e.g., using a Likert Scale ranging from Strongly Disagree to Strongly Agree, rather than from Unsatisfactory to Excellent). In contrast to the Absolute survey items, there was no statistically significant difference between student and advisor assessments on Growth sur- vey items as a whole (p = 0.25).
However, for both Growth survey items pertaining to students’ interest in pursu- ing graduate school and STEM careers, the students self-reported greater mean Growth during the course of the under- graduate research experience than did their advisors (D = –0.30 and D = –0.37, respectively). This suggests that conver- sations with students about STEM path- ways and careers should be held—or at least revisited—toward the end of the undergraduate research experience.
“
Specifically, we recommend intentionally focusing on building student self-efficacy alongside technical training, designing evaluation instruments that avoid the use of self- promoting language, and scheduling—or at least revisiting—discussions on STEM pathways and careers toward the end of the undergraduate research experience.
”
.ONLINE SUPPLEMENTARY MATERIALS Data and Methods (detailed information) and the Student and Advisor Surveys are available online at https://doi.org/10.5670/oceanog.2020.210.
REFERENCES
Andrew, S. 1998. Self-efficacy as a predictor of academic performance in science. Journal of Advanced Nursing 27(3):596–603, https://doi.org/
10.1046/j.1365-2648.1998.00550.x.
Astin, A.W., L.J. Vogelgesang, E.K. Ikeda, and J.A. Yee. 2000. How service learning affects stu- dents. University of California, Los Angeles, https://heri.ucla.edu/PDFs/HSLAS/HSLAS.PDF.
Bandura, A. 1977. Self-efficacy: Towards a unify- ing theory of behavioral change. Psychological Review 84(2):191–215, https://doi.org/
10.1037/0033-295X.84.2.191.
Bernard, R.E., and E.H.G. Cooperdock. 2018.
No progress on diversity in 40 years. Nature Geoscience 11(5):292–295, https://doi.org/10.1038/
s41561-018-0116-6.
Bettinger, E.P., and B.T. Long. 2005. Do faculty serve as role models? The impact of instruc- tor gender on female students. American Economic Review 95(2):152–157, https://doi.org/
10.1257/000282805774670149.
Boyle, A., S. Maguire, A. Martin, C. Milsom, R. Nash, S. Rawlinson, A. Turner, and S. Wurthmann. 2007.
Fieldwork is good: The student perception and the affective domain. Journal of Geography in Higher Education 31(2):299–317, https://doi.org/
10.1080/03098260601063628.
Brown, C., and L.A. Lavish. 2016. Career assess- ment with Native Americans: Role salience and career decision-making self-efficacy. Journal of Career Assessment 14(1):116–129, https://doi.org/
10.1177/1069072705281368.
Bryan, M.T. 2004. An Examination of Navajo Cultural Identity and its Relationship to Academic Achievement. Doctoral dissertation, Brigham Young University, Utah.
Carpi, A., D.M. Ronan, H.M. Falconer, and N.H. Lents. 2017. Cultivating minority scientists:
Undergraduate research increases self-efficacy and career ambitions for underrepresented stu- dents in STEM. Journal of Research in Science Teaching 54(2):169–194, https://doi.org/10.1002/
tea.21341.
Celio, C.I., J. Durlak, and A. Dymnicki. 2011.
A meta-analysis of the impact of service- learning on students. Journal of Experiential Education 34(2):164–181, https://doi.org/ 10.1177/
105382591103400205.
Conway, J.M., E.L. Amel, and D.P. Gerwien. 2009.
Teaching and learning in the social context:
A meta-analysis of service learning’s effects on academic, personal, social, and citizenship out- comes. Teaching of Psychology 36(4):233–245, https://doi.org/ 10.1080/00986280903172969.
Dawson, A.E., B.L. Bernstein, and J.M. Bekki. 2015.
Providing the psychosocial benefits of men- toring to women in STEM: CareerWISE as an online solution. New Directions for Higher Education 2015(171):53–62, https://doi.org/10.1002/
he.20142.
Drury, B.J., J.O. Siy, and S. Cheryan. 2011. When do female role models benefit women? The impor- tance of differentiating recruitment from reten- tion in STEM. Psychological Inquiry 22(4):265–269, https://doi.org/10.1080/1047840X.2011.620935.
Eyler, J.S., D.E.J. Giles, C.M. Stenson, and C.J. Gray.
Falk, N.A., P.J. Rottinghaus, T.N. Casanova, F.H. Borgen, and N.E. Betz. 2016. Expanding women’s participation in STEM. Journal of Career Assessment 25(4):571–584, https://doi.org/
10.1177/1069072716665822.
Frawley, J., R. Ober, M. Olcay, and J.A. Smith. 2017.
Indigenous Achievement in Higher Education and the Role of Self-Efficacy: Rippling Stories of Success. National Centre for Student Equity in Higher Education, Curtin University, Perth, 31 pp.
Gloria, A.M., and S.E. Robinson Kurpius. 2001.
Influences of self-beliefs, social support, and com- fort in the university environment on the academic nonpersistence decisions of American Indian undergraduates. Cultural Diversity and Ethnic Minority Psychology 7(1):88–102, https://doi.org/
10.1037/1099-9809.7.1.88.
Hackett, G. 1985. Role of mathematics self- efficacy in the choice of math-related majors of college women and men: A path analysis. Journal of Counseling Psychology 32(1):47–56, https://doi.org/
10.1037/0022-0167.32.1.47.
Herrmann, S.D., R.M. Adelman, J.E. Bodford, O. Graudejus, M.A. Okun, and V.S. Kwan. 2016.
The effects of a female role model on aca- demic performance and persistence of women in STEM courses. Basic and Applied Social Psychology 38(5):258–268, https://doi.org/10.1080/
01973533.2016.1209757.
Kolev, J., Y. Fuentes-Medel, and F. Murray. 2019.
Is Blinded Review Enough? How Gendered Outcomes Arise Even Under Anonymous Evaluation. National Bureau of Economic Research (NBER) Working Paper No. 25759, 42 pp.
Kortz, K.M., D. Cardace, and B. Savage. 2019.
Affective factors during field research that influ- ence intention to persist in the geosciences.
Journal of Geoscience Education 68(2):133–151, https://doi.org/10.1080/10899995.2019.1652463.
Lent, R.W., S.D. Brown, and K.C. Larkin. 1986. Self- efficacy in the prediction of academic perfor- mance and perceived career options. Journal of Counseling Psychology 33(3):265–269, https://doi.org/ 10.1037/0022-0167.33.3.265.
Lerchenmueller, M.J., O. Sorenson, and A.B. Jena.
2019. Gender differences in how scientists pres- ent the importance of their research: Observational study. BMJ 367(8227):470–476, https://doi.org/
10.1136/bmj.l6573.
Multon, K.D., S.D. Brown, and R.W. Lent. 1991.
Relation of self-efficacy beliefs to academic out- comes: A meta-analytic investigation. Journal of Counseling Psychology 38(1):30–38, https://doi.org/
10.1037/0022-0167.38.1.30.
Stokes, P.J., R. Levine, and K.W. Flessa. 2015.
Choosing the geoscience major: Important factors, race/ethnicity, and gender. Journal of Geoscience Education 63(3):250–263, https://doi.org/
10.5408/14-038.1.
Thomas, N., J. Bystydzienski, and A. Desai. 2015.
Changing institutional culture through peer men- toring of women STEM faculty. Innovative Higher Education 40(2):143–157, https://doi.org/10.1007/
s10755-014-9300-9.
Williams, M.M., and C.E. George-Jackson. 2014. Using and doing science: Gender, self-efficacy, and sci- ence identity of undergraduate students in STEM.
Journal of Women and Minorities in Science and Engineering 20(2):99–126, https://doi.org/10.1615/
JWomenMinorScienEng.2014004477.
Zimmerman, B.J. 2000. Self-efficacy: An essen- tial motive to learn. Contemporary Educational Psychology 25(1):82–91, https://doi.org/10.1006/
Zusho, A., P.R. Pintrich, and B. Coppola. 2003. Skill and will: The role of motivation and cognition in the learning of college chemistry. International Journal of Science Education 25(9):1,081–1,094, https://doi.org/ 10.1080/0950069032000052207.
ACKNOWLEDGMENTS
The SOEST Scholars program is supported by the National Science Foundation (NSF/OIA #1557349 and NSF/GEO #1565950) and Kamehameha Schools (KS#12662304). Maria Daniella Douglas and S. Anne Wallace contributed to the literature review. The authors thank two anonymous reviewers for input that improved this manuscript.
AUTHORS
Barbara C. Bruno ([email protected]) is Faculty Specialist and Cherryle Heu is Undergraduate Research Assistant, both at the Hawai‘i Institute of Geophysics and Planetology, School of Ocean and Earth Science and Technology, University of Hawai‘i at Mānoa, Honolulu, HI, USA. Grady Weyenberg is Assistant Professor, Department of Mathematics, College of Natural and Health Sciences, University of Hawai‘i at Hilo, Hilo, HI, USA.
ARTICLE CITATION
Bruno, B.C., C. Heu, and G. Weyenberg. 2020.
How do advisor assessments of diverse undergraduate researchers compare with the stu- dents’ self- assessments? And what does this imply for how we train and assess students?
Oceanography 33(2):134–143, https://doi.org/10.5670/
oceanog.2020.210.
COPYRIGHT & USAGE
This is an open access article made available under the terms of the Creative Commons Attribution 4.0 International License (https://creativecommons.org/
licenses/by/4.0/), which permits use, sharing, adap- tation, distribution, and reproduction in any medium or format as long as users cite the materials appro- priately, provide a link to the Creative Commons license, and indicate the changes that were made to the original content.