Published by Research Institute for Humanity and NatureSanitation Value Chain Vol. 2 (01) pp. 039-054, 2018
Introduction
According to the Zambian Central Statistical Office, only 67.7% of the Zambian population have access to improved drinking water sources and 40%, to improved sanitation (CSO, 2016). The challenges of water, WASH and health are daily occurrences in the urban slum (i.e., peri-urban/unplanned settlement) communities of Lusaka, Zambia’s capital city. Lusaka has the highest number of peri-urban communities (N = 37) with approximately 70% of Lusaka’s 1,854,907 being slum residents (CSO 2012). Basically, a slum can be defined as “…a wide range of low-income settlements and/or poor human living conditions… [or]… a heavily populated urban area
Abstract
The study conducted was a preliminary investigation into peri-urban water, sanitation, hygiene (WASH) and health in Lusaka, Zambia, in preparation for a future action research study incorporating children and youth as co-researchers and community change makers. According to the Zambian Central Statistical Office, only 67.7% of the Zambian population have access to improved drinking water sources and 40%, to improved sanitation (CSO 2016). In pursuit of the 2030 Sustainable Development Goals (SDGs), the United Nations (UN) has highlighted the importance of child and youth involvement in global and national challenges. In Zambia, however, their civic participation level remains limited despite over 60% of the population being under 24 years of age (CSO 2012; Innovations in Civic Participation 2010). Data collection comprised of naturalistic observations and interviews (in 9 peri-urban communities); and a short survey on WASH in 3 of the 9 visited sites (N = 318; age range = 8-89 years). Focus was on understanding current community WASH, health and civic participation of children and youth. Results revealed several challenges regarding the aforementioned focus areas. Being unplanned settlements, access to clean water, toilet and waste disposal facilities was poor for community residents. Disease outbreaks were found to occur on a yearly basis in certain sites. The civic participation of children and youth in their communities was also poor, with several young person’s not understanding the concept. The results highlighted the status quo of community WASH and health, and the intervention challenge that would be afforded the children and youth in the upcoming action research study, aiding in the development of a framework by which the children and youth could participate in the study and impact their communities on matters of WASH and health.
Keywords: WASH, health, civic participation, peri-urban, children, youth
1 Graduate School of Health Sciences, Hokkaido University, Japan
2 Research Institute for Humanity and Nature, Japan
3 Department of Public Health, School of Medicine, University of Zambia, Zambia
4 Department of Health Sciences, Hokkaido University, Japan
Sikopo NYAMBE
1, Koji HAYASHI
2, Joseph ZULU
3, Taro YAMAUCHI
2,4Participation of Children and Youth in Peri-Urban Communities: An Overview of Lusaka, Zambia,
Field Research Report 2016
characterized by substandard housing and squalor” (UN-Habitat 2010: 10). The majority of Lusaka’s unplanned settlements were created during colonial times as “early self-help housing” and “unauthorized housing” due to African urban employment and rural-urban migration (Mulenga 2003; Yasini 2007). For ease of reference, this paper refers to these unplanned settlements as “Communities”.
The community structure is organized under wards, which are divided into smaller zones within the land boundaries of the settlement area. Each zone elects 2 members to hold position within the Ward Development Committee at community level, and 1 councilor at government level. The key aims of the committee are to push forward community development, with the councilor being their first level government representative (Yasini 2007). As of 1974, the Zambian government moved to change the status of several of these communities from illegal unplanned settlements to improvement areas (the latter terminology used for those that have attained legal status, government provision of social and physical infrastructure and title deeds to residents).
The move from Millennium Development Goals (MDGs) to SDGs renewed the focus on child and youth civic participation as a solution to global and national challenges such as those outlined above1). However, despite over 60% of Zambia’s population being under 25 years of age, children and youth civic participation rates are low (CSO 2012; Innovations in Civic Participation 2010). A baseline study conducted by Restless Development in Central and Copperbelt provinces of Zambia revealed that 77% of interviewed youth had never been involved in any community development initiative or work. Reasons indicated were lack of information, lack of opportunity for participation and poor education (International Youth Foundation 2014).
Thus, an assessment of WASH, health and child-youth community civic participation was carried out in the peri-urban communities of Lusaka. The assessment was carried out as a preliminary investigation into the current situation of peri-urban communities in Lusaka, Zambia in preparation for a future action research study incorporating children and youth as co-researchers and change makers. It allowed for the determining of study sites and discussions with possible partners and stakeholders aimed towards later development of a workable and effective research and intervention framework for the incorporation of children and youth. The study will therefore, determine the possible challenges that will be presented for intervention to children and youth through the study.
1. Subjects and Method
1.1. Research area and subjects
A total of 9 peri-urban communities were visited in Lusaka, Zambia from August to October 2016. As unplanned and initially unauthorized settlements, these communities have had limited access to social and physical infrastructure, and utilities, e.g., schools and health facilities, water supply, electricity, roads and security services.
Since the passing of the Improvement Areas Act of 1974 aimed at the formalization and upgrading of these sites, several (but not all) peri-urban communities now have various social and physical infrastructure. Improvements in utility developments are however, slow (Mulenga 2003).
During the visits, the following locations were targeted as points of interest: (1) schools (in particular those encompassing primary level education); (2) youth centers (defined as institutions offering skills training and/or services to young people under 25 years of age); (3) government health centers; and (4) major WASH points (water
1) 70/1. Resolution adopted by the General Assembly on 25 September 2015, “Transforming our World: The 2030 Agenda on Sustainable Development”, United Nations, 21 October 2015. http://www.un.org/ga/search/view_doc.asp?symbol=A/
RES/70/1&Lang=E (Accessed August 16, 2016).
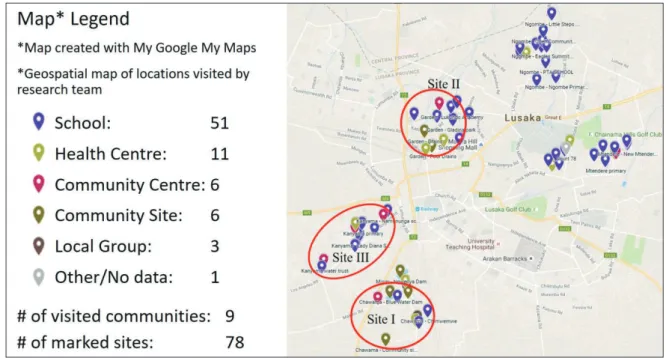
collection points, open defecation sites, etc.). Over 70 points of interest were marked in the 9 communities visited;
and 3 communities were finally selected as research sites at the end of the assessment process (Figure 1). Due to the nature of the findings, the names of the sites and their precise locations will be kept confidential.
Selection was based on availability of key social infrastructure (school, youth and health centers), site topography (leveled/rocky ground, landscape, and high/low water table; as confirmed through consultations with partners from the University of Zambia). Additionally brought under consideration was the occurrence of WASH related diseases/outbreaks (information through the visited health centers) and general observations by the 4 researchers who went on site for community assessments.
After site selection, a survey was also conducted with 318 community residents in the 3 selected sites to assess attitudes, behaviors, values and community situations pertaining to the research focus areas (WASH and health – in particular diarrheal diseases). Participants were selected via convenience sampling from various parts of the community (markets, bars, along the road, health centers, etc.). All participants were required to be residents of the community in which the survey was being conducted and were asked to give consent for the purpose of a brief 5-10 minutes interview. The target was 100 participants per community, with 5 data collectors going to 5 different parts of the communities and tasked with collecting data from a minimum of 20 community residents each. A total of 167 males and 151 females, ranging from 8 to 89 years of age participated in the study [Site I: N = 100, Site II:
N = 99, Site III: N = 119]. In total, 171 participants were under the age of 25, whilst 147 were 25 years and above.
Participants stated having lived in their specific community for a period of 2 months - 89 years.
Fig.1 Visited sites at the 3 selected sites; namely Site I, Site II and Site III (Map created using Google Maps:https://www.google.com/maps/d/edit?hl=en&mid=1Gnr05E-UNKxdCNHOlM6GnrdD45s&ll=- 15.411133324961868%2C28.304933750000032&z=12)
Figure 1. Visited sites at the 3 selected sites; namely Site I, Site II and Site III.
(Map created using Google Maps:https://www.google.com/maps/d/edit?hl=en&mid=1Gnr05E- UNKxdCNHOlM6GnrdD45s&ll=-15.411133324961868%2C28.304933750000032&z=12)
1.2. Measurements
Data were collected via the following means:
Naturalistic Observation
Initial assessments were based on viewing the regular scenario of, and mapping the sites visited as per Figure 1. This involved collecting photo footage related to WASH within visited sites. Based on the study focus, several schools, health centers and youth centers were mapped. Naturalistic observations were carried out in all 9 communities.
Interviews
Interviews were conducted with key stakeholders such as community residents, local youth, children, hospital staff, school principals and heads of youth centers in a bid to understand: (1) activities conducted at the visited facility (school, youth center, health center); (2) the state of the visited facility particularly relating to WASH (requests were also made to view WASH facilities); and (3) civic participation by children and youth in the community. For schools, questions were also asked on the education policy in relation to WASH and health, and the school curriculum. For health centers, additional queries focused on community health statistics, attitudes and behaviors relating to WASH.
The interviews ranged from 30 minutes to 1 hour 30 minutes depending on how much information the respondent was willing to share. All interviews were audio recorded, and contact information was collected from key persons (i.e., heads of schools, youth centers and health centers) willing to be involved in the research. Interviews were primarily carried out in the 3 selected sites.
WASH Survey
A WASH survey was conducted with community residents in the 3 selected sites. The survey was designed by the authors for the purpose of preliminary data to guide the planned action research study focusing on community and household WASH, health (occurrence of diarrheal disease) and the civic participation of children and youth (participation by the stated demographic in community improvement/development activities). Data collectors separated at the corners and centers of each site to assure broader convenience sampling. The survey was conducted orally: interviewees were asked questions in the language of their choice (English, Nyanja, or Bemba). A total of 15 questions were asked to residents aged 25 and over, and 17 questions to under 25 years of age. Differences in questions were on the subject of Civic Participation (child-youth participation). The interviewer would record the responses on a coded form designed for easy data entry. It took approximately 5 minutes for respondents to answer the questions.
2. Results and Discussion
Results and discussion have been categorized as follows: general WASH, water, toilet, waste disposal and others. Interview and survey results will be placed together alongside discussions.
2.1. General WASH
The major problems noted in the visited sites were those of poor access to clean water, toilets and waste disposal services. Garbage could be seen littered in the streets and drainages, and residents could be seen collecting water from dilapidated sources. Children were often found playing in unsanitary areas and several pit latrines could
be seen in yards and in the open. Fecal matter was also seen in certain open areas. These various instances and observations were not quantified, but help to replay the picture observed by the researchers through naturalistic observations within the communities.
There was a first level hospital and/or health post serving each of the selected sites. Each first level hospital had an Environmental Health Department (EHD) focused on matters of WASH and health within the community.
Interviews with the health centers revealed that the office gave WASH and health talks to those visiting the facility, and at times conducted door to door campaigns within the community usually with assistance from youth volunteers. They further revealed that small quantities of soap and chlorine were occasionally distributed free of charge to residents for the sake of handwashing and treating of water. Furthermore, health information was posted around all the health centers in both English and local languages (Figure 2).
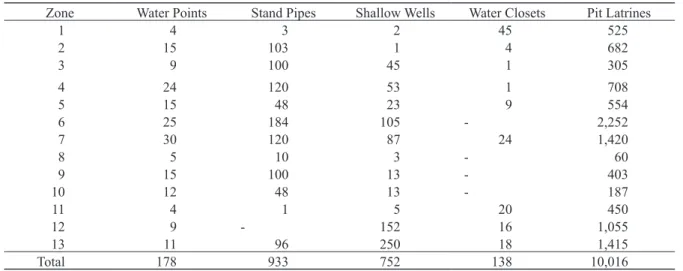
Table 1, 2 and 3 which were acquired from the EHD in Site III, highlight Site III’s population, water and sanitation facilities and retail businesses by zone. Table 1 and Table 2 data are from the year 2015 whilst Table 3 data are from the year 2010. Note that this information was not a result of the survey, but actual health data from the site. Interviews with EHD officials revealed that the status of Site III was similar to several peri-urban areas within Lusaka.
Tables 1 and 2 clearly show the imbalance between sanitation facilities and the population, indicating a population of 170,270 people having a total of only 10,016 pit latrines and 138 water closets. Regards access to water, the same population has only 178 water points, 933 stand pipes and 752 shallow wells. A breakdown of these facilities by zones can be inferred comparing the zonal data from Table 3 with Table 2. Note the population increment in the catchment from the year 2010 to 2015 is +33,330 people. Also note that Site III is one of the most densely populated communities in Lusaka.
When survey participants were asked to rate their WASH priorities, selecting their most important need amongst water, toilet and waste disposal, 60% rated water as most important. The remaining 40% was evenly divided into toilet and waste disposal (20% for toilet, 20% for waste). Results of the survey also showed that most community residents rated WASH in their community as very bad to average (Figure 3).
Water Borne Diseases
Interviews with health posts in the 3 sites of interest indicated that despite their EHD Office staff conducting WASH awareness activities within the sites, outbreaks of water borne diseases such as cholera, dysentery and typhoid happen on a yearly basis in some locations, stating a need for improvements in community WASH. The World Health Organisation (WHO) in reference to Zambia’s Cholera Country Profile went further to link yearly cholera outbreaks (usually starting in rural fishing camps and peri-urban areas) to rainfall patterns and poor/
limited access to safe water and good sanitation (WHO 2011); adding that a strong association exists between rainfall patterns and epidemic data. With poor access to water and no sewer lines running through the houses, drinking water from wells and boreholes is often contaminated through pit latrines and poorly disposed and untreated waste (UN-Habitat 2010: Ch.1).
Figure 4 shows the number of cholera cases registered by the EHD in Site III for the period 2004-2010: 3,208 cases in 2010 compared to 1,244 in 2004 with the lowest registered cases being in 2007/2008 with 401 cases. As indicated in the chart, Site III has cholera outbreaks every year. In relation to this, survey participants were asked if they recalled having ever suffered from a WASH related ailment such as cholera, dysentery, or typhoid. 49% of respondents stated that they had.
Figure 2. Poster at local hospital on cholera, Site I, Lusaka, Zambia, 23 August, 2016.
(Taken by the author)
Figure 3. General community WASH rating by residents (% and count).
Table 1. Site III Catchment Area Profile (Year: 2015).
Site I
Site II
Very bad Site III
Total 0%
57
7
13
77 98 38 66 38
51 20 31 3
45 8 34 6
2 10 1 29
10% 20% 30% 40% 50% 60% 70% 80% 90% 100%
Bad Average Good Very good
Catchment Population 170,270*
Number of Households 33,185
Households with access to safe water 21,950
Population with access to safe water 112,379
Households with access to safe excreta disposal system 10,154 Population with access to safe excreta disposal system 32,784
*Site III Main: 106,418 | Site III West: 63,852.
Figure 4. Cholera cases in Site III (2004-2010).
[Original data taken as photo footage from Site III EHD Office, Lusaka, Zambia, 28 September, 2016. (Taken by the author)]
Table 2. Water and sanitation facilities (Year: 2015, Site III).
[Original data taken as photo footage from Site III ECD Office]
Table 3. Population to community retail business ratio (Year: 2010, Site III).
[Original data taken as photo footage from Site III EHD Office]
Zone Population Households Markets Taverns Bars Shops Bakeries Butcheries
1 6,362 1,030 1 3 6 28 - 7
2 11,229 5,071 1 1 3 31 - 6
3 10,738 3,013 1 100 20 45 - 20
4 12,308 3,620 2 20 6 21 2 13
5 14,061 2,680 1 11 8 4 - 1
6 21,781 5,100 - 65 56 152 - 7
7 22,455 4,140 2 100 70 75 - 65
8 1,887 488 - 4 3 4 - -
9 8,482 2,324 - 15 10 25 - 2
10 9,295 1,644 - 10 6 2 - -
11 5,736 1,287 1 31 13 11 - 3
12 5,847 1,365 5 30 21 142 - 7
13 6,759 1,423 1 8 12 15 - 4
Total 136,940 33,185 15 398 234 555 2 135
Zone Water Points Stand Pipes Shallow Wells Water Closets Pit Latrines
1 4 3 2 45 525
2 15 103 1 4 682
3 9 100 45 1 305
4 24 120 53 1 708
5 15 48 23 9 554
6 25 184 105 - 2,252
7 30 120 87 24 1,420
8 5 10 3 - 60
9 15 100 13 - 403
10 12 48 13 - 187
11 4 1 5 20 450
12 9 - 152 16 1,055
13 11 96 250 18 1,415
Total 178 933 752 138 10,016
2004/2005 1244
0 500 1000 1500 2000 2500 3000 3500
1630
508 401
1696
3208
2005/2006 2006/2007 Season
2007/2008 2008/2009 2009/2010
2.2. Water
The WHO-UNICEF Joint Monitoring Program assesses access to clean and safe water in terms of service levels broken down into infrastructure, availability and water quality. The highest service level, “Safely managed water”
is defined as “[d] rinking water from an improved water source [piped water, boreholes or tube wells, protected dug wells, protected springs, and packaged or delivered water] that is located on premises, available when needed and free from faecal and priority chemical contamination” (WHO and UNICEF 2017: 8) .
This is followed by Basic, Limited, Unimproved and Surface Water respectively. “Surface water” and
“Unimproved” both involve the use of natural to simple water sources such as open bodies of water and unprotected dug wells respectively. Basic and Limited service levels are primarily determined by access/availability of water:
collecting drinking water from an improved source not exceeding 30 minutes (round trip to water source including queuing) for Basic level, and exceeding 30 minutes for Limited level.
In the survey, participants were asked to state their source of water (drinking water was not specified). In accordance with the aforementioned service level breakdown, results revealed that most residents had limited to basic access to water facilities. A number of residents had private taps, but the overall majority of the population accessed water outside their households. Figure 5 gives a breakdown of water sources by the percentage of residents who access them for their daily use (Total = 100% per site). Generally, visited public facilities such as schools and health centres had access to water via private taps and boreholes.
Water had different uses based on its source. For example, in Site I, several residents would wash clothes at the nearby dam. In addition, there were several cases of men bathing at such public locations and/or water holes.
Open water sources were also found to be used as waste disposal sites (Figure 6). Short interviews with residents revealed that drinking water, water for cooking and water for bathing was usually collected from taps, boreholes and wells. The water from public taps and water sellers (Figure 7) usually costs Zambian Kwacha (ZMW) 0.20- 1.00; approximately United States Dollar (USD) 0.02 for 20 litres (approximately USD 1.00 = ZMW 10.00 using 2016 USD to ZMW average exchange rate for 2016).
In the survey, 52% of residents attested to not treating their drinking water. 32% stated using chlorine, 12%
stated boiling and the remaining 4% stated using other methods to treat their drinking water. With survey results stating 49% of respondents as having suffered from a WASH related ailment, these findings raised the question
“Why don’t residents treat their drinking water (via recommended methods of chlorine or boiling) in spite of information sharing through the EHD Offices (door-to-door, through Neighborhood Health Committees, etc.), frequent disease outbreaks and/or the occasional hand out of chlorine by the health centers?”
2.3. Toilet
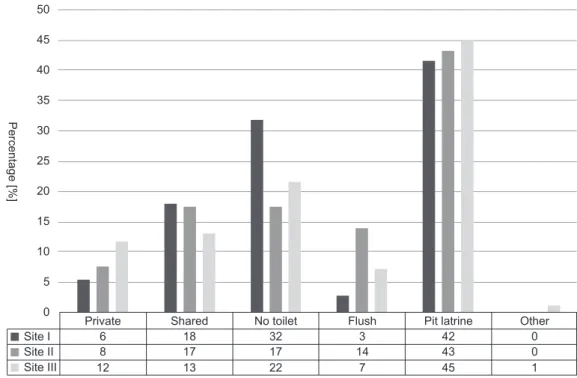
Figure 8 shows ownership and type of toilet by community as per survey results (Total = 100% per site). In total across the 3 sites, 24% of residents stated not owning a toilet, whilst 16% indicated using shared toilets. Pit latrines were the most commonly owned across all 3 sites (43%). As most homes had no private or consistent access to water, a necessity for flushing toilets, pit latrines were preferred. Still, signs of open defaecation were present. Figure 9 shows pit latrines near an open defecation site (human faeces were spotted by researchers at several locations in the area).
In interviews, residents stated there was inadequate space for building new pit latrines due to over population and limited housing space. The cost of building a toilet was approximately ZMW 3,000.00 = USD 300.00. With the lowest minimum monthly wage at ZMW 522.40 = USD 52.24 for a Domestic Worker, e.g., maid, gardener, baby sitter, calculated as basic pay ZMW 420.00 = USD 42.00 plus a transport allowance of ZMW 102.40 = USD 10.24 (Kasonde 2013), most residents argued that the cost was high.
The Public Health Act Cap 295 of the Laws of Zambia states that each house which is constructed must have a
Private Tap Site I
Site II Site III
21 0
10 20 30 40 50 60 70
31 62 4 0 3
40 2
9 23
23
52 11 1 15 1
0 1
2 0
0 Shared Tap Borehole Bottles Water Seller Well Other
Percentage [%]
Figure 5. Water Source by community (%).
Figure 6. Women washing clothing at the dam near Site I, Lusaka, Zambia, 24
August, 2016. (Taken by the author)
Figure 7. Water collection at public tap, Site I, Lusaka, Zambia, 24 August, 2016.
(Taken by the author)
toilet (Ministry of Legal Affairs 2011). However, as peri-urban communities were unplanned, this was often over looked by most home owners; and was poorly regulated by authorities. Moreover, interviews with local residents revealed that house rentals were the same price regardless of whether a toilet was present or not. With the great need for accommodation, landlords were not pressured to provide toilets for their tenants.
In the absence of toilets, and in instances where toilets were not easily accessible, many residents attested to the use of “chambers” within their households: Easily disposable, or cleanable containers for excrement, e.g., plastic bags, buckets, bottles, etc. After use, containers could be emptied into the toilet, or disposed with solid waste.
In some instances, containers would be thrown, sometimes into a neighbour’s yard or onto the roof, and hence termed “Flying toilets”.
When asked, residents stated that the cost of removing excrement from pit latrines was approximately ZMW 750.00 = USD 75.00. Depending on infrastructure quality, size and number of users, removing of waste could be done every 3-10 years. However, if infrastructure quality was poor, emptying could be difficult to impossible.
Furthermore, when buildings were too close together, waste collection vehicles were unable to reach the toilet.
Public centres such as hospitals and schools tended to use both pit latrines and flushing toilets. According to government school regulations, hired workers rather than students, were required to clean toilet facilities. Hired workers were also the toilet cleaners at the health facilities. At some schools, students were asked to bring toilet paper and soap to add to school supplies; and in most cases, students and teachers did not use the same toilets. In several cases, it was noticed that teachers used flushing toilets whilst students used pit latrines. Where flush toilets were present, often a container of water was also present to aid in flushing at times when water was unavailable.
A discussion with one of the head teachers from the schools revealed that toilet use was a challenge, particularly for younger children. As toilet training is done differently based on the type of toilet one owns and parental guidance, children often had to be taught how to use the toilet. The particular school used flushing toilets. With most students using pit latrines within their homes, using flush toilets was a challenge.
Private Site I
Site II Site III
6 0
5 10 15 20 25 30 35 40 45 50
8 17 17 14
7 22
13 12
18 32 3 42
43 0
1 45
0
Shared No toilet Flush Pit latrine Other
Percentage [%]
Figure 8. Toilet type and ownership by community (%).
2.4. Waste Disposal
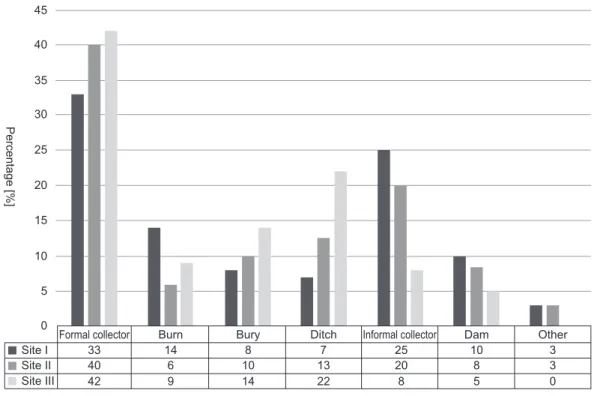
The visited communities clearly had challenges with waste disposal, with waste being visible in drainages and open spaces (Figure 10). When interviewed on waste disposal, most residents stated using formal waste collectors, usually via Lusaka City Council. However, spotted disposal sites were usually full of waste, which residents explained, was collected inconsistently by the municipality. Our findings cited the second most common form of waste disposal (25% in Site I, 20% in Site II) as being via informal collectors (Figure 11). Despite being unregulated, informal collectors were stated to be a cheaper, more accessible waste disposal solution for community residents. Still, several aspects such as the mode of collection of waste, treatment of waste and movement of waste were often overlooked.
In Site III, many residents attested to the use of ditches for throwing waste. This is a banned practise however, due to the impact of burying non-degradable waste on the environment. There have also been several accidents of pit latrines caving in due to their being set up on and/or near former and/or existing ditches. Even so, the ban is not regulated. Several residents living near dams also use these water locations to dispose of waste (Figure 12).
The overall breakdown of results obtained from the survey on waste disposal is indicated in Figure 13 (Total = 100% per site).
Site II has an interesting waste disposal scenario. The Lusaka Water and Sewerage Company has their sewer treatment plant in the midst of Site II, with certain areas being easily accessible to the public. Additionally, there is a strong stench near the wastewater ponds. Some residents have made use of the wastewater to water their gardens, as several gardens and wells surround the ponds. Subsistence crops such as tomatoes, green vegetables and maize are grown for family use and sale (Figure 14).
Figure 9. Red circles are pit latrines, blue circle is an open defecation site, Lusaka, Zambia, 24 August, 2016. (Taken by the author)
Figure 10.
(a) Waste disposed in water drainage along the roadside, Site I, Lusaka, Zambia, 22 August, 2016.
(b) Child playing near waste on the streets outside home, Site III, Lusaka, Zambia, 24 August, 2016.
(c) Waste disposal site under Lusaka City Council, Lusaka, Zambia, 28 August, 2016.
(Taken by the author) (a)
(c)
(b)
Figure 11. Informal waste collector, Site III, Lusaka, Zambia, 14 September,
2016. (Taken by the author)
Figure 12. Waste disposal in the dam, Site I, Lusaka, Zambia, 24 August, 2016.
(Taken by the author)
2.5. Child and Youth Civic Participation
As stated in the introduction, this study was used to inform a future Child-Youth Participatory Action Research Study aimed at encouraging the civic participation of children and youth within their communities. The participation process for the upcoming study will focus on co-research by child and youth participants on WASH (problem finding, analysis and intervention development).
Kearns et al. (2012) cited two definitions of “civic participation”:
“…individual or collective actions in which people participate to improve the well-being of communities or society in general, and which provide opportunities for reflection… [and]…
an expression of young people as social actors, and the contributions they already make in society or in their ‘practices as citizens’.” (Kearns et al. 2012: 3)
Formal collector Site I
Site II Site III
33 0
5 10 15 20 25 30 35 40 45
40 6 10 13 20
8 22
14 9
42
14 8 7 25 10
8 3
0 5
Burn Bury Ditch Informal collector Dam Other3
Percentage [%]
Figure 13. Waste disposal method by community (%).
Figure 14.
(a) Tomatoes grown around the sewer (Site II), Lusaka, Zambia, 8 September, 2016.
(b) Waste water pumped into the sewer (Site II), Lusaka, Zambia, 3 September, 2016.
(Taken by the author)
(a) (b)
Several authors have written about the need for young people to be civically engaged, and the benefits to these participants and society at large: community development, identification of individual strengths and abilities.
However, frameworks/models/programs for inclusion are lacking (Foster-Fishman et al. 2010; Riemer et al. 2016).
As such, one of the aims of future research is to develop a sustainable framework to facilitate the incorporation of children and youth in civic activities (in this case, relating to WASH) in Zambia. In addition to household and community WASH, the study will examine the participation process and impacts on children and youth, and community engagement and impact.
Based on the importance of civic participation to the planned research study, children and youth participants of the survey were asked about their civic participation: if they helped to make their community better and how;
and if they volunteered in their communities, were a member of any civic groups and what exactly their role was.
Out of 171 children and youth who took part in the survey (aged 8-24 years), 65% stated being involved in a civic activities within their community. On further interrogation, only 66% of those who attested to being engaged in civic activities could state their exact involvement. The majority however, mentioned being involved in sport, e.g., playing football; indicating a lack of understanding of what it meant to be civically engaged. Examples of reasons registered for non-participation were being in school, or being a parent.
Adults (25 years and above) were also asked about the civic participation of young people in their communities.
In interviews with this demographic, respondents stated that most young people were not interested in civic activities. Lack of employment, substance abuse, illiteracy and poor education were various youth concerns raised by older community residents. These concerns were also raised through interviews with staff at the various youth centers visited; and were documented by the Zambian government in their 2015 National Youth Policy (Ministry of Youth and Sport 2015).
Health centers highlighted young people’s abilities to assist their communities, referring to Youth Friendly Corners available at the facilities, and run by youth, to allow for a non-judgmental environment for other young people seeking health information. Interviews with residents and institutional staff revealed a general acceptance of the benefits of incorporating youth in community development. The hospital mentioned working with youth volunteers on sensitization exercises involving drama and door to door visits, praising their openness, energy and agility. There were however, a few examples of cases in which concerns were raised: e.g., collecting basic health information and learning from children. Adults were asked during the survey, if they felt they could learn something from children. 51% of adults said they could not learn from children. 47% of adult respondents said they could.
These mixed results might prove a challenge for the children as they commence the action research study.
Conclusion
In conclusion, there is a real challenge on aspects of WASH and health in peri-urban Lusaka, Zambia. Being unplanned settlements, access to clean water, toilet and waste disposal facilities are generally low for community residents. Despite regular disease outbreaks, combative health practices to counter the outbreaks were equally relatively low. Child and youth civic participation was also poor within their communities, with most not understanding the concept.
Overall, the results highlight the challenge and opportunity that the children and youth will face in the upcoming Child-Youth Participatory Action Research Study. Via the study, children and youth will have the opportunity to impact the broader community on matters of WASH and health by offering community sensitization and local intervention.
The future study will therefore, also examine the benefits of incorporation to children and youth themselves, with the hope of offering new insights into how these young people can impact the sanitation value chain.
Acknowledgments
The authors would like to acknowledge all the respondents to the interviews and surveys. Special thanks also goes to the heads of schools, health and youth centers visited in the three main research sites, the various assistants and willing partners for their support and advice, and the Nitobe School Frontier Foundation Sponsors for their financial support to the project. Our activities are supported by “The Sanitation Value Chain: Designing Sanitation Systems as Eco-Community Value System” Project, Research Institute for Humanity and Nature (RIHN, a constituent member of NIHU, Project No.14200107).
References
CSO (Central Statistical Office) 2012. Zambia 2010 Census of Population and Housing: National Analytical Report. Central Statistical Office (Zambia), Lusaka.
― 2016. 2015 Living Conditions Monitoring Survey (LCMS) Report. Central Statistical Office (Zambia), Lusaka.
Online. https://www.zamstats.gov.zm/phocadownload/Living_Conditions/2015%20Living%20Conditions%20 Monitoring%20Survey%20Report.pdf (Accessed October 15, 2018).
Foster-Fishman, P. G., Law, K. M., Lichty, L. F. and Aoun, C. 2010. Youth ReACT for social change: A method for youth participatory action research. American Journal of Community Psychology 46 (1): 67-83.
Innovations in Civic Participation 2010. Youth civic participation in action: Meeting community and Youth needs worldwide. Innovations in Civic Participation, Washington DC.
International Youth Foundation 2014. A Cross-Sector Analysis of Youth in Zambia. Online. http://www.iyfnet.org/
sites/default/files/library/YouthMap-Zambia_Analysis.pdf (Accessed January 10, 2016).
Kasonde, C. 2013. The challenges of minimum wage policy: a Zambian perspective. Master’s dissertation, Economic Development in the Social Economy and Labour Area, Universidade Estadual de Campinas, Campinas.
Kearns, N., Brennan, M., McGrath, B., Kennan, D., Brady, B., Shaw, A. and Dolan, P. 2012. Understanding Youth Civic Engagement: Debates, discourses and lessons from practice. Unesco Child and Family Centre, Galway.
Ministry of Legal Affairs 2011. The Public Health Act Chapter 295 of The Laws of Zambia. Government of the Republic of Zambia, Lusaka.
Ministry of Youth and Sport 2015. 2015 National Youth Policy. Government of the Republic of Zambia, Lusaka.
Mulenga, C. L. 2003. Urban Slums Reports: The case of Lusaka, Zambia. Institute of Economic and Social Research, University of Zambia, Lusaka. Online. https://www.ucl.ac.uk/dpu-projects/Global_Report/pdfs/
Lusaka.pdf (Accessed July 30, 2018).
Riemer, M., Voorhees, C., Dittmer, L., Alisat, S., Alam, N., Sayal, R., Bidisha, S. H., De Souza, A., Lynes, J.
Metternich, A., Mugagga, F. and Schweizer-Ries, P. 2016. The Youth Leading Environmental Change Project:
A Mixed-Method Longitudinal Study across Six Countries. Ecopsychology 8 (3): 174-187.
UN-Habitat (United Nations Human Settlements Programme) 2010. The Challenge of Slums: Global Report on Human Settlements 2003. Earthscan Publications Ltd., London.
WHO (World Health Organisation) 2011. Cholera Country Profile : Zambia. Global Task Force Cholera Control, WHO, Last update: 3 February 2011. Online. https://www.who.int/cholera/countries/ZambiaCountryProfile2011.
pdf (Accessed March 30, 2018).
WHO (World Health Organisation) and UNICEF (United Nations International Children’s Education Fund) 2017. Progress on Drinking Water, Sanitation and Hygiene: 2017 Update and SDG Baselines. UNICEF and WHO, Geneva. Online. https://www.unicef.org/publications/files/Progress_on_Drinking_Water_Sanitation_and_
Hygiene_2017.pdf (Accessed April 26, 2018).
Yasini, M. 2007. A Profile of Unplanned Settlements in Lusaka. Lusaka City Council Research Unit, Lusaka.
Online. http://naturalsciences.unza.zm/curp/wp-content/uploads/2017/03/A-PROFILE-OF-UNPLANNED- SETTLEMENTS.pdf (Accessed September 23, 2018).