く研究ノート〉
アンケート調査一質問事項の翻訳に関する一考察
坂 本 政 子*
The Effect of Translating Survey Questions
Masako Sakamoto
事草 笛 アンケート調査のデータに基づく研究は, これまで多種の分野で行われ, 外国語語学教育の
分野も例外ではない。 プンケートによるデータ収集合する際, より正確なデータを得るとし、う理由で研 究者の中には, そのアンケート解答者の母語に訳し調査を行うケースも少なくない。 本稿では, 英語で 書かれたアンケ…トを日本語に訳し調査することで, 日本人英語学習者からより正確なデータを得るこ とが可能かを考察した。 又, 英語とその日本語訳とのアンケートの解答に差異が生じた場合, f可がその 婆留になりうるのかを考察してみた。 一試みとして, Hyland (1994)の研究 (日本入学生の学習スタ イノレ)の中で, 実際に使用された英語のアンケートとその日本語訳版を, ヌド学の三年生65名に解答して もらった。 その結果, 解答した約半数の学生が英語と日本語のアンケートに異なる解答をした。 その要 因として考えられるのは, 英語と日本語の持つ言語約特質, 翻訳がもたらす微妙な影響, さらにはアン ケート調査そのものが持つ特異性などが影響をし このような差異が生じたものと推測さられるが, こ れらの要閣については今後より綿密な研究が必要とされる。
Survey research has been used by researchers in fìelds such as politics, economics, sociology and education. According to Cohen and Manion (1985), surveys are the most commonly used descrip
tive method in educational research. In foreign language teaching, survey research is also often con附 ducted to investigate a group's characteristics, learning style preferences, attitudes, levels of motiω vation, etc. When surveys are conducted, there are several not-to働be-overlooked issues involved in constructing adequate and useful survey questions (see AηT 1990, Brown 1995, ]ohnson 1992 and Nunan 1992). One of the issues exists in translating survey questions from one language to another.
Some researchers in foreign language teaching use translated questionnaires to make sure their respondents understand and answer the questions they ask. The intention is good but this translat開 ing effort might not guarantee more “accurate" results. In this paper, I will explore: (1) whether a translated questionnaire in ]apanese assesses the same variables as the original English version;
and (2) if survey participants answer the same question differently in ]apanese and English, what might have influenced them to do so昏
*ヌド学効教授 英語教授法 (TESOL)
253-
Method Subjects
The participants in this study were two groups of juniors (20-22 years old) of Bunka羽Tomen's University. The one group consisted of 23 students majoring in intercultural studies and taking an English reading class at the time of the study. The other participants were a mixed group of 42 stu
dents majoring in intercultural studies or English and English literature, but they were all enrolled in the English teacher-training program. They generally shar巴d quite similar backgrounds in En
glish education, that is, 6 years of high-school English before they entered the university, and since then they had been taking more or less similar English language classes for about three years. 1n the fall of 1995, they all experienced one-month homestay in the United States. Right after they came back to ]apan, they took the TOE1C at the end of October. Their results were as follows: the mean of the students' scores in the reading group was 461 and the mean of the students' scores of the teacher-training group was 451. After the test, they participated in this study, in November,
1995.
Materials
Reid's (1987) perceptual learning style preference questionnaire (see Appendix A and B) was used. The questionnai1'e consists of randomly ar1'anged sets of fìve statements on each preference there a1'e 6 different learning style preferences: visual, audito1'Y, kinesthetic, tactile, group and in
dividual. The questionnaire was validated by Reid by the splitωhalf method and cor1'elation analysis of an original set of 60 statements. The background info1'mation items were slightly am巴nded by Hyland (1994) and me to make it more 1'elevant to ]apanese learne1's. 1n this study, Hyland's trans
lated questionnaire statements in ]apanese (see Appendix C) were used, but 1 re-t1'anslated four of them, CStatement 5, 11, 12 and 26) since these translated statements might be misleading fo1' the participants of this study. The clarity of the re-t1'anslated statements were checked by th1'ee teachers of ]apanese as a second language. The literal meanings of the four English statements were explained orally to the teachers, and then they checked the 1'e-translated statements in ]apanese. After the clarity and app1'op1'iateness of the statements were confì1'med, they were back
translated by a bilingual, and the o1'iginal statements in English and the back-t1'anslated ones were checked to see if they we1'e the same.
Procedures
1n orde1' to reduce the possibility that the pa1'ticipants might remember their answers to the state
ments, th巴 survey was conducted with a one-week interval between the two ve1'sions of the study.
The fìrst group consisting of the 4 3 students taking the teacher-training program was given at 1'an
dom eithe1' the English 01' the ]apanese version of the questionnaire: 20 questionnaires in English
and 2 3 in ]apanese were distributed. Before they started answering the questionnaire, they were
reminded that they should 1'espond to each statement quickly without too much thought and try not
アンケート調査一質問事項の翻訳に関する一考察
to change the responses they chose. This was actually written in the directions of the questionnaire,
but I made it clear. The majority of the students who answered the Japanese version :finished much earlier (less than 7 to 8 minutes) than those who answered the English version (more than 10 to 12 minutes) . A week later each of the students responded to the other version. The similar phenomerト on in terms of time that they needed to complete the questionnaires was observed.
The other group ∞nsisting of 27 students wぉall given the same English version :first, then a week later the Japanese version. This group took at least 15 minutes to :finish answering the En
glish version but was able to :finish the Japanese version in much less time, about 7 to 8 minutes.
Analyses/Results
Since it took two weeks to ∞mplete the two versions of the questionnaire in this study, there were several students who were unable to attend both of the versions. The attendance rate of the teacher-training group was quite high, 93 p巴rcent, but an 87 percent was achieved by the reading group. Those 65 (42十23) respondents' answers were analyzed as follows.
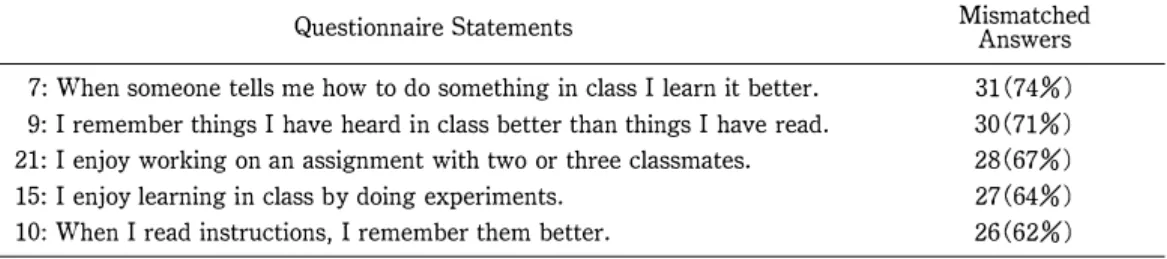
First, each student's 30 answ町s were ch巴cked to see if the student answered differently in the Japanese and English version; that is, if she marked different items on the Likert Scale- “strongly agree" to “strongly disagree"一in English and J apanese for the same statement. Then mismatched answers were tallied for each statement and sorted in the two groups. Table 1 shows the top企ve mismatched answers and the correspondent questionnaire sta匂ments.
Having tallied and sorted all the answers to the 30 statements, I discovered that about half of the 65 participants answered the same questionnaire statements differently in English and Japanese.
There might be several factors to explain this discrepancy. One of them may be due to the par
ticipants' lack of reading ∞mprehension ability to complete this type of questionnaire in English-
Table 1 The Top Five Mismatched Answers in English and Japanese
hαcheト釣・αining Group (42 students)
Questionnair邑 Statements
7: When someone tells me how to do something in class 1 learn it bett巴r.
9: 1 remember things 1 have heard in class better than things 1 have read.
21: 1 enjoy working on an assignm巴nt with two or three classmates.
15: 1 enjoy learning in class by doing experiments.
10: When 1 read instructions,
1remember them better.
Reading Gmup (23 students)
Qu邑stionnaire Statements 10: When 1 read instructions, 1 r邑member them better.
14: 1 learn more when 1 make something for a class project.
27: In class, 1 learn better wh巴n
1work alone.
3: 1 get more work done when 1 work with others.
24: 1 learn better by reading than by listening to someone.
255-
Mismatched Answers 31(74%) 30(71%) 28(67%) 27(64%) 26(62%)
Mismatched
Answers
16(70%)
16(70%)
16(70%)
15(65%)
15(65%)
the directions instructed the participants to respond to each statement quickly without too much thought. Both groups took about twice as much time when they read and answered the English ver田 sion. 1 personally think that in terms of time they needed, it was quite natural since they were second language learners. However, considering the fact that they had to push them through to an
swer the questions quickly in English, they might have responded to some of the questions incor
rectly. This, however, does not mean to say that the responses of the ]apanese version were more reflective of what the respondents meant because it was not certain if the translation of the question
naire truly represented the English version. It is almost impossible to translate one language to another without losing some degree of information. In short, if these data were used to assess ]apanese language learners' learning style preferences, reliable conclusions could not be drawn.
Nevertheless, Hyland (1994) tried to understand ]apanese students, in terms of learning style preferences and used both versions of the questionnaire for his study. He concluded that “]apanese students do not favor any major learning style, but instead reveal preferences for a cluster of minor・
learning modalities: tactile, kinesthetic, and auditory" (p. 55).
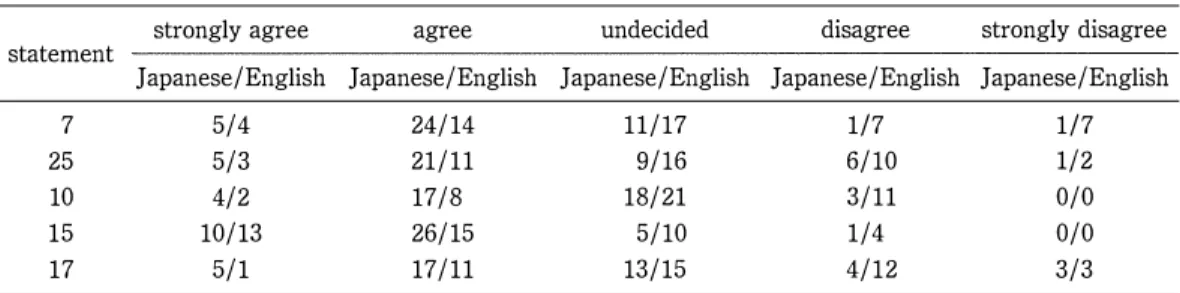
In order to demonstrate how dangerous it is to use these data, 1 have selected the top five ques
tionnaire statements which showed the most discrepancy (Table 2). 1 arrived at thes巴 by calculat
ing the difference between the answers in ]apanese and English for each Likert Scale item, and then totaling them for each statement. By looking only at the discrepancy, we can learn that cal四 culating these results into figures, (strongly agree 5 to strongly disagree 1) , would not give us relia
ble nor meaningful findings.
Table 2 The Top Five Most Discrepant Statements
Teαcheト針αining Group (42 students)
strongly agree agree undecided disagree strongly disagree
statement
Japanese(English Japanese(English Japanese(English Japanese(English Japanese(English
7 5(4 24(14 11(17 1/7 1/7
25 5(3 21(11 9(16 6(10 1(2
10 4(2 17(8 18(21 3(11 0(0
15 10(13 26(15 5(10 1(4 0(0
17 5(1 17(11 13(15 4(12 3(3
Note.
Questionnaire Statement 7: When someone tells me how to do something in class, 1 learn it better. Q.S.
25: 1 enjoy making something for a class project. Q.S.10: Wh邑n
1read instructions, 1 remember them
better. Q.S.15: 1 enjoy learning in class by doing experiments. Q.S.17: 1 learn better in class when the
teacher gives lecture.
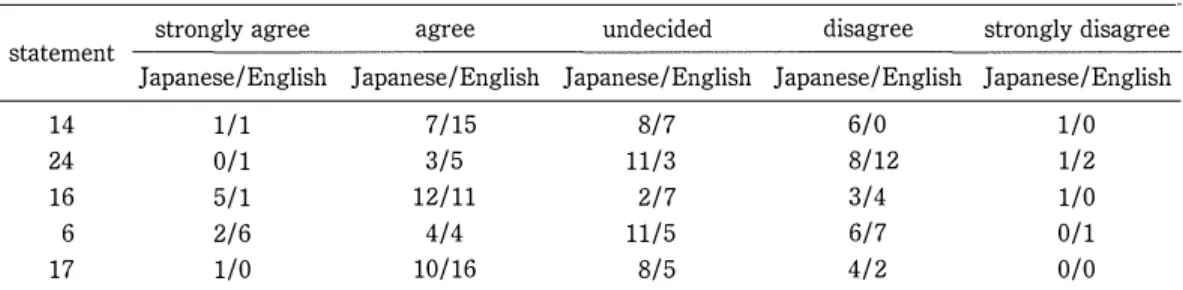
アンケート調査 質問事項の翻訳に関する一考察 Reαding Group (23 students)
strongly agree agree undecided disagree strongly disagree
statement
Japanese/English Japanese/English Japanese/English Japanese/English Japanese/English
14 1/1 7/15 8/7 6/0 1/0
24 0/1 3/5 11/3 8/12 1/2
16 5/1 12/11 2/7 3/4 1/0
6 2/6 4/4 11/5 6/7 0/1
17 1/0 10/16 8/5 4/2 0/0
Note.
Questionnaire Statement 14: 1 learn more when 1 make something for a class project. Q.S. 24:
1learn bet
ter by reading than by listening to som巴one. Q.S. 16: 1 learn better when 1 make drawings as 1 study.
Q.S. 6: 1 learn better by reading what the teach巴r writes on the board. Q.S. 17: 1 learn better in class when the teacher gives lecture.
The above results indicate a great discrepancy in English and Japanese. Consequently, the next logical question is what might have caused this phenomenon. 1s this due to the linguistic ability of the participants? The following (Table 3) shows six sample students' answers to the questionnaire statements and their TOE1C scores. 1 have selected three students from each group-two students who attained the highest TOE1C scores, two students who attained average scores and two who got the lowest scores.
Table 3 TOEIC Scores and Discrepancy
Student Listening Reading Total Mismatch邑d Answers
Student A 425 265 690 19 out of 30
Student B 375 310 685 12 out of 30
Student C 200 260 460 13 out of 30
Student D 210 240 450 21 out of 30
Student E 210 110 320 21 out of 30
Student F 195 125 320 19 out of 30
Student B had the fewest mismatched answers, 12 out of 30 and her TOE1C reading score was the highest, 310, but this would not allow us to conclude that reading ability in English was the most crucial element in answering these questionnaire statements more “accurately" in English. Be
cause Student F who had the lowest reading score, 125, produced the same number of mismatched answers, 19 as Student A who made the second highest reading score, 265. It does not seem clear here why those two students who had a 140-point difference in the reading part of the test created the same number of mismatched answers. There could be other factors that might have infiuenced this incomprehensible result beside reading profìciency in English.
To show to what degree those 6 sample students answered differently in English and Japanese, 1 have picked completely opposite responses that they made, for example answering “agree" in En-
- 257-
glish but “disagree" in Japanese for some reason. The following are the resu1ts.
Table
4
Opposite AnswersStudent
A(TOEIC 690) / Student
B(TOEIC 685)
Q.S. 6: 1 learn better by r巴ading what the teacher writes on the board.
Q.S. 26: 1 learn best in class when 1 can participate in r巴lated activities.
Q.S. 8:明治巴n 1 do things in class, 1 learn better.
Q.S. 16: 1 learn better when 1 make drawings as 1 study.
Q.S. 27: In class, 1 learn better when 1 work alone.
Student C (TOEIC 460) / Student
D(TOEIC 450)
Q.S. 26: 1 learn best in class when 1 can participate in related activities.
Q.S. 4: 1 learn more when 1 study with others.
Q.S. 20: 1 learn better in class when 1 listen to someone Q.S. 24: 1 learn b己tter by reading than by listening to someone.
Student
F(TOEIC 320)
Q.S. 20・ 1 learn better in class when 1 list巴n to someone.
English disagree strongly agree agree disagree disagree English agree agr己e agree disagree English disagree
Note.Student E (TOEIC 320) did not produce any completely opposite answ巴1".
Jαpαnese agree disagre巴 disagree
agree agree Jαpαnese
disagree disagree disagree agr巴巴 Japαnese
agree
How cou1d these comp1ete1y opposite answers be ana1yzed and exp1ained? It is obvious that the respondents interpreted the above statements different1y in Eng1ish and Japanese or maybe simp1y misinterpreted. According to Ary (1990) “A disadvantage of the questionnaire is the possibility of misinterpretation of the questions by the respondents" (p. 421). The same thing cou1d be said about trans1ated questions in surveys. Since it is a1most impossib1e to trans1ate everything exact1y from Eng1ish into Japanese, the researcher has to admit some 10ss of information through trans1a
tion. Nida points out that:
The question of untrans1atability has too often been discussed in terms of abso1ute rather than re1- ative equiva1ence. If one is to insist that trans1ation must invo1ve no 10ss of communication what
soever, then obvious1y not on1y trans1ating but all communication is impossib1e. No communica
tion, wheth巴r intra1ingua1, interlingua1, or intersemiotic, can occur without some 10ss of informa
tion.
(as cited in Brannen, 1994, p. 14)
One must decide whether to use the origina1 version of survey questions or the trans1ated one: the
researcher must weigh the 10ss of information in both versions. If the questionnaire in Eng1ish
might be too di伍cu1t for the respondents to understand and answer, the trans1ated version cou1d be
appropriate. However, the researcher still needs to thorough1y examine his respondents before
starting his survey to decide which version is best for the respondents so that he/ she can obtain the
アンケート調査 質問事項の綴訳に関するーヨ号察
most adequate data from them. It seems crucial to assess what type of respondents the researcher has and find the best questionnaire for them rather than simply translating survey questions from one language to another.
There is another way to look at all the results, that is, the veηT high discrepancy in this study.
This discrepancy may be partially a resulf of the effect of both languages. It is possible that the respondents became less “Japanese" when they read the questionnaire statements in English. Less
“Japanese" is an ambiguous term but what I mean here is that the respondents may have not responded to the statements in the way thεy usually answered in Japanese. Also each language en
vironment triggers different reflexes, responses, memories, etc. In short, in many ways, people are quite different depending on the language they are engaged in at a given time. The following study might explain what less “Japanese" means more clearly. Ervin♂ripp's (1964) study illustrates that Japanese might respond to the same question differently in English and Japanese. In her study,
the informants heard (and read) the first half of the sentence. The same Japanese woman's responses in both languages are cited below:
1. WHEN MY WI SHES CONFLICT WITH MY FAMILY. . . (Japanese) it is a time of gr巴at unhappiness.
(English) I do what I want.
2. I WILL PROBABLY BECOME.
• •(Japanese) a housewife.
(English) 呂teacher.
3. REAL FRIENDS S HOULD. . . (Japanese) help each other.
(English) be very frank. (p. 96)
Ervin-Tripp (1964) discovered that “when the sentences were weighted by their frequency in the American and Japanese monolingual comparison groups, the bilingual women's sentences were signi盆cantly less ‘Japanese' in content when the women spoke English." According to the author,
“this change in content could not be simulated by women who did not change language but were in鴫 structed to give ‘typical J apanese' or‘typical American' answers at the two sessions. Thus, the change in the association and the sentence completions is an effect of language, not of self-instruc
tion or set" (p. 96).
Her study illustrates Japanese possibly change their replies to the same question depending on the language, English or Japanese, they use. (This characteristic of Japan巴se seems very deep and complex; therefore, it is beyond description in this paper. However, further study is definitely worth pursuing.) In other words, a researcher who decides to translate English survey questions into Japanese needs to keep in mind at least two things: (1) the nature of English and Japanese, and
(2) translatability-loss of information.
259-
Conclusion
Clearly, there were di妊erences betw巴en the questionnaire results in English and Japanese. The high discrepancy in this study warns us that the researcher should not simply consider translation as the answer to help the respondent understand the questionnaire better. Furthermore, the resear
cher ought to know that even original survey questions can be misinterpreted by the respondents. It is worth remembering that if surveys are to be e妊ective and successful, the researcher needs to weigh all factors which might affect the survey result.
Further Research
The mismatched answers found in this study require that researchers investigate the following:
1. If language learners are asked about their learning style prefer官lces twice in a short time period, wi11 they answer differently even in their native language? (Since the discrepancy rate was very high in this study, I wonder if respondents give di笠erent answers to the same question even if they were asked twice in their native language in a short time period, in a week or so.)
2. It would be worth exploring other crucial variables such as those illustrated in the Ervin
Tripp's study of the bilingual Japanese woman that may account for discrepancy between the answers of a questionnaire in English and J apanese.
References
Ary, D., Jacobs, L. C.
&Razavieh, A. (1990).
Introduction to research in education(4 th ed.). Fort Worth:
Harcourt Brace Coll巴ge Publishers.
Brannen, N. S. (1994). Functional equivalence translation.
Journal 01 B,仰ka Women注目ûversiか,2,1-15.
Brown, J. D. (1995).
The elemenお01 la河:guage curriculum: A systematic approach to program development.Boston: Heinle
&Heinle Publishers.
Cohen, L.,
&Manion, L. (1985).
Research methods in education.London: Croom Helm.
Ervin-Tripp, S. (1964). An analysis of the interaction of language, topic, and listener.
American Anthropologist, 66,86-102.
Hyland,
K.(1994). The learning style of J apanese students.ル4.1二T
Journal, 16,55-74.
Johnson, D. (1992).
A良少roaches to research in second language learning.New York: Longman.
Nunan, D. (1992).
Research methods 仇la河♂tage learning.New York: Cambridge University Press.
Reid, J. M. (1987). The learning style preferences of ESL students.
TESOL Quarterly, 21(1),87-109.
アンケート調査一質問事項の翻訳に関する一考察
Appendix A
Perceptual Learning Style Preference Questionnaire
Name
Place of Study: High School University
Age Male/Female
year year What is your major field?
How long have you studied English in Japan?
Have you ever studied English overseas?
If yes, for how long?
Have you ever been taught by a foreign teacher?
If yes, for how long?
Directions:
People learn in many different ways. For example, some people learn mainly with their eyes (visual learn
ers) or with their ears (auditory learners); some people prefer to learn by experience and/or “hands-on"
tasks (kinesthetic or tactile learners); some people learn better when they work alone, while others prefer to work in groups. This questionnaire has been designed to help you identify the way(s) you learn best一一the way(s) you prefer to learn.
Read each statem巴nt below. Please respond to the statements AS THEY APPLY TO YOUR STUDY OF ENGLISH. Decide whether you strongly agree, agree, undecided, disagree, or strongly disagree. Mark an
Xin the appropriate column.
Please respond to each statement quickly without too much thought. Try not to change your responses af
ter you choose them. Please use a pen to mark your choices.
au qL
10. 11. 12. 13. 14. 15. 16 17. 18. 19. 20. 21. 22. 23. 24. 25. 26 27 28. 29. 30.
Appendix B Questionnaire Statements
strongly agree 12 vd氾 gn
ng oa ti rs
S喝GE 。しVA σo
a
-I na JU JU ρし τnu -Pしau tnu a nu ぬしρiv rA σゐau1. When the teacher tells me the instructions, 1 understand better. 2. 1 pr巴fer to learn by doing something in class. 3. 1 g巴t more work done when 1 work with others. 4. 1 learn more when 1 study with a group. 5. In class, 1 learn best when 1 study with others. 6. 1 learn better by reading what the teacher writes on the board. 7. Wh巴n someone tells me how to do something in class, 1 learn it better. 8. When 1 do things in class, 1 learn better. 9. 1 remember things 1 have heard in class better than things 1 have read. When 1 read instructions, 1 remember them better. 1 learn more when 1 can make a model of something. 1 understand better‘when 1 read instructions. When 1 study alone, 1 remember things better. 1 learn more when 1 make something for a class project. 1 enjoy learning in class by doing exp巴riments. 1 learn better when 1 malぼ drawings as 1 study. 1 learn better in class when the t芭acher giv日s a lecture. When 1 work alone, 1 learn better. 1 understand things better in class wh巴n 1 participate in role playing. 1 learn better in class when 1 listen to someone. 1 enjoy working on an assignment with two or three classmates. When 1 build something, 1 rem己mber what 1 have learned better. 1 prefer to study with others. 1 learn better by r己ading than by listening to someone. 1 enjoy making something for a class project. 1 learn best in class wh巴n 1 can participat邑 m r邑lated activities. In class, 1 learn better when 1 work alone. 1 prefer working on projects by myself. 1 1田rn more by reading textbooks than by listening to lectures. 1 prefer to work by myself.
Appendix C アンケート
U14\守 プ叫岨凶仰i溺遇制溺見)議制河町打湿斗NVi持制刷
どちら そう 強くそう でもない 思わない 思わない
11そう思う 強く そう思う 先生がやり方を説明してくれるとわかりやすい。 クラスでなにかをやりながら学習するのが好き で ある。 ほかの学生とー絡になにかをやるほうが能率的に学習できるo グルー プ 学習のほうが効果的に学べる 。 授業の中で , ほかの学生と一緒に学習する時が , 一番良く学べる。 先生が黒板に書いたものを読むほうが , 良く学べる。 クラスで誰かにやり方を教えてもらうほうが , 良く学べる。 クラスでなにかをやると良く学べる。 クラスで、開いた事のほうが, 読んだことよりも良く覚えている。 読んだときのほうが説明を良く覚えている。 なにかを学習する持, その モデノレを作ったほうが効楽的に学べる 。 説明を読んだほうが良く理解できる。 一人で学習するほうが物事を良く覚えられる。 クラス の 諜題でなにかを作成するほうが良く学べる。 クラスで何か実験をしながら学習するのが好きだ。 図などを描きながら勉強するほうが良く学べる。 先生が講義をするほうが良く学べる。 一人でやるほうが良く学べる。 クラスでロ ー ノレプレイ をやるほうが良く物事が理解できる。 クラスで誰かの話を聞くほうが良く学べる。 2, 3人の クラスメートと 一緒に ひ とつのア サイ ン メ ントをやるのが好きだ。 何かを作ると , 学習したこと良く覚えている。 ほかの学生と一緒に勉強するほうが好きだ。 人のいうことを潤くより , 読むほうがよく学べる。 クラス の 諜題として何かを作成するのが好きだ。 クラスで, 授業の内容と関連のある学習活 動 (class activities) に参加する と , 一番良く 学べる。
クラスでは一人のほうが良く学べる
。 一人で課題に取り組むほうが好きだ。 講義を開くより教科書を読んだほうが良く学べる。 一人で勉強するほうが好きだ。
•• ••••••••••••• •• •
-&ワ臼令、υ4AFUρb 7aQOQJAV--つ臼つdバ吐' -At--A14唱11i1ム宅BA--ームヮ“つ臼ヮ“つ臼nLqLっ“つμnLnL今、υ ADハb7eoonuAU1ムつ臼QU4AFUFO ヴtQUQUAU
ふコ σ》 む3