Comparative biochemistry studies of the energy metabolism in large animals
Yasuko Hirakawa
Nippon Veterinary and Life Science University 2016
Supervisor
Toshiro Arai
Table of Contents
Introduction ……… 3
Chapter 1 Cholesterol Lipoprotein Profiles of Large Animals --- 8 1-1 Introduction
1-2 Materials and Methods 1-3 Results
1-4 Discussion 1-5 Conclusion
Chapter 2 Comparison of Energy Metabolism and LDH Isoenzyme Patterns in Large Animals --- 17 2-1 Introduction
2-2 Materials and Methods 2-3 Results
2-4 Discussion 2-5 Conclusion
Chapter 3 The Aging Effect on the Metabolic System in Riding Horses --- 36 3-1 Introduction
3-2 Materials and Methods 3-3 Results
3-4 Discussion 3-5 Conclusion
Chapter 4 Future Directions: The Aging Effect in Dolphins --- 48 4-1 Introduction
4-2 Comparative Studies between Dolphins, Horses, and Cows
4-3 Similarities and Differences between Dolphins, Horses, and Cows 4-4 Uniqueness of the Metabolic System in Dolphins
4-5 Further Research: The Aging Effect in Dolphins 4-6 Conclusion
Summary ……… 55
References ………. 60
Acknowledgements ………. 68
Introduction
1. Clinical Biochemistry in Animals
For a long time, many different animals have shared their lives with humans.
Since the animals live in a different environment from their original natural habitat, health monitoring is always important in terms of their safety and protection from diseases. It is especially important to diligently monitor for any abnormalities of their health status and any changes in their behavior in the early stages to obviate any health problems. Given this situation, understanding their normal health condition is one of the essential challenges for building a better living experience.
In this study, we focused on the lipid and energy metabolism in large animals.
Since blood collection can be easily performed during routine health examinations, plasma metabolite values can be helpful to understand an animal’s health condition. Like humans, many major diseases are related to metabolic conditions, so investigating metabolic biomarkers is beneficial for both animals and humans.
Thus, monitoring and understanding the relevance of hematological data is crucial for health management of animals.
Lipoproteins play valuable role in energy and lipid metabolism of animals, and these patterns correlate with various metabolic changes. Since lipoprotein density profiles among animals are varied, it is possible to characterize different species by fraction patterns (Terpstra et al. 1982). As such, there are 2 main lipoprotein groups: HDL and LDL dominant mammals. The HDL dominant group consists of
dogs, cats, and horses; whereas the LDL dominant group includes humans, pigs, and rabbits (Chapman 1986). Cholesterol lipoprotein profiles can be useful to evaluate metabolic status such as overweight and obesity in dogs and cats (Mori et al. 2011; Muranaka et al. 2011). Thus, it is crucial to understand standard normal cholesterol lipoprotein patterns in order to detect any abnormalities in metabolic condition of animals.
Increased enzyme activity within the malate-aspartate shuttle appears to produce efficient energy metabolism in animal tissues (Arai et al., 1998), with malate- aspartate shuttle activity modulating according to variations in energy metabolism needs (Arai et al., 2001). Malate dehydrogenase (MDH) is necessary for gluconeogenesis and lipogenesis, and plays a significant role in the malate- aspartate shuttle (Setoyama et al., 1988). This transports cytosolic NADH into mitochondria, followed by oxidative ATP production (Hedeskov et al., 1987).
Alternately, lactate dehydrogenase (LDH) converts pyruvate to lactate, consuming cytosolic NADH. Glucose is thought to be metabolized to pyruvate during cytosolic glycolysis, and is the main energy source in most mammals (Lauris et al., 1966).
Each animal species has specific values for plasma and leukocyte MDH, LDH enzyme activities, and MDH/LDH activity (M/L) ratio (Arai et al., 2003).
Furthermore, Washizu et al. (2001) reported that cytosolic M/L ratio is considered to be a useful indicator to evaluate metabolic states in animal tissues.
2. Metabolic and Age-related Disorders in Animals
In recent years, progress of veterinary science has contributed to the longevity of companion animals, such as dogs and cats. However, along this development, the number of metabolic and age-related disorders in animals has been rapidly increasing. Metabolic disorders, such as diabetes and hyperlipidemia, have become one of the major health problems in companion animals. In some cases, the animal owners overlook the abnormal state until it is in a terminal condition. Additionally, heart, liver and kidney problems, as well as cancers, are representative examples of age-related disorders. Similarly to humans, these disorders can occasionally lead to comorbid conditions and become a more complicated status to treat. Therefore, diagnosis in the early stages and prevention of these disorders need urgent attention.
Specifically, obesity is a primary risk condition for metabolic and age-related disorders (Bray and Bellanger 2006). Interestingly, obesity-induced or obesity- associated diseases appear to arise from inflammation, and this type of inflammation contributes to the development of many chronic conditions, including diabetes, liver diseases, and some forms of cancer (Lukens et al., 2011;
Stienstra et al., 2012; Gregor and Hotamisligil 2011; Osborn and Olefsky 2012).
Recently, bidirectional immunological-metabolic crosstalk has made a great contribution and provided a new aspect to the relationship between health and disease in the human medical research area. Metabolic systems range from energy use to immunological defense. Metabolic dysfunction resulting from an obese condition is tightly connected to a variety of chronic diseases.
3. Significance of Comparative Study
Comparative studies are helpful because this knowledge can offer critical information, leading to establishing the basic standard data and discovering the distinct features of the animals. It is also advantageous to use this knowledge for other fields, including the human medical field.
According to the Japanese Association of Zoos and Aquariums (JAZA), we have placed a variety of animals in over 150 zoos and aquariums (registered in JAZA, 2015) for educational and/or breeding purposes throughout Japan. This captivity has benefited our research and understanding of their biology for a long time.
However, diseases and conditions of the captive animals are relatively difficult to find or determine because they are often a rare species. Especially, research on rare species, such as aquatic mammals, is often problematic, thus information about the animals is scant, and the standard values of various blood biomarkers are not established in many cases. Since many different animals are bred in captivity, comparing this knowledge to common and familiar animals can be a valuable strategy in order to investigate and collaborate the information with other rare animal species.
Since the prevalence of overweight and obesity in animals has been increasing in recent years, learning about the metabolic systems in animals is imbued with significance. A better understanding of metabolism patterns can lead to more efficient management and disease prevention strategies for these animals.
Even though some animal species are closely related, each species has specific
features due to their environment or food habits. Comparing different species can accentuate the differences from other animals and provide useful clues to understand the animals. From this information, we can speculate or establish standards for the animals, and often apply the knowledge to human medical fields.
For instance, it was demonstrated that metabolic responses in dolphins are consistent with human type 2 diabetes, thus dolphins can be used as animal models for this diseases (Venn-Watson et al. 2011). Dolphins are unique animals, sharing some similarities with humans and primates, such as glucose metabolism and brain size (Craik et al. 1998; Marino 1998), but there are differences as well.
Therefore, it is of interest to research this animal in terms of the general metabolic system.
In this study, we investigated and compared metabolic systems in large animals.
In captive condition, it is necessary to control and manage their feeding formula and physical activity, based on the individual health status of the animals. Since we previously researched various blood biomarkers of cows and horses, using the established data can increase the opportunities to give more pragmatic evidence of normal metabolism in other animal groups. We strongly believe that such comparative studies can be the very first step to a better health management of animals and humans.
Chapter 1
Cholesterol Lipoprotein Profiles of Large Animals
1-1 Introduction
Mammals have their own characteristics in glucose and lipid metabolism, reflecting in different plasma metabolite values (Sako et al. 2007). Understanding and monitoring the metabolic system in each animal species can lead to early detection and prevention of various metabolic-related diseases. In the veterinary field, obesity has become the popular health issue for companion animals (Laflamme 2012). Hyperlipidemia, commonly resulted from obesity, is the increased concentration of triglyceride (hypertriglyceridemia), cholesterol (hypercholesterolemia), or both in the blood (Watson and Barrie 1993; Ford 1996;
Johnson 2005). Pathology of hyperlipidemia can be attributed to increased lipoprotein synthesis or mobilization or decreased lipoprotein clearance, and it can be primary (genetic or idiopathic) or secondary to other disease processes (Whitney 1992).
Lipoproteins have a valuable role in energy and lipid metabolism of animals, and these patterns correlate with various metabolic changes. Since lipoprotein density profiles among animals are varied, it is possible to characterize different species by fraction patterns (Terpstra et al. 1982). As such, there are 2 main lipoprotein groups: HDL and LDL dominant mammals. The HDL dominant group consists of dogs, cats, and horses; whereas the LDL dominant group includes humans, pigs, and rabbits (Chapman 1986). Cholesterol lipoprotein profile can be useful to
evaluate a metabolic status, such as overweight and obesity in dogs and cats (Mori et al. 2011; Muranaka et al. 2011). Thus, it is crucial to understand standard normal cholesterol lipoprotein patterns in order to detect any abnormalities in an animal’s health condition.
Therefore, the aim of this study was to examine and compare plasma metabolite values and cholesterol lipoprotein profiles between dolphins, horses, and cows. As described above, each animal species has a different nutrition metabolic system, so it is intriguing to seek the similarity or the difference between these animal groups. Especially, since little is known about the health condition of marine mammals such as dolphins, a better understanding of their metabolism patterns can lead to the early prevention of various diseases. These 3 different animal species are similarly large animals, and have also been trained or domesticated by humans as well. Thus, horses and cows can serve as practical comparisons.
Additionally, the basic information gained from comparative studies can provide profitable knowledge for establishing standards of animal basal metabolism.
1-2 Materials and Methods Animals
Five captive bottlenose dolphins (Tursiops truncates), 6 Thoroughbred riding horses, and 12 lactating Holstein cows were examined in this study. All animals were diagnosed to be healthy and exhibited no clinical signs for disease. The bottlenose dolphins were part of the population at Enoshima Aquarium in Kanagawa, Japan. The tank of the dolphin pool is outdoors with a total sea water
volume of 5000 m3 (45m x 25m, oval-shaped, with a depth of 3.5 to 5.5m) (Terasawa et al. 2005). The average monthly water temperature of the dolphin pool varied between 12.5±0.6℃ in February to 27.3±1.4℃ in August, and the average monthly air temperature ranged from 8.7±2.4℃ in January to 27.9±2.2℃ in August (Terasawa et al. 2005). The Thoroughbred riding horses were maintained and trained at Nippon Veterinary and Life Science University. The lactating Holstein cows were maintained at Koizumi Milk Farm in Tokyo, Japan.
Dolphins were fed 4 to 8 times per day, between 9:00 and 17:30, and consumed approximately 10 to 14 kg (mainly fish) daily. Horses were fed a daily diet of 〜5 kg in total, 3 times per day, between 6:00 and 16:00. Cows were given 29 to 32 kg of feed daily, administered 4 times daily between 5:30 and 10:00. All animals involved in this study lived in captivity. Approval for this study has been given by the Nippon Veterinary and Life Science University Animal Research Committee.
Sample Collection
Blood sampling from dolphins was conducted on a monthly basis, as a part of their routine physical exams at Enoshima Aquarium. Briefly, blood was taken from the tail fluke of dolphins by venipuncture, using a sterile 21 gauge disposable butterfly needle. Because the dolphins were trained for blood sampling and/or other routine physical exams, they can voluntarily display their tail or body when samples need to be collected. All dolphin blood samples were obtained 16 to 17 hours after their last feeding. Blood sampling from horses and cows was obtained from the jugular or caudal vein, respectively, early in the morning (5:00-7:00 am). The animals
showed no excitement or fear, when blood sampling was conducted, since they were accustomed to blood sampling. Blood samples from all animals were centrifuged at 3500 rpm for 10 min at 4℃ in order to obtain plasma samples, which were subsequently frozen at -80℃ until further use.
Plasma Metabolite Assays
Plasma glucose, triglycerides (TG), and total cholesterol (T-Cho) were measured using an AU680 auto analyzer (Beckman Coulter, CA, USA) with the manufacturer’s reagents. Non-esterified fatty acid (NEFA) concentration was measured using a Wako NEFA-C test commercial kit (Wako Pure Chemical Industries, Inc., Tokyo, Japan).
Cholesterol Lipoprotein Profiling
Plasma cholesterol lipoprotein patterns were detected by the biphasic agarose gel electrophoresis method utilizing commercial Quickgel Lipo gels (Code No. J715, Helena Laboratories, Saitama, Japan). In brief, 30μL sample volumes were loaded into the dipping well of an Epalyzer 2 Electrophoresis Processing Analyzer (Helena Laboratories), of which 5-6μL was loaded onto the gel, and run with a 14 min set migration time at 250 V and at 20℃. After migration, the gels underwent a 15 min reaction time, followed by a 12 min and 30 s decolorizing and fixing time, respectively. Cholesterol lipoprotein fractions were assessed and analyzed using Edbank III analysis software (Helena Laboratories).
Statistical Analysis
Results are expressed as means ± SD. Paired groups were compared using the Mann-Whitney U-test for data with non-normal distribution, and statistical significance was set at P<0.05. All tests were performed using Sigmaplot analysis software (Sigmaplot 11.0, Build 11.0.007; Systat Software Inc., San Jose, CA).
1-3 Results
Blood Biochemistry Values
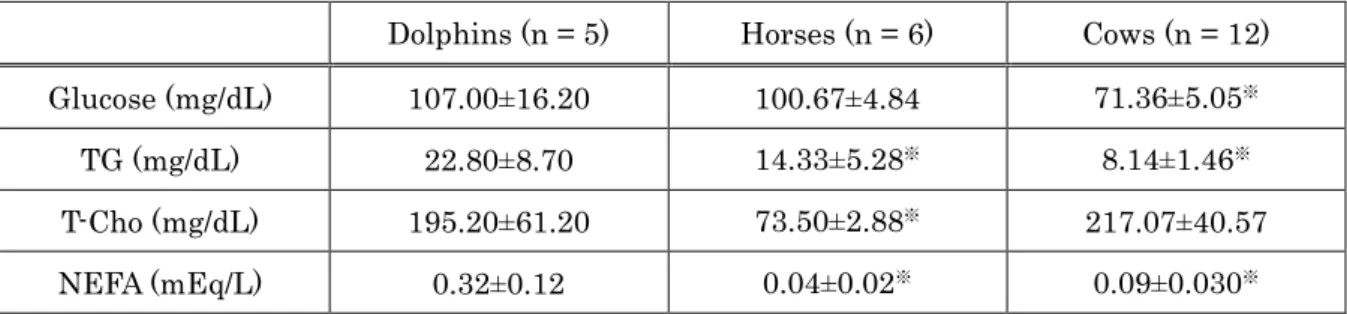
All values for the measured plasma metabolites for dolphins, horses, and cows are presented in Table 1-1. Plasma glucose level in dolphins was similar to that in horses, but significantly higher than that in cows (Mann Whitney U-test, p<0.05).
Dolphins also had significantly higher levels of TG and NEFA than either horses (TG: p=0.019, NEFA: p=0.002) or cows (TG: p=0.001, NEFA: p=0.004). Dolphin and cow T-Cho levels were significantly higher as compared to horses (p=0.002).
Table 1-1. Plasma Metabolite Comparison between Dolphins, Horses and Cows
Dolphins (n = 5) Horses (n = 6) Cows (n = 12) Glucose (mg/dL) 107.00±16.20 100.67±4.84 71.36±5.05※
TG (mg/dL) 22.80±8.70 14.33±5.28※ 8.14±1.46※
T-Cho (mg/dL) 195.20±61.20 73.50±2.88※ 217.07±40.57
NEFA (mEq/L) 0.32±0.12 0.04±0.02※ 0.09±0.030※
Values are presented as mean±SD.
※Denotes significant difference as compared to dolphins (Mann-Whitney U-test, p<0.05).
Cholesterol Lipoprotein Patterns
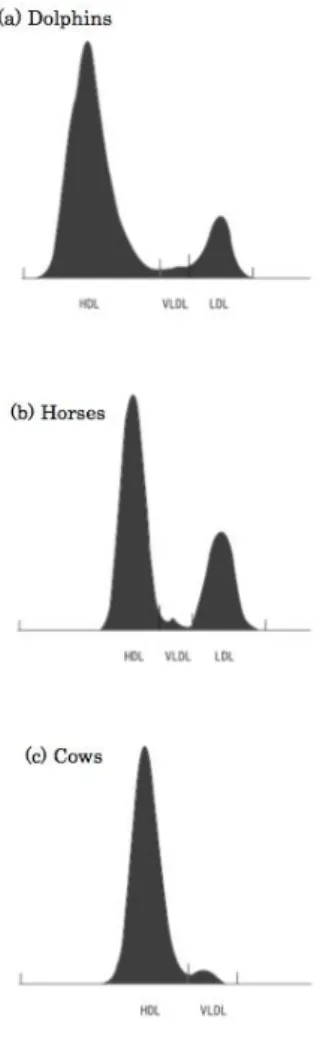
Cholesterol lipoprotein patterns for all animal groups are shown in Figure 1-1. All animal groups showed HDL dominant patterns. Although all animal groups displayed different patterns, dolphins and horses showed a similarity with clear fraction of LDL in both groups. There was no clear LDL fraction in cows.
Figure 1-1. Comparison of cholesterol lipoprotein patterns between (a) dolphins, (b) horses, and (c) cows. Lipoproteins were separated by an electrophoretic technique and analyzed using Epalyzer 2 Electrophoresis Processing Analyzer (Helena Laboratories).
1-4 Discussion
As it is well known today, obesity is an increasingly encountered health problem, and it could increase the risks for serious diseases and health conditions.
Prevalence of overweight and obesity is not only for human health problems, but also for animals (Tvarijonaviciute et al. 2012; Martin et al. 2014; Robin et al. 2015).
Since no reference ranges for plasma based parameters have been correlated with stages of obesity as of yet, objective and pragmatic biomarkers reflecting dysfunction of the metabolic state is needed in the veterinary field.
As it has been reported that obesity in dogs can result in aberration to cholesterol lipoprotein fraction profiles (Jericó et al. 2009), it is possible to understand the metabolic states of animals based on lipid and lipoprotein parameters. Moreover, it was suggested that analyzing serum lipid and lipoprotein values could characterize the different equine breeds and might be useful for evaluating metabolic states in horses (Asadi et al., 2006). It was also reported that the Shetland ponies had higher plasma TG and VLDL concentrations than their Thoroughbred counterparts (Watson et al., 1991). Therefore, understanding the metabolic system similarities and differences of the same animals group, can lead to more specific evaluation of each animal metabolic condition.
As the present data showed, cholesterol profile patterns between dolphins, horses and cows showed that all animal groups were classified into HDL dominant mammals, such as dogs and cats. Dolphins and horses also displayed clear LDL- Cho peak, which was not shown in cows, thus the cholesterol profile of dolphins is a closer resemblance to that of horses, rather than that of cows.
With dolphins, there is evidence showing that their health and environmental conditions might induce the changes in lipid metabolism. For instance, hyperlipidemia of captive Bottlenose dolphins during pregnancy (Terasawa and Kitamura, 2005), and seasonal changes in T-Cho value in captive Bottlenose dolphin sera (Terasawa et al., 2002) have been reported. Therefore, application of plasma lipid concentrations as diagnostic markers for metabolic disorders should be considered in relation to various factors inducing metabolic changes such as pregnancy, season and other considerable diseases. Moreover, daily diet is one of the most important factors that affect the plasma lipid concentrations and compositions. As the report in 2005 suggested that rice bran oil affects plasma lipid concentrations and lipoprotein composition in mares (Frank et al., 2005), specific food could affect the values in lipid metabolism. Further studies on the relationship between food compositions and lipid metabolism in dolphins are especially needed.
Although there have been no reports, dolphins maintained at aquariums can sometimes become overweight. Determining the normal rages of plasma metabolites and lipoprotein pattern, and what kind of aberrations in their metabolism can cause obesity, are crucial to manage their healthy metabolic state.
1-5 Conclusion
Evidence now indicates that understanding the characteristic in lipid and lipoprotein parameters of each animal group is necessary for maintaining healthy metabolism in animals. In addition, various factors can often alter the patterns, so investigating how they are involved in lipid metabolism can lead to a more specific
evaluation of an animal’s metabolic state. Overall, monitoring of plasma lipid concentrations and the cholesterol profile in animals is useful to detect abnormal metabolic states in order to prevent various metabolic-related disorders.
Chapter 2
Comparison of Energy Metabolism and LDH Isoenzyme Patterns in Large Animals
2-1 Introduction
Monitoring and understanding the relevance of hematological data is crucial for health management of animals, especially those bred in captivity. Since little is known about the health conditions of marine mammals, it is very difficult to determine disease development, until it is in well advanced stages. A better understanding of metabolism patterns can lead to more efficient management and disease prevention strategies of these animals. Since blood collection can be easily performed, during routine health examinations, plasma metabolite values can serve as a useful index for early detection of diseases. With dolphins, it is rather difficult to detect health abnormalities, especially in the early stages, owing to the fact that standard normal plasma metabolite value ranges have yet to be established and little is understood thus far. Moreover, information about dolphin energy metabolism is scant so further developments will be of use to better understand basic dolphin basal metabolism.
Increased enzyme activity within the malate-aspartate shuttle appears to produce efficient energy metabolism in animal tissues (Arai et al. 1998), with malate- aspartate shuttle activity modulating according to variations in energy metabolism needs (Arai et al. 2001). Malate dehydrogenase (MDH) is necessary for gluconeogenesis and lipogenesis, and plays a significant role in the malate-
aspartate shuttle (Setoyama et al. 1988), transporting cytosolic NADH into mitochondria followed by oxidative ATP production (Hedeskov et al. 1987).
Alternately, lactate dehydrogenase (LDH) converts pyruvate to lactate consuming cytosolic NADH. Glucose is thought to be metabolized to pyruvate, in cytosolic glycolysis, and is the main energy source in most mammals (Lauris and Cahill 1966). Each animal species has specific values for plasma and leukocyte MDH, LDH enzyme activities, and MDH/LDH activity (M/L) ratio (Arai et al. 2003).
Furthermore, Washizu et al. (2001) reported that cytosolic M/L ratio is considered to be a useful indicator to evaluate metabolic states in animal tissues.
“Symmorphosis” as originally proposed by Taylor and Weibel (1981) states that biological design will be optimized, such that each structural element in a functional chain matches the maximal requirements of the overall functional system (Garland and Huey 1987). The concept was motivated by the authors’
beliefs that animals are built reasonably and their conviction that structural design is optimized because maintaining biological structures with their often high turnover rates is costly (Weibel and Taylor 1981). For an initial empirical test of symmorphosis, Weibel and Taylor focused on the mammalian respiratory system and proposed two comparative tests. First, for animals differing in size, the scaling of respiratory structures should parallel the scaling of maximal oxygen consumption. Second, for animals of similar size, differences in structural capacities should match differences in VO2 max, the maximal rate of O2 consumption attained during exercise of progressively increasing intensity. VO2 max sets an upper limit to the intensity of work that can be sustained aerobically
for prolonged periods, and hence should be of considerable selective importance.
As such, different species should reflect optimization and differences in oxidative energy metabolism, which would be reflected in muscle fiber (aerobic versus anaerobic) and metabolic profile differences between species.
Therefore, the aim of the present study was twofold. First, we sought to determine plasma metabolite profiles of healthy captive dolphins, and assess their energy metabolism state by examining plasma MDH and LDH activities, M/L ratio, and LDH isoenzyme patterns since such information is lacking in the literature.
Second, we sought to compare the aforementioned parameters between healthy captive bottlenose dolphins and thoroughbred riding horses and lactating Holstein cows, in order to assess “Symmorphosis” regarding oxidative energy metabolism.
Horses and cows may serve as practical comparisons for the following reasons.
First, horses and cows are similarly large animals as dolphins, and have also been trained or domesticated by humans, as well. Second, because dolphins normally have relatively good motility, horses and cows can serve as good comparisons because horses are also quite active, whereas cows exhibit little physical activity;
thereby highlighting differences in energy usage between all 3 species. Third, there is evidence demonstrating that dolphins may be closely related to even-toed ungulates, such as cows, pigs and camels (Shimamura et al. 1997). Lastly, our laboratory has previously reported on energy metabolism of horses and cows (Arai et al. 2003; Kimura et al. 2005; Li et al. 2012).
2-2 Materials and Methods Animals
Five captive bottlenose dolphins (Tursiops truncates), 6 Thoroughbred riding horses, and 12 lactating Holstein cows were included in this study. All animals were diagnosed to be healthy and exhibited no clinical signs for disease. The bottlenose dolphins were part of the population at Enoshima Aquarium in Kanagawa, Japan. The tank size, seawater volume, air and water temperatures of the dolphin pool at Enoshima Aquarium have been previously presented (Terasawa et al. 2005). Thoroughbred riding horses were maintained and trained at Nippon Veterinary and Life Science University. The lactating Holstein cows were maintained at Koizumi Milk Farm in Tokyo, Japan. Dolphins were fed 4 to 8 times per day, between 9:00 and 17:30, and consumed approximately 10 to 14 kg (mainly fish) daily. Horses were fed a daily diet of ~5kg in total, 3 times per day, between 6:00 and 16:00. Cows were given 29 to 32 kg of feed daily, administered 4 times daily between 5:30 and 10:00. All animals involved in this study lived in captivity.
Regarding physical activity, in general, dolphins at the Enoshima Aquarium were active as compared to other animal groups, constantly moving in and around the tank, due to training or shows in the daytime. Alternatively, horses at the university were usually immobile during the day, standing still, except for their daily exercise regiment, lasting 1 to 2 hours daily. Lastly, cows at the Koizumi Milk Farm were immobile, usually standing still. The cows were able to supply approximately 30 mL of milk per day. Approval for this work has been given by
the Nippon Veterinary and Life Science University Animal Research Committee.
Sample Collection
Blood sampling from dolphins was conducted on a monthly basis, as a part of their routine physical exams at Enoshima Aquarium. Briefly, blood was taken from the tail fluke of dolphins by venipuncture, using a sterile 21 gauge disposable butterfly needle. Because the dolphins were trained for blood sampling and/or other routine physical exams, they can voluntarily display their tail or body when samples need to be collected. All dolphin blood samples were obtained 16 to 17 hours after their last feeding. Blood sampling from horses and cows was obtained from the jugular or caudal vein, respectively, early in the morning (5:00-7:00 am). The animals showed no excitement or fear, when blood sampling was conducted, since they were accustomed to blood sampling. Blood samples from all animals were centrifuged at 3500 rpm for 10 min at 4°C in order to obtain plasma samples, which were subsequently frozen at -80°C until further use.
Plasma Metabolite Assays
Plasma biochemistry analysis on alanine aminotransferase (ALT), alkalanine phosphatase (ALP), aspartate aminotrans- ferase (AST), blood urea nitrogen (BUN), creatinine, glucose, lactate dehydrogenase (LDH), total cholesterol (T-Cho), total protein (TP), and triglycerides (TG) was performed using an AU680 auto analyzer (Beckman Coulter, CA, USA) with the manufacturer’s reagents. Non-
esterified fatty acid (NEFA) concentration was measured using a Wako NEFA-C test commercial kit (Wako Pure Chemical Industries, Inc., Tokyo, Japan).
Enzyme Activity Assays and LDH Isoenzyme Profiling
The activities of malate dehydrogenase (MDH) and lactate dehydrogenase (LDH) in plasma were measured as previously described (LDH−Kaloustian et al. 1969 and MDH−Bergmeyer and Brent 1974). All enzymatic activities were measured between 24-26 °C and expressed as U per liter of plasma. The enzyme unit (U) was defined as 1 μmol of substrate degraded per min. The M/L ratio was calculated as MDH activity divided by LDH activity. Plasma LDH isoenzyme patterns were detected by the biphasic agarose gel electrophoresis method utilizing commercial Quickgel LD gels (Helena Laboratories, Saitama, Japan). In brief, 30 μL plasma sample volumes were loaded into the dipping well of an Epalyzer 2 Electrophoresis Processing Analyzer, of which 5-6 μL was loaded onto the gel, and run with a 13 min set migration time at 240 V and at 15 °C. After migration, the gels underwent a 14 min reaction time, followed by a 12 min and 30 s decolorizing and fixing time, respectively. LDH fractions were assessed and analyzed using Edbank III analysis software (Helena Laboratories).
Statistical Analysis
Results are expressed as means ± SD. Paired groups were compared using the Mann-Whitney U-test for data with non- normal distribution, and statistical significance was set at P<0.05. All tests were performed using Sigmaplot analysis
software (Sigmaplot 11.0, Build 11.0.077; Systat Software Inc., San Jose, CA).
2-3 Results
Plasma Metabolite Assays
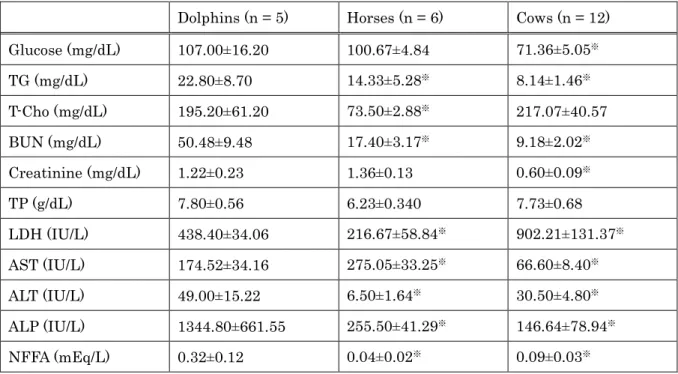
All values for the various measured plasma metabolites, for all animal groups, are shown in Table 2-1. There was no significant difference in glucose levels between dolphins and horses; however dolphin glucose level was significantly higher as compared to that of cows (Mann Whitney U-test, p<0.05). Dolphins also displayed a significantly higher level of TG, than either horses (p=0.019) or cows (p=0.001).
T- Cho levels in dolphins and cows were both significantly higher than that of horses (p=0.002). NFFA in dolphins was also significantly higher than that of either cows (p=0.004) or horses (p=0.002). Lastly, dolphins had a significantly higher level of ALP as compared to either cows (p=0.001) or horses (p=0.002).
Table 2-1. Comparison of Blood Biochemistry Values of Dolphins, Horses, and Cows
Dolphins (n = 5) Horses (n = 6) Cows (n = 12) Glucose (mg/dL) 107.00±16.20 100.67±4.84 71.36±5.05※
TG (mg/dL) 22.80±8.70 14.33±5.28※ 8.14±1.46※
T-Cho (mg/dL) 195.20±61.20 73.50±2.88※ 217.07±40.57
BUN (mg/dL) 50.48±9.48 17.40±3.17※ 9.18±2.02※
Creatinine (mg/dL) 1.22±0.23 1.36±0.13 0.60±0.09※
TP (g/dL) 7.80±0.56 6.23±0.340 7.73±0.68
LDH (IU/L) 438.40±34.06 216.67±58.84※ 902.21±131.37※
AST (IU/L) 174.52±34.16 275.05±33.25※ 66.60±8.40※
ALT (IU/L) 49.00±15.22 6.50±1.64※ 30.50±4.80※
ALP (IU/L) 1344.80±661.55 255.50±41.29※ 146.64±78.94※
NFFA (mEq/L) 0.32±0.12 0.04±0.02※ 0.09±0.03※
Values are presented as mean±SD.
※Denotes significant difference as compared to dolphins (Mann-Whitney U-test, p<0.05).
MDH, LDH, and M/L Ratio
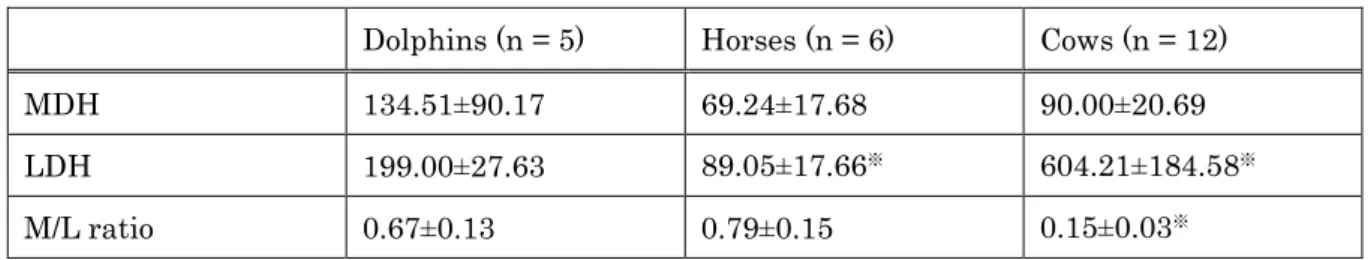
A comparison of plasma MDH and LDH activities, in addition to M/L ratio between all 3 animal groups is displayed in Table 2-2. Although no significant difference in MDH activity was noted between any of the groups, LDH activity in dolphins was significantly (Mann Whitney U-test, p<0.05) higher than that of horses (~2 fold), and lower than that of cows (~65% lower), respectively. As a result, M/L ratio in each animal species was different from one another (Mann Whitney U-test, p<0.05).
Horses demonstrated the highest M/L ratio (0.79), followed by dolphins (0.67) and cows (0.15), respectively.
Table 2-2. Comparison of MDH and LDH Activities and M/L Ratio in Plasma of Dolphins, Horses, and Cows
Dolphins (n = 5) Horses (n = 6) Cows (n = 12)
MDH 134.51±90.17 69.24±17.68 90.00±20.69
LDH 199.00±27.63 89.05±17.66※ 604.21±184.58※
M/L ratio 0.67±0.13 0.79±0.15 0.15±0.03※
Values are presented as mean±SD.
※Denotes significant difference as compared to dolphins (Mann-Whitney U-test, p<0.05).
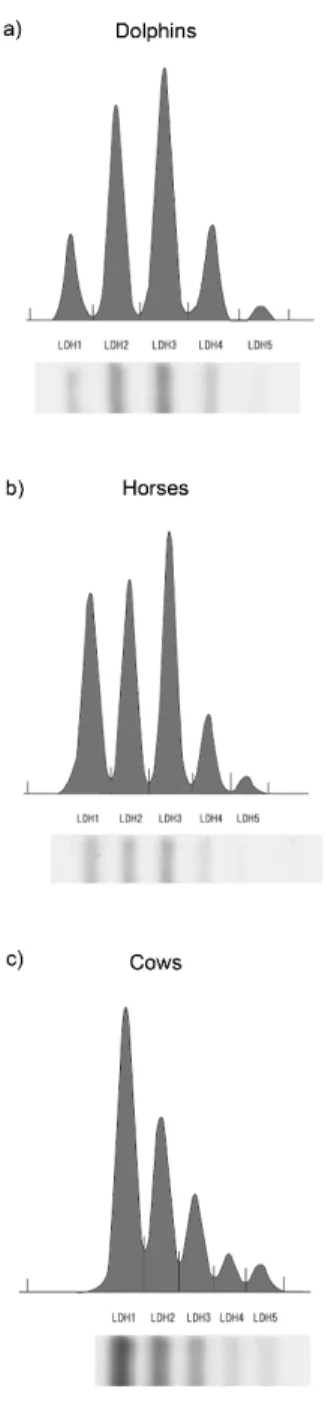
LDH Isoenzyme Patterns
LDH isoenzyme patterns for all animal groups are presented in Figure 2-1.
Although all animal groups displayed significant differences in isoenzyme pattern distribution, dolphins and horses demonstrated a similarity in LDH isoenzyme pattern with LDH-3 predominating, and LDH-2 and -3 making up 50% of total plasma LDH, in both species (Table 2-3). The isoenzyme pattern in dolphins, in descending % amount of total LDH, was LDH-3 (39.62±1.07%), LDH-2 (29.56±1.43%), LDH-4 (17.18±1.78%), and LDH-1 (10.46±0.97%). Alternately, the isoenyme pattern in horses, in descending amount, was LDH-3 (31.55±2.20%), LDH-1 (29.88±3.02%), LDH-2 (25.30± 2.63%), LDH-4 (10.67±0.99%), and LDH-5 (2.60±0.95%). Unlike both dolphins and horse, LDH-1 (47.07±1.56%) was the most dominant isoform in cows, followed by LDH-2 (27.77±0.78), LDH-3 (15.45±1.11), LDH-4 (5.60±0.50), and LDH-5 (4.12±0.78).
Figure 2-1. Comparison of plasma LDH isoenzyme patterns between cows, horses and dolphins. LDH isoenzymes were separated by an electrophoretic technique and analyzed using Epalyzer 2 Electrophoresis Processing Analyzer (Helena Laboratories).
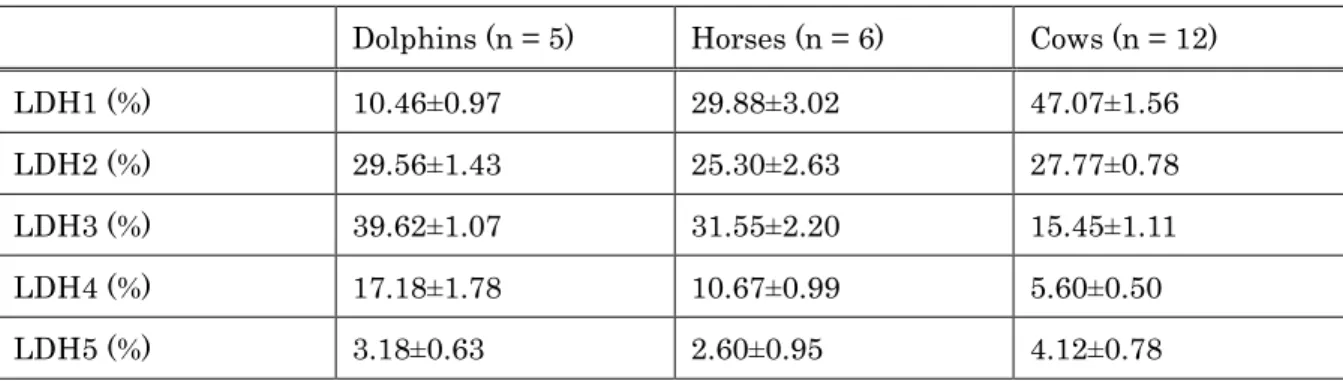
Table 2-3. Comparison of LDH Isoenzyme Distribution between Dolphins, Horses, and Cows
Dolphins (n = 5) Horses (n = 6) Cows (n = 12)
LDH1 (%) 10.46±0.97 29.88±3.02 47.07±1.56
LDH2 (%) 29.56±1.43 25.30±2.63 27.77±0.78
LDH3 (%) 39.62±1.07 31.55±2.20 15.45±1.11
LDH4 (%) 17.18±1.78 10.67±0.99 5.60±0.50
LDH5 (%) 3.18±0.63 2.60±0.95 4.12±0.78
Values are presented as mean±SD.
2-4 Discussion
“Symmorphosis” as originally proposed by Taylor and Weibel (1981) dictates that there should be a symbiosis between form and function for every animal species.
In general, dolphins are constantly moving, hence their muscle fiber and metabolic profiles should reflect that species, as opposed to cows (do not run around at all) and horses (in between). Therefore, a difference in aerobic (endurance) vs anaerobic muscle fiber profiles will have a great impact on ATP usage, in addition to general activity levels for example. Two fundamental reactions resynthesize ATP (Duren 1998): 1) Oxidative phosphorylation, breaking down carbohydrates, fats and protein, in the presence of oxygen, producing energy (ATP). The involvement of oxygen qualifies this as an aerobic reaction. 2) Glycolysis, breaking down glucose or glycogen into lactic acid. This reaction does not use oxygen and is considered anaerobic. There are several factors which will determine both the choice of fuel and the pathway used to generate ATP. These factors include: muscle fiber type, the speed and duration of exercise, type of feed provided, and animal
fitness.
M/L ratio appears to be one potential useful indicator of oxidative metabolism in animals since it can indirectly measure ATP synthesis/regeneration rate. A ratio of 1 would be ideal, since MDH enzyme activity to generate ATP is equally balanced by LDH enzyme activity to regenerate NADH into NAD+ for additional energy production. Therefore, ATP is resynthesized at the same rate at which it is being used. However, since it is possible to obtain similar ratios, with differing MDH and LDH activity levels, it is imperative that MDH and LDH levels are also analyzed, in context, in order to reflect whether elevated energy metabolism, including elevated ATP production, may be occurring in some tissues, such as muscle and liver. Plasma M/L ratio in horses (0.79) was greater than that of dolphins (0.67) or cows (0.15); however MDH and LDH enzyme activity levels in dolphins was ~1.9 and ~2.2x higher, respectively than that of horses; thereby indicating greater overall energy usage in dolphin than horse tissues. LDH, aldolase and phosphoglucomutase levels are higher in dolphin than in other mammalian skeletal muscles; pyruvate kinase is the only glycolytic enzyme in lower concentration in dolphin muscle (Storey and Hochachka 1974). Therefore, although horses appear to use energy more efficiently than dolphins, there is greater energy usage or metabolism by dolphins as compared to horses, as evidenced in higher overall plasma MDH and LDH activity levels.
The horse has three basic types of muscle fiber: Type I, IIA and IIB, which differ in contractile and metabolic characteristics (Duren 1998). Type I fibers are slow- contracting fibers, while Types IIA and IIB are fast-contracting. In addition, Type
I and IIA fibers have a high oxidative capacity and thus can utilize fuels aerobically while Type IIB fibers have a low aerobic capacity and depend on anaerobic glycolysis for energy generation. All three fiber types store glycogen, while only Types I and IIA have significant triglyceride storage. The speed of muscle contraction determines how fast the animal is able to move, and the faster an animal moves the greater the ATP requirement (Duren 1998). While walking, muscle contraction occurs very slowly and relatively small amounts of ATP are expended. During this type of exercise, Type I fibers are primarily recruited and energy generation is entirely aerobic, with muscle burning predominantly fat. As speed increases from a walk to a trot to a canter, Type I fibers alone are no longer capable of contracting rapidly enough to propel the horse. At this point, Type IIA fibers are also recruited. These fibers are also aerobic, but they use a combination of glycogen and fat for energy generation. Glycogen (glucose) can be metabolized twice as fast as fat for ATP generation, and as speed increases, fat becomes simply too slow a fuel for energy generation. As the horse increases speed to a fast gallop, Type IIB fibers are recruited and energy generation no longer remains purely aerobic. At these speeds, the requirement for ATP has exceeded the ability of the horse to deliver enough oxygen to the muscle to produce the energy by aerobic means. Anaerobic glycolysis takes over as a rapid metabolic pathway to generate ATP. Anaerobic glycolysis results, however, in lactic acid accumulation, and fatigue soon develops as the pH in the muscle begins to fall.
Therefore, in the case of the riding horses used in our study, the majority of energy usage appears to be aerobic in origin due to the type of physical activity and muscle
profile involved. These facts would support the greater plasma M/L ratio in horses (0.79) as opposed to dolphins (0.67) since M/L ratio may be measuring oxidative ATP usage/regeneration by aerobic means only. Because dolphins are constantly moving, their energy usage may exceed that which can be produced by aerobic means only, and therefore M/L ratio does not take ATP generation by anaerobic means into account.
To further support the idea of increased energy usage or metabolism in dolphins as opposed to horses, dolphins demonstrated significantly higher levels of plasma lipid metabolites, such as triglycerides (TG, 0.5x greater), total cholesterol (T-Cho, 2.5x greater) and Non-esterified fatty acid (NEFA, 8x greater) as compared to horses. This may be indicative of dolphins having more capacity for lipolysis and lipid utilization as an additional energy source for aerobic ATP usage and regeneration, since they require more energy, and may have higher adipose stores as compared to horses (Rommel and Lowenstine 2001; Kasamatsu et al. 2009). The difference in adipose stores between horses and dolphins may be possibly related to the type and quality of their diets (Asper et al. 1990; Bossart et al. 2001;
Kasamatsu et al. 2001). In addition, seasonal variation of plasma T-Cho and free fatty acid levels in dolphins has been reported with T-Cho and free fatty acid levels being inversely correlated with blubber thickness (Terasawa et al. 2002; Williams et al. 1992), with free fatty acid most likely being released from and deposited to the blubber in warm seasons and cooler winter months, respectively (Williams et al. 1992).
Additionally, dolphins exhibited the highest amount of plasma ALP amongst the animal species, being ~5x and ~9x greater than in horses and cows respectively.
High levels of plasma ALP in dolphins have been previously observed in young and growing dolphins, with a significant decrease in concentration with increasing age (Fair et al. 2006).
Cows, on the other hand, demonstrated the lowest level of oxidative metabolism efficiency by aerobic means amongst all animal groups. Thus their aerobic energy usage may not be as efficient or may significantly differ from dolphins and horses, which would be expected according to “Symmorphosis” (Taylor and Weibel 1981).
Since dolphins and horses are considered to be more active than cows, the increase in energy usage efficiency by aerobic means, of these 2 animal species could possibly be attributed to increased motility as compared to cows. In addition, since the cows are under a lactating state, energy usage by the animal is very different as opposed to a non-lactating state. Lactation in many species, particularly dairy cattle, which have been specifically bred for high milk production, requires a dramatic shift in metabolism redirecting a significant portion of ingested energy and metabolites to milk synthesis (Bell and Bauman 1997). In cattle, hepatic gluconeogenesis provides the majority of glucose required for mammary lactose synthesis. The liver also breaks down non-esterified fatty acids (NEFA) as an additional energy source if there is insufficient acetate and volatile fatty acids (VFA) coming from digestion. In addition, glucose metabolism of muscle and adipose tissue is also modulated during lactation, with gluconeogenesis being down-regulated in muscle tissue, and a shift in the ratio of lipogenesis to lipolysis
in adipose tissue, by hormones such as bovine somatotropin that stimulates galactopoiesis. In pregnant animals, these responses are exaggerated by moderate undernutrition and are mediated by reduced tissue sensitivity and responsiveness to insulin, associated with decreased tissue expression of the insulin-responsive facilitative glucose transporter, GLUT4. Peripheral tissue responses to insulin remain severely attenuated during early lactation but recover as the animal progresses through mid lactation. Therefore, the low level of energy metabolism, reflected by plasma M/L ratio, observed in lactating cows is indicative of the high energy requirement redirected for lactation instead of to the animal.
Interestingly though, cows demonstrated the highest level of plasma LDH activity amongst all animal species, being ~3x and ~6.8x greater than dolphins and horses, respectively. Because lactating Holstein cows require more energy for lactation, LDH enzyme activity may be increased, in many tissues, as compared to non- lactating cows. In addition, rumen bacterial fermentation, due to lactate-producing organism such as Lactobacillus acidophilus could also affect LDH value in cows (Boyd et al. 2011).
Different animal species exhibit differing characteristic plasma LDH isoenyzme patterns. In addition, each tissue has a characteristic composition of isoenzymes (Dawson et al. 1964). LDH is a tetrameric molecule made of four subunits of the parent molecules, and has five isoenzymes: LDH-1 (H4), LDH-2 (H3M1), LDH-3 (H2M2), LDH-4 (H1M3) and LDH-5 (M4) (Dawson et al. 1964). The present forms are termed H (heart) and M (muscle), for the organs from which they are obtained.
Tissues containing a preponderance of LDH-1, with a lower Km value for pyruvate,
usually function under aerobic conditions; whereas those containing a preponderance of LDH-5, function under relatively anaerobic conditions (Latner et al. 1966).
Although all animal groups displayed significant differences in isoenzyme pattern distribution, dolphins and horses demonstrated a similarity in plasma LDH isoenzyme pattern with LDH-3 predominating. However, the predominance patterns also reflect “Symmorphosis” of each species in that LDH-3,-2, and -4 predominated, in decreasing amount, in dolphins, which may often experience both anerobic and anaerobic energy utilization simultaneously, while LDH-1 and LDH- 3 were equally predominant, with LDH-2 following in horses, which can also experience both aerobic and anaerobic energy utilization, however not simultaneously usually, and lastly LDH-1, -2, and -3 were predominant in cows, which will tend to only experience aerobic energy utilization, due to their lack of general mobility. As such, H type isoenzymes were relatively predominant in all of the animal species plasma examined in this study.
This study had several limitations. First, a small number of healthy dolphins and horses were available from the Enoshima Aquarium and the University Horse Riding club, respectively; therefore we had a limited number of animals in our study. Moreover, only one blood sample was drawn, per dolphin or horse, resulting in low statistical power, hence results and conclusions should be interpreted with care. Second, because the animals involved in the study were randomly selected, there was no age or gender matching performed. Aging can have an impact on energy consumption, however it is still uncertain whether it is influential enough
to affect enzyme activities. For example, higher MDH activities, in skeletal muscle of older men, undergoing endurance training, have been reported (Suominen and Heikkinen 1975). Nonetheless, investigating for alternation in enzyme activities may be more appropriate if measured against age and gender matched animal groups. Three, postprandial influence might have had an impact on plasma metabolite values such as glucose and triglycerides. All blood samples, except from dolphins, were collected within 5 h postprandially, hence postprandial influence cannot be eliminated. In general, fasting is recommended before lipid screening because of the theoretical dynamic changes that can occur in test results for some lipid components, however this study focused on energy metabolism, therefore postprandial influence would be limited. Fourth, all animals involved in this study lived in captivity, and it is critical for this study to examine the animals in captivity.
Particularly, blood samples collected from wild dolphins may affect the data by several reasons such as their handling stress and their diet (Terasawa et al. 1999).
Fifth, there was no standardized accounting or estimate of the activity and energy expenditure per day for the different animals used in our study. As such, no direct comparison could be made in terms of actual energy expenditure between the 3 different animal species.
2-5 Conclusion
In conclusion, dolphins appear to have the greatest level of oxidative energy metabolism amongst horses and cows, due to having the greatest levels of plasma MDH activity. In addition, dolphin energy production/usage efficiency was second (M/L ratio = 0.67) behind that of horses (M/L ratio = 0.79). Overall, these results suggest that dolphins may possibly generate more energy than horses, especially for increased mobility in the water; however all of the produced energy is not utilized for some reasons, such as smaller tank size or other environmental limitations. However, cows demonstrated the highest plasma LDH activity amongst all animal species. This may have been attributed to their lactating state.
Although all animal groups displayed a different plasma LDH isoenzyme pattern distribution, dolphins and horses demonstrated a similarity with LDH-3 isoenzyme predominating in plasma, as opposed to LDH-1 in cows, which would reflect “Symmorphosis” of these 2 species and their aerobic/anaerobic energy metabolism needs.
Overall, plasma MDH and LDH activity levels, M/L ratio, and plasma LDH isoenzyme pattern can all be useful indicators for better understanding oxidative energy metabolism and monitoring of captive animals’ health. As it is not easy to obtain tissue samples from animals, the development of blood indicators for evaluating whole body metabolic state is necessary, and further research is required and should be pursued.
Chapter 3
The Aging Effect on the Metabolic System in Riding Horses
3-1 Introduction
In recent years, progress of veterinary medicine has contributed to the longevity of companion animals. However, along this development, age-related disorders in animals have become a popular topic for clinical practice. As it is well known today, since a metabolic system is subject to change with aging, the number of metabolic disorders in animals has been rapidly increasing as well. In particular, prevalence of overweight and obesity has increased in dogs, cats, and horses (Tvarijonaviciute et al. 2012; Martin et al. 2014; Robin et al. 2015). In general, obesity and overweight are caused by excess calorie intake and physical inactivity. It should be noted that the influence of physical activity is a critical factor for anti-obesity and/or anti-aging. Although domestic dogs and cats tend to decrease physical activity with aging, often times leading to an overweight or obese condition, the health of most riding horses is maintained with sufficient quality of motility.
Adiponectin (ADN), the most abundant protein secreted from adipose tissue, is commonly known for its involvement in obesity-related disorders, such as diabetes and insulin resistance. ADN regulates glucose metabolism and insulin sensitivity through AMP-activated protein kinase (AMPK) (Yamauchi et al. 2002). AMPK plays a crucial role in the regulation of energy metabolism, and it has been demonstrated that exercise acutely increases AMPK activity, as the beneficial effects of exercise were suggested (Ruderman et al. 2013). Since the horses in this
study had daily exercises, it is intriguing to investigate their plasma ADN and AMPK levels, and the connection with their energy metabolism. As shown in our previous reports, MDH/LDH activity ratio (M/L ratio) is considered to be a useful indicator to evaluate metabolic states in animal tissues (Hirakawa et al. 2012). We utilized this method to evaluate energy metabolism in horses.
Furthermore, it has been widely accepted that oxidative stress generated by free radicals is associated with the aging process. Harman proposed “The free radical theory of aging”, which states that aging is the cumulative result of oxidative damage caused by free radicals (Harman 1956). Malondialdehyde (MDA) is frequently used as a biomarker for oxidative stress, and it is known that superoxide dismutase (SOD) activity reflects the response against oxidative stress.
The purpose of this study is to investigate the various metabolic biomarkers between three different age groups in riding horses in order to analyze the aging effect on their metabolic system. Importantly, horses are very active animals, so we discuss whether their daily physical activity can improve metabolic status, leading to a slowing aging process. Since blood collection can be easily performed during routine health examination, blood analysis can serve as a useful index for early detection and protection from metabolic-related and/or age-related diseases.
3-2 Materials and Methods Animals
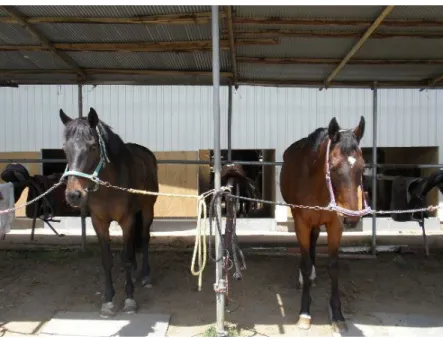
Nineteen riding horses maintained at Japan Horseback Riding Club (Saitama, Japan) were examined in this study (Figure 3-1). All horses were diagnosed to be
healthy and exhibited no clinical signs for disease. They were divided into three groups: young group (7-8 years old, average 7.6±0.2, n=9), middle-aged group (11- 14 years old, average 12.4±0.5, n=5), and aged group (15-18 years old, average 15.8±0.6, n=5). The horses were fed 5.2 to 6.4 kg of hay cube, 3.0 to 4.0 kg of Italian ryegrass, 0 to 1.3 kg of wheat bran, and 0 to 1.8 kg of barley at 6:00 and 16:00 daily.
The body weight of all the horses ranges from 450kg to 500kg. Their physical constitutions were assessed by the six-scale equine body condition score (EBCS), originally established by Carroll and Huntington scoring system (Carroll and Huntington 1988) with some modifications by Robin (Robin et al. 2015) as follows:
very thin [1], thin [2], fair [3], good [4], fat [5], and very fat [6]. According to this scoring system, all the horses involved in this study were determined as EBCS 4 (good). Regarding physical activity, horses at Japan Horseback Riding Club had daily exercises 1 to 3 times per day, including walking at 100 to 110 m/min for 10 to 30 min, trotting at 200 to 220 m/min for 10 to 30 min, and cantering at 300 to 350 m/min for 15 min. The exercise amount of each horse depends on a riding lesson for an individual level such as beginner, intermediate, and senior courses.
Ethical approval in this study was obtained from Japan Horseback Riding Club.
Figure 3-1. Representative horses in this study. Left: young horse (female, 7 years old, EBCS4). Right: aged horse (gelding, 18 years old, EBCS4).
Sample collection
Blood was withdrawn from the jugular vein of the horses into heparinized tubes.
The horses showed no excitement or fear, when blood sampling was conducted.
Plasma was recovered by centrifugation at 1200 g, for 5 min at 4℃, and stored at -80℃ until further use.
Blood analysis
Plasma biochemistry analysis on glucose (GLU), total cholesterol (T-Cho), triglyceride (TG), total protein (TP), blood urea nitrogen (BUN), creatinine (CRE), alanine aminotransferase (ALT), aspartate aminotransferase (AST), and alkaline phosphatase (ALP) was performed using an auto analyzer (JCA-BM2250, JEOL Ltd., Tokyo, Japan) with the manufacture’s reagents at Monolis Inc. (Tokyo, Japan).
The activities of malate dehydrogenase (MDH) and lactate dehydrogenase (LDH) in plasma were measured by previously reported methods (LDH−Kaloustian et al.
1969 and MDH−Bergmeyer and Brent 1974). The M/L ratio was calculated as MDH activity divided by LDH activity. Plasma non-esterified fatty acid (NEFA) concentration, malondialdehyde (MDA) concentration, and superoxide dismutase (SOD) activity were measured using a commercial kit: Wako NEFA-C test (Wako Pure Chemical Industries, Inc., Tokyo, Japan), NWLSSTM Malondialdehyde assay (Northwest Life Science Specialties, LLC, Vancouver, Canada), and NWLSSTM Superoxide Dismutase Activity Assay (Northwest Life Science Specialties, LLC, Vancouver, Canada), respectively. Plasma Insulin (INS) concentration and adiponectin (ADN) concentration were determined with a commercial ELISA kit:
Lbis Rat T insulin kit (SHIBAYAGI Co., Gunma, Japan) and mouse/rat adiponectin ELISA kit (Otsuka Pharmaceutical Co., Ltd., Tokyo, Japan), respectively.
Leukocytic AMP-activated protein kinase (AMPK) activity was measured using the CycLex AMPK Kinase Assay Kit (Medical & Biological Laboratories Co., Ltd., Nagano, Japan). Leucocytes were collected from 5 ml of buffy coat of whole blood.
Cytosolic fractions of leukocytes were prepared and isolated according to the previously described method (Washizu et al. 1998) with some modifications.
Statistical analysis
Results are expressed as means ± SE. Statistical analysis between the three groups was performed using the Mann-Whitney U test, and statistical significance was set at P<0.05.
3-3 Results
All values for the various measured plasma biomarker levels for all the age groups are shown in Table 3-1. There was no significant difference in plasma metabolites between any of the groups. Plasma ADN concentration in the middle-aged group was significantly lower than that in the young group (p=0.0136), but the aged group displayed almost the same level of ADN as the young group. Leukocyte AMPK activities changed parallel to plasma ADN concentrations as both levels decreased.
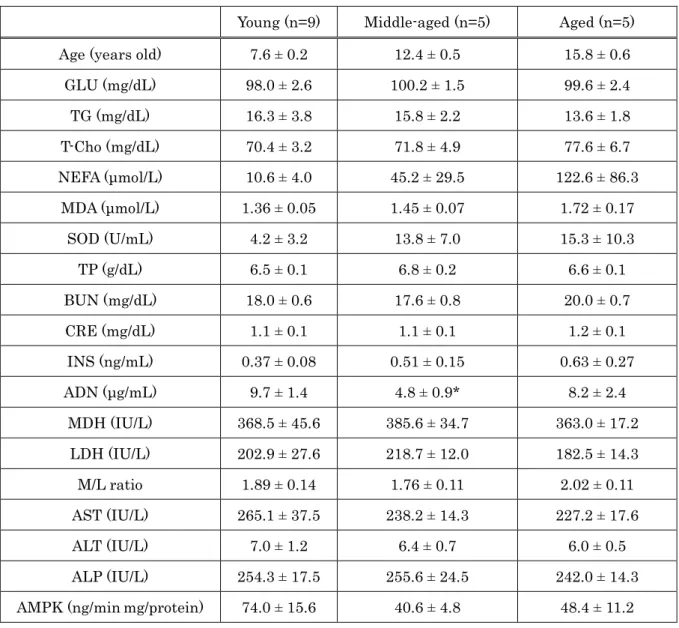
Table 3-1. Comparison of the biochemical and energy metabolism parameters between young, middle-aged and aged groups of riding horse
Young (n=9) Middle-aged (n=5) Aged (n=5)
Age (years old) 7.6 ± 0.2 12.4 ± 0.5 15.8 ± 0.6
GLU (mg/dL) 98.0 ± 2.6 100.2 ± 1.5 99.6 ± 2.4
TG (mg/dL) 16.3 ± 3.8 15.8 ± 2.2 13.6 ± 1.8
T-Cho (mg/dL) 70.4 ± 3.2 71.8 ± 4.9 77.6 ± 6.7
NEFA (μmol/L) 10.6 ± 4.0 45.2 ± 29.5 122.6 ± 86.3
MDA (μmol/L) 1.36 ± 0.05 1.45 ± 0.07 1.72 ± 0.17
SOD (U/mL) 4.2 ± 3.2 13.8 ± 7.0 15.3 ± 10.3
TP (g/dL) 6.5 ± 0.1 6.8 ± 0.2 6.6 ± 0.1
BUN (mg/dL) 18.0 ± 0.6 17.6 ± 0.8 20.0 ± 0.7
CRE (mg/dL) 1.1 ± 0.1 1.1 ± 0.1 1.2 ± 0.1
INS (ng/mL) 0.37 ± 0.08 0.51 ± 0.15 0.63 ± 0.27
ADN (μg/mL) 9.7 ± 1.4 4.8 ± 0.9* 8.2 ± 2.4
MDH (IU/L) 368.5 ± 45.6 385.6 ± 34.7 363.0 ± 17.2 LDH (IU/L) 202.9 ± 27.6 218.7 ± 12.0 182.5 ± 14.3
M/L ratio 1.89 ± 0.14 1.76 ± 0.11 2.02 ± 0.11
AST (IU/L) 265.1 ± 37.5 238.2 ± 14.3 227.2 ± 17.6
ALT (IU/L) 7.0 ± 1.2 6.4 ± 0.7 6.0 ± 0.5
ALP (IU/L) 254.3 ± 17.5 255.6 ± 24.5 242.0 ± 14.3 AMPK (ng/minmg/protein) 74.0 ± 15.6 40.6 ± 4.8 48.4 ± 11.2
Values are presented as mean ± SE.
*Denotes significant difference as compared to young group (Mann-Whitney U test, p<0.05).
3-4 Discussion
Consistent with our previous report (Kawasumi et al. 2015), plasma ADN level in the middle-aged group greatly decreased as compared to the young group (p=0.0136). However, in the aged group, this level appeared to increase again. ADN
is the most abundant protein secreted by white adipose tissue, and is one of the most thoroughly studied adipocytokines. As the protective action of ADN in obesity-linked diseases has been reported in numerous published articles, ADN has various beneficial effects on organs and tissues (Brochu-Gaudreau et al. 2010).
It was also demonstrated that low plasma ADN levels are associated with obesity, metabolic syndrome, diabetes, and many other metabolic diseases in humans (Lu et al. 2008). Hence, it is advantageous to enhance ADN ability in order to prevent metabolic-related disorders. For instance, exercise is one of the important stimuli, and it was reported that ADN levels in older people could be improved by exercise (Lira et al. 2011). Interestingly, they also suggested that the improvement of metabolic profile in older people was time-dependent, indicating that proper training strategy is needed to achieve maximal beneficial effects. Therefore, in this study, the recovery of ADN level in aged horses was thought to be due to their continuous daily exercises, and possibly, applying proper exercise protocol modification to the middle-aged horses can even lead to keeping higher ADN levels throughout their lives. Moreover, we focused on the signaling pathways that mediate the metabolic effects of ADN. Since ADN regulates glucose metabolism and insulin sensitivity through AMPK (Yamauchi et al. 2002), AMPK was also measured in the present study. Recent studies revealed that AMPK and its related cellular signaling pathways play a critical role in exercise-mediated adaptations in the muscle (Sasaki et al. 2014), and AMPK activation in response to a number of stimuli including exercise is a potential target for metabolic diseases (Zhang et al.
2009). Although all the horses we examined in this study had daily exercises and
maintained good physical health, the result showed that AMPK levels in both the middle-aged and the aged groups tended to decrease as compared to the young group. Unlike ADN, there was no distinct recovery of AMPK in aged horses. In general, exercise can trigger AMPK activation in a time and intensity dependent manner (Jorgensen and Rose 2008), but a number of other stimuli are involved with AMPK activation as well. Therefore, other factors may affect AMPK levels.
Furthermore, M/L ratio, one of the useful indicators of energy metabolism, showed that there was no apparent decline between any of the groups. Because basal metabolism usually declines with aging, this result may imply that continuous daily exercises can ameliorate the aging process and can prevent age-related decline in energy metabolism. Additionally, exercise intensity and duration are also important enhancing factors for improvement of energy metabolism. It was demonstrated that longer and low-intensity exercise improves insulin action and plasma lipids more than shorter and high-intensity exercise (Duvivier et al. 2013).
In contrast to race horses, all the riding horses in this study had moderate exercises on a daily basis, so their exercise protocol was advantageous for sustaining better energy metabolism. Although further studies should be required, continuous moderate exercise can be helpful for anti-obesity and/or anti-aging for horses.
Plasma NEFA levels tended to increase as the horses grow older. NEFA can induce inflammation through various mechanisms, and this chronic inflammation response is associated with dysfunction of metabolic and immune systems (de Heredia et al. 2012). However, NEFA levels in horses can be affected by several
factors, including duration and intensity of exercise (Li et al. 2012). Moreover, in this study, all the horses maintained good physical condition (EBCS 4), and there was no significant elevation in TG or T-Cho among all the age groups, so increased NEFA levels in middle-aged and aged horses may not be the result of lipid metabolism dysfunction. For further research, other triggers possibly affecting NEFA should be reviewed, and it is crucial to detect inflammatory changes induced by NEFA.
It has been commonly known that oxidative stress is associated with aging since Denham Harman proposed the Free Radical Theory of Aging in 1956 (Harman 1956). This theory states that aging is the cumulative result of oxidative damage caused by free radicals. Lipid peroxidation provoked by free radicals is possibly involved with the aging process because lipids are a major component of living organisms and can be the first target of free radicals (Praticò 2002). MDA is one of the final products of polyunsaturated fatty acids peroxidation in the cells, and overproduction of MDA indicates an increase in free radicals (Gaweł et al. 2004).
Therefore, MDA can be used as a marker of oxidative stress. The present study showed that there was no remarkable change in MDA concentrations between any of the groups. Moreover, SOD levels tended to increase in both the middle-aged and the aged groups as opposed to the young group. It might be suggested that SOD, which is an antioxidant enzyme, functioned and prevented from excess free radical formation. Interestingly, it was reported that low-intensity exercise can boost SOD activity and decrease MDA, but high-intensity exercise adversely affects the free radical scavenging ability of SOD, resulting in slowing the
reduction of MDA in rats (Li et al. 2015). Generally, exercise is important for health, but exercise intensity could be a key to improve the metabolic system more effectively. Therefore, the horses examined in this study possibly had the appropriate amount of exercise for enhancing SOD activity. Especially, given that middle-aged and aged horses at Japan Horseback Riding Club had more chances of riding lessons because of their manageability, their activity level could always be sufficient to retain SOD, as opposed to the young horses. Furthermore, the involvement of ADN in oxidative stress should be noted as well. Oxidative stress may be downregulated by ADN, resulting in an increase of SOD and a decrease of MDA (Wang et al. 2014). Although the definite correlation between ADN and oxidative stress was not confirmed in this study, different analysis such as molecular biological approaches should be applied to dig deeper into this matter.
This study has several limitations. First, a small number of healthy horses were available at Japan Horseback Riding Club, so we had a limited number of animals in our study. Second, since the animals involved in the study were randomly selected, there was no gender matching performed. Third, for the same reason as second, the classification of the age groups may not be appropriate. Fourth, all blood samples were collected postprandially, hence postprandial influence cannot be eliminated.