JAXA Special Publication JAXA-SP-09-008E 32
Electron Energy Spectrum of the West Lobe of Fornax A from a Hard X-ray Observation with Suzaku
Makoto S. Tashiro
1, Hiromi Seta
1, Yuichi Yaji
1, Naoki Isobe
2, and Keiko Matsuta
31
Department of Physics, Saitama University, 255 Shimo-Okubo, Sakura, Saitama, 338-8570, Japan
2
Department of Astronomy, Kyoto University, Kitashirakawa-Oiwake, Sakyo, Kyoto, 606-8502
3
ISAS/JAXA, 3-1-1 Yoshinodai, Sagamihara, 229-8510, Japan E-mail(MST): [email protected]
Abstract
Suzaku Hard X-ray observation of the archetypical X-ray emitting radio lobe object Fornax A (NGC 1316) is reported. The results firstly revealed a non-thermal X-ray spectrum up to 20 keV from the lobe, and showed that a single component of non-relativistic electron with an energy distribution over a two order of magnitudes generates both the X-ray and radio emissions. On the basis of observations made with Suzaku, the present paper shows that a 0.7 – 20 keV spectrum is well described by a single power-law model with an energy index of 0.68 and a flux density of 0.12 ± 0.01 nJy at 1 keV from the West lobe.
Utilizing published radio data, the multiwavelength spectrum shows an undoubtable single electron energy, distribution over a Lorentz factor γ = 300 − 90000, generating both the X-ray and radio emissions.
Key words: Active Galactic Nucleus: Radio Galaxy — Radio Lobe — Hard X-ray Observation
1. Introduction
The radio lobe object Fornax A is the first object from which cosmic microwave background (CMB) boosted inverse-Compton (IC) lobe X-rays are detected (Feigel- son et al. 1995; Kaneda et al. 1995: K95 hereafter).
Following the discovery, a number of radio lobes have been observed to reveal electron and magnetic energy densities in the lobes (e.g. Isobe et al. 2006: I06 here- after), including Fornax A itself (Tashiro et al. 2001:T01 hereafter; Kim & Fabianno 2003; I06). Although all of these analysis assumed a single energy distribution of the relativistic electrons in the lobes, it is estimated that the observed synchrotron radio emissions are produced by electrons whose Lorentz factor of γ = 4000 − 60000 while the observed inverse-Compton X-rays below 10 keV are produced by electrons of γ = 1000 − 3000. This energy gap between the two observation bands leaves rooms of discrepancy between synchrotron electrons and inverse- Compton electrons. One is a possible spatial distribution discrepancy and the other is a possibility of a break or cut off between the two energy range of electrons. Only a hard X-ray observation above 10 keV fills the gap. Uti- lizing the hard X-ray detector (HXD) on board Suzaku, we observed the archetypical radio lobe object Fornax A and succeeded to observe 0.7 to 20 keV spectrum. De- tailed description is presented in Tashiro et al. (2009).
2. Observation and Results
Suzaku observations of the Fornax A West lobe were performed between 2005 December 23 20:51 UT and De- cember 26 14:40. Since the field of view of the HXD is so wide that it covers the host galaxy in the same field of view, we also performed offset observation point- ing at the host galaxy in order to evaluate the X-ray contamination from the host galaxy and the non-X-ray background (NXB). The HXD and XIS were operated in nominal mode throughout the observations.
The entire XIS field of view of 18
× 18
is covered with the extended emission. As previously reported by T01, the lobe X-ray emission extends up to 12
in radius, which fills the entire radio lobe region. In the following analysis, we set the circle data acquisition region with a radius of 7.
25 according to previous works (K95; T01).
Background subtraction is the key in the HXD data reduction procedure. Here we employed model back- grounds of NXB (Fukazawa et al. 2007) and CXB (Bolt et al. 1987) for the HXD data, after confirming that it is consistent with those spectra obtained from the offset observation or from the earth occulted time regions.
Thus we obtained the background-subtracted spectra from the XISs and HXD through 0.7 – 20 keV. After evaluating thermal emissions from surrounding gas, we introduced the spectral slope determined by radio ob- servation, and evaluated the XIS-HXD/PIN spectrum.
This document is provided by JAXA.
The Energetic Cosmos : from Suzaku to ASTRO-H 33
Suzaku West Lobe
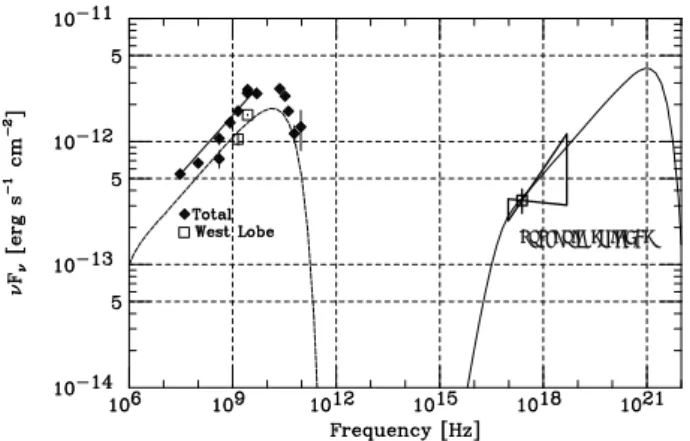
Fig. 1. Spectral energy distribution from the West lobe (open squares) and total (filled diamonds). Derived models for the synchrotron emission (dashed line) and the CMB-boosted IC emissions (solid line) are shown with lines (see Tashiro et al. 2009 and references therein).
We obtained the best fit X-ray flux density at 1 keV of 0.12 ± 0.01 nJy, with an energy index of 0.68 (fixed), and confirmed that the newly obtained fitting parameters are consistent with those presented in previous reports (K95;
T01) Note that we showed only the nominal tuned-NXB subtracted HXD/PIN spectrum above as the most con- servative case. However we also confirmed that there was no significant difference in the obtained best fit pa- rameters whether we employed the nominal or rescaled NXB.
3. Discussion and Conclusion
Employing the derived power law component for the dif- fuse hard X-rays, we plotted the spectral energy distri- bution (SED) together with the radio spectra in figure 1.
An X-ray spectrum following a single power law dis- tribution, which does not smoothly connect to the syn- chrotron component, requires another origin. The IC process is the most promising origin for the observed hard X-rays reported so far. In accordance with Harris and Grindlay (1979), we derived the estimated energy density of the electrons and the magnetic field energy density to be u
e= (5.1 ± 1.0) × 10
−13erg cm
−3and u
m= (0.67 ± 0.08)η
−1× 10
−13erg cm
−3, respectively, where η is the filling factor of magnetic field against the electron spatial distribution. Here, we assumed an elec- tron Lorentz factor of γ = 300 − 90000, as we describe below, and included the systematic errors arising from the ambiguity of the reported radio flux and slope ac- cording to § 4 in I06. Adopting the above values, we cal- culated the CMB boosted IC spectrum and plotted the results in the obtained SED in figure 1. We assumed an electron differential energy spectrum with a single power law distribution of
N
γ= 2.0 × 10
−6γ
−2.36electrons cm
−3,
with the lower boundary electron energy distribution of γ = 300 to describe the lower energy end of the de-
tected X-rays. Similarly, we set the upper boundary of γ = 90000 in accordance with the higher end of the radio observation of the total lobe observations. The calculation program was written to use the SSC equa- tions presented in Kataoka (2000), to which we added the CMB/IC spectrum, and it can be seen that it pro- vides a good description of the obtained multiwavelength data.
The electron Lorentz factor of γ = 300 − 4000 is re- quired by the CMB/IC X-ray spectrum in the range of 0.7 – 20 keV, where we employed the nominal (or rescaled) NXB model for the HXD/PIN. At the same time, adopting the derived magnetic field, the observed synchrotron radiation spectrum requires a Lorentz factor of γ > 4200. Thus, we conclude that a single electron energy distribution can naturally explain the two inde- pendent measurements in radio and X-ray bands. We also note that the derived electron and magnetic field energy densities are not only consistent with those de- termined in previous reports (T01) but are also in very good agreement with those determined for the East lobe (I06).
References
Bolt, E. 1987, in Observational Cosmology; Proceedings of the IAU Symposium, ed. Dordrecht, D. (Reidel Publishing Co.), 611
Feigelson, E. D. et al. 1995 ApJ., 149, L149 Fukazawa, Y. et al. 2009 PASJ., 61, S17 Kaneda, H. et al. 1995 ApJ., 453, L13 (K95) Kim, D.-W. & Fabbiano, G. 2003 ApJ., 586, L826 Harris, D. E. & Grindlay, J. E. 1979 MNRAS., 188, 25 Isobe, N. et al. 2006 ApJ., 645, 256 (I06)
Kataoka, J. 2000 Ph. D thesis, University of Tokyo Tashiro, M. et al. 2001 ApJ., 546, L19 (T01) Tashiro, M. S. et al. 2009 PASJ., 61, S327
This document is provided by JAXA.